ECONOMIC IMPLICATIONS OF CIGARETTE TAXATION IN PAKISTAN: An Exploration through A CGE Model
←
→
Page content transcription
If your browser does not render page correctly, please read the page content below
Research Report

ECONOMIC
IMPLICATIONS OF
CIGARETTE TAXATION
IN PAKISTAN:
An Exploration through
A CGE Model

2021

              Social Policy and Development Centre | Karachi
                                              www.spdc.org.pk
Research Report

Economic Implications of Cigarette
     Taxation in Pakistan:
  An Exploration through a CGE Model

   Social Policy and Development Centre
                August 2021
The University of Illinois Chicago’s (UIC) Institute for Health Research and Policy is funding
a group of economists to develop evidence-based policy support for effective tobacco tax
policies in low- and middle-income countries with the highest rates of tobacco
consumption. The global collaboration on the economics of tobacco is facilitated through
Tobacconomics, a web-based platform. UIC is a partner of the Bloomberg Initiative to
Reduce Tobacco Use.
The Social Policy and Development Centre (SPDC) is funded by the UIC Institute for Health
Research and Policy to conduct economic research on tobacco taxation in Pakistan. The
views expressed in this report cannot be attributed to, nor do they represent, the views of
UIC, the Institute for Health Research and Policy, or Bloomberg Philanthropies.
Editing Support: Sana Lokhandwala
Graphics and Designing: Muhammad Rizwanullah Khan
II Economic Implications of Cigarette Taxation in Pakistan: An Exploration through A CGE ModelThe Research Team
Muhammad Sabir
Wasim Saleem
Muhammad Asif Iqbal
Naveed Aamir
Economic Implications of Cigarette Taxation in Pakistan: An Exploration through A CGE Model
IIIIV Economic Implications of Cigarette Taxation in Pakistan: An Exploration through A CGE Model
Contents
                                                                                                                                                                              Pages

        Executive Summary ....................................................................................................................................... 1

1.      Introduction ..................................................................................................................................................... 3
        Research Objectives ..........................................................................................................................................................3
        Scope of the Research ......................................................................................................................................................4
        Structure of the Report....................................................................................................................................................5

2.      Raw Tobacco, the Cigarette Industry and the Macroeconomy....................................................... 6
        Value-Added of Tobacco and Cigarettes in Pakistan .........................................................................................6
        Exports of Tobacco and Cigarettes .............................................................................................................................7
        Employed Labor Force ................................................................................................................................................. 8
        Consumption of Cigarettes ......................................................................................................................................... 9

3.      Tobacco Tax Policy ..................................................................................................................................... 10
        Tobacco Taxes in Pakistan ........................................................................................................................................ 10
        Revenue Performance ................................................................................................................................................. 11
        Recent FED Reforms .................................................................................................................................................... 12
        Cigarette Prices and FED Policy Choice ............................................................................................................... 13

4.      Empirical Strategy for Policy Analysis ................................................................................................ 15
        CGE Models and Tobacco Tax Policy Analysis .................................................................................................. 15
        Empirical Strategy: The Building Blocks ............................................................................................................ 16
          Aggregate Production Sectors and Commodities ..................................................................................... 17
          Construction of SAM .............................................................................................................................................. 19
          Structure of the CGE Model ................................................................................................................................ 20
          Transmission Channels of the Tax Rate Changes on the Economy ................................................... 23

5.      Policy Analysis .............................................................................................................................................. 25
        Key Assumption and Magnitude of Shock .......................................................................................................... 25
        Simulation Results ........................................................................................................................................................ 25
           Impact on Indirect Taxes ..................................................................................................................................... 27
           Impact on Household Consumption ............................................................................................................... 27
           Impact on Raw Tobacco Production ............................................................................................................... 27
           Impact on the Cigarette Industry ..................................................................................................................... 27
           Impact on Employment ........................................................................................................................................ 27
           Impact on the Rest of the Economy ................................................................................................................ 28
        Summary of Results ..................................................................................................................................................... 28

6.      Conclusion and Policy Recommendations ......................................................................................... 30
        Policy Implications ....................................................................................................................................................... 30

References .............................................................................................................................................................. 32

                                   Economic Implications of Cigarette Taxation in Pakistan: An Exploration through A CGE Model
                                                                                                                                                                                          V
List of Tables Pages
Table 1: Value added of tobacco and cigarettes in Pakistan .................................................................................. 7
Table 2: Export of tobacco and cigarettes in Pakistan ............................................................................................. 8
Table 3: Major indirect taxes on cigarettes in Pakistan ........................................................................................ 10
Table 4: Collection of Indirect Taxes on Cigarettes in Pakistan (million Rs) ............................................... 11
Table 5: Share of cigarette taxes in total indirect taxes (%) ............................................................................... 11
Table 6: Structure of Federal Excise Duty on cigarettes ....................................................................................... 12
Table 7: Mapping of 81 sectors input-output (I-O) matrix in 13 sectors ...................................................... 19
Table 8: Description of Pakistan SAM accounts ....................................................................................................... 20
Table 9: Magnitude of shock ............................................................................................................................................. 25
Table 10: Simulation results—the impact of increase in FED rate to 70% of the retail price ................ 26
List of Charts Pages
Figure 1: Share of the cigarette industry in industrial employment (%) ........................................................... 9
Figure 2: Production of cigarettes and effective FED rates ................................................................................... 13
Figure 3: Price of a 20-cigarette pack of the most-sold brands in 2018 .......................................................... 14
Figure 4: Federal Excise Duty as a percentage of indicative consumer price in Pakistan ........................ 14
Figure 5: Production and intermediate consumption ............................................................................................. 18
Figure 6: Schematic diagram of the model ................................................................................................................... 24
VI Economic Implications of Cigarette Taxation in Pakistan: An Exploration through A CGE ModelAcronyms
ADB Asian Development Bank
CES Constant Elasticity of Substitution
CGE Computable General Equilibrium
COVID Coronavirus Disease
FBR Federal Board of Revenue
FED Federal Excise Duty
GDP Gross Domestic Product
GST General Sales Tax
HIES Household Integrated Economic Survey
IO Input-Output
MPIA Modelling and Policy Impact Analysis
PIDE Pakistan Institute of Development Economics
SAM Social Accounting Matrix
SDGs Sustainable Development Goals
SNA System of National Accounts
SPDC Social Policy and Development Centre
WHO World Health Organization
Economic Implications of Cigarette Taxation in Pakistan: An Exploration through A CGE Model
VIIVIII Economic Implications of Cigarette Taxation in Pakistan: An Exploration through A CGE Model
Executive Summary

The macroeconomic impacts of tobacco taxation is an under-researched
subject in Pakistan. The lack of empirical evidence often leads to an inflated
perception of the size and contribution of the tobacco industry to the
economy. This study analyzes the macroeconomic and distributional impacts
of the change in tobacco use prevalence resulting from a change in tobacco
taxes in Pakistan. Using a methodology based on computable general
equilibrium (CGE) modeling, the study estimates the impact of tax increases
on tax revenues, consumption of tobacco products, raw tobacco production,
cigarette manufacturing, employment, and the overall economy.

Key findings of the study are the following:
•   Tobacco farming and cigarette manufacturing make a small contribution
    to Pakistan’s economy—less than 0.5 percent of the country’s gross
    domestic product (GDP). The cigarette industry employs 0.2 percent of
    the industrial labor force.
•   The excise tax rates on cigarettes as a share of retail price are much lower
    than the widely-accepted benchmark of 70 percent tax share of the retail
    price. Currently, the excise tax share of retail price on low-priced and
    high-priced cigarettes is 41 percent and 57.8 percent, respectively.
•   To raise the effective excise tax share to 70 percent of retail price would
    require a tax increase of 285.1 percent, leading to a 154.9 percent
    increase in the price of cigarettes. Results of a simulation of this scenario
    suggest that, due to the proposed increase in the tax rate:
    o   Consumption of cigarettes would decline by 32.5 percent. However,
        due to the increase in cigarette prices, household consumption
        expenditure on cigarettes would increase by 73.3 percent. The
        overall household spending is expected to increase by 0.7 percent.
    o   Despite the decline in cigarette consumption, the tax revenue from
        cigarettes would increase by 102 percent due to higher cigarette
        prices, while overall indirect tax revenue from all sources would
        increase by 6 percent.
    o   The reduction in tobacco demand would cause a decrease in raw
        tobacco output by 7.8 percent.
    o   The output of the cigarette industry would decline by 32.4 percent,
        which would lead to a 41.5 percent decline in employment income in
        the cigarette industry. However, the overall employment income in

                    Economic Implications of Cigarette Taxation in Pakistan: An Exploration through a CGE Model   1
the economy would increase by 0.5 percent. It is also important to
mention that in absolute rupee term, the decline in employment
income in the tobacco sector (including tobacco growing and the
cigarettes industry) is Rs 0.83 billion compared to an increase of 67.4
billion in employment income in other sectors. Therefore, the gains
in employment income in other sectors would be 81 times the loss in
the tobacco sector. In the same way, there would be a reduction of
13,150 jobs in the tobacco sector while 321,700 jobs will be created
in the other sectors, leading to a net increase of 308,550 jobs in the
economy.
o An increase in tax revenues would results in higher public savings,
which in turn would lead to increased investment in the economy. As
a result, the output of the other sectors would increase, leading to an
increase in the value added and the household income from factors
of production employed in these sectors. Overall household income,
gross value added, and output would increase by 0.13 percent, 0.12
percent, and 0.03 percent, respectively.
While a reduction in cigarette consumption would result in a decline in the
output of raw and manufactured tobacco—leading to a reduction in income
for tobacco farmers and employees of the cigarette industry—the overall
impact on the economy (in terms of income, value-added, and output) are
positive, though small in magnitude. Therefore, raising excise tax to 70
percent of the retail price would not adversely affect the economy.
2 Economic Implications of Cigarette Taxation in Pakistan: An Exploration through a CGE Model1 Introduction
The inclusion of the Framework Convention on Tobacco Control of the World
Health Organization (WHO) in the Sustainable Development Goals (SDGs)
recognized the prevalence of tobacco use as a critical development challenge.
However, in the case of Pakistan, the perceived macroeconomic benefits of
tobacco—visible tax revenues, the contribution of the tobacco sector to
Gross Domestic Product (GDP) and employment, and perceived foreign
exchange earnings from tobacco exports—often mislead stakeholders about
the aggregate macroeconomic impacts of tobacco use. The industry claims
that higher taxes on cigarettes would lead to a higher unemployment level
and hurt the agriculture sector by reducing the demand for raw tobacco.
In contrast to the industry’s claims, a recent study on Pakistan’s tobacco
sector (SPDC, 2018) showed that a decrease in cigarette consumption would
have a relatively small impact on the economy in terms of job losses, income
levels, and output. By assuming that saved income from the reduction in
tobacco consumption is fully redistributed to other sectors, the study
suggests that higher taxation would lead to a net positive impact on the
economy in the medium to long term. While this is a plausible assumption,
the analysis did not include re-distributional impact at the household level.
Since the study was based on the input-output (I-O) multiplier model, the
research did not capture the channel through which changes in taxes impact
income redistribution in the macroeconomic structure and welfare of the
consumers and producers of tobacco and tobacco products.
Research Objectives
The overall objective of this research is to analyze the macroeconomic and
distributional impacts of the change in the prevalence of tobacco use due to
a change in tobacco taxes in Pakistan. The study estimates the changes in
output, income, and employment for tobacco-related agriculture and
industrial sectors and simulates its impact on the rest of the economy
resulting from the changes in tobacco use. The study also estimates the direct
impact that tobacco taxation changes would have on government revenues,
household tobacco consumption, employment, and investment in the
tobacco industry. Moreover, it examines the ripple effects of tobacco taxation
by analyzing household consumption of other commodities, sector-wise
employment, and investment patterns.
Economic Implications of Cigarette Taxation in Pakistan: An Exploration through a CGE Model 3Specific objectives of the study are:
1. To investigate the impact of higher tobacco taxes on cigarette
consumption and tax revenue from cigarettes.
2. To assess the impact of the decline in cigarette consumption on tobacco-
related agriculture and industrial sectors along with its impacts on the
macroeconomic structure of the country.
3. To analyze the distributional impacts of changes in the tax rates and
cigarette consumption on households, tobacco growers, and the
employees of cigarette manufacturers.
This research uses computable general equilibrium (CGE) modeling to
investigate the effects of a decline in tobacco prevalence from a higher tax
rate in Pakistan. The choice of a CGE framework is based on its ability to
capture the entire economy to analyze the impacts of various policy choices.
The holistic approach of this framework helps in understanding the trade-
offs for informed policy choices.
Scope of the Research
In line with the research objectives, the scope of the study is limited to the
impacts of cigarette tax changes on the consumption of the product,
government revenues, broad macroeconomic structure, consumer welfare,
tobacco producers, and employees of the cigarette manufacturing industry.
The impact of tax changes on the level of public spending is beyond the
research scope because of the defined structure of the multisector CGE.
The choice of a CGE model has three main advantages. First, CGE models are
based on well-developed economic theories (Vargas et al., 1999) and are
firmly founded in microeconomic theory. This allows for analysis of micro–
macro linkages, which are important for distributional and welfare analysis.
Second, these models consider the production linkages, economic flows, and
their interactions in a flexible and theoretically consistent manner. Since a
shock in one sector is likely to induce changes in other sectors of the
economy, CGE automatically takes care of intersectoral implications and
their impact on the overall macroeconomy. Third, CGE models are extensions
of I-O multiplier models and the social accounting matrix (SAM), which have
been widely used for decades to measure the effects of public policies. CGE
models extend these older models to analyze substitution possibilities
between the factors of production. For example, on the basis of production
elasticities they highlight a possible range of labor- and capital-intensive
technology choices. Also, through the circular flow of income across
consuming households and producing industries, CGE models help quantify
the distribution implications of such choices. Finally, they incorporate tax
impacts through explicit price effects (Feltenstein et al., 2013).
4 Economic Implications of Cigarette Taxation in Pakistan: An Exploration through a CGE ModelFor the proposed study, the flexibility of the CGE framework is vital because
it provides the ability to alter specifications in response to analytical needs.
The framework also allows for incorporating tax increases in explicit price
effects to analyze the distributional and welfare effects.
Structure of the Report
This report consists of six sections. Section 2 presents a descriptive analysis
of the tobacco sector in the context of the overall economy. Tobacco tax
policy is discussed in Section 3, which presents a brief analysis of tax
collection from the cigarette industry under major indirect taxes and
highlights recent reforms and challenges. Section 4 discusses the structure
of the SAM and the CGE model, while Section 5 presents the baseline scenario
and results of policy simulations performed through the CGE model. Finally,
Section 6 summarizes the main findings of the study and policy
recommendations.
Economic Implications of Cigarette Taxation in Pakistan: An Exploration through a CGE Model 5Raw Tobacco, the Cigarette
2 Industry and the
Macroeconomy
Pakistan is among the top ten raw tobacco producers in the world. 1 This
global ranking in producing raw tobacco sometimes leads to an inflated
perception of the role and size of the tobacco industry in Pakistan’s economy.
For instance, tobacco industry argues that tobacco farming, tobacco
manufacturing, and their linkages with the macroeconomy produce a
significant contribution to the economy; the tobacco industry is supposedly
not only making a significant contribution to large-scale manufacturing but
is also creating direct and indirect employment in the country. 2 Apart from
this, the cigarette industry also has significant fiscal implications in terms of
contributing to tax revenues. 3 To set the context, this section provides a
snapshot of the contribution of raw and manufactured tobacco to Pakistan’s
macroeconomy by using the latest-available statistics.
Value-Added of Tobacco and Cigarettes in Pakistan
While Pakistan was ranked as the ninth-largest tobacco grower in the world
in 2018, 4 tobacco remains a minor crop in the agriculture sector of the
country. Tobacco crops occupied an area of 47 thousand hectares out of 23.5
million hectares in 2019–20,5 reflecting a meager share of 0.2 percent of the
total cropped area. The production of tobacco in 2019–20 was 104 thousand
tons and has fluctuated between 100 and 116 thousand tons during the last
five years (Table 1).
In terms of value, raw tobacco production accounts for less than 0.5 percent
of cropped value added. At a constant average harvest price of 2005–06, its
value added hovered around Rs 3 billion during the last five years. The share
of tobacco in the total value of the crop sector has remained at less than 0.4
percent.
As far as the trend in cigarette production is concerned, massive fluctuations
have been observed during the last five years. For instance, the production
of cigarettes dropped from 53.5 billion sticks in 2015–16 to just 34.3 billion
sticks in 2016–17, indicating a sharp decline of almost 36 percent. In the next
year, it sharply increased to more than 59 billion sticks, exhibiting a growth
of almost 72 percent. The Social Policy and Development Centre (SPDC)
1 http://www.fao.org/faostat/en/#rankings/countries_by_commodity
2 See,for example, Majid et al. (2017), Ali et al. (2015).
3 Of course, cigarette consumption also has public health implications, but these are not
covered in this research.
4 http://www.fao.org/faostat/en/#rankings/countries_by_commodity
5 Pakistan Economic Survey 2019–20, Statistical Supplement, Table 2.2.
6 Economic Implications of Cigarette Taxation in Pakistan: An Exploration through a CGE Model(2018) has shown that fluctuation in the declared production can be linked
to changes in tax policy during 2015–16 and 2017–18. However, the decline
in 2019–20 may be attributed to the COVID-19 lockdown. The impact of
fluctuations in production is also visible in the estimated value added of
cigarettes and its share in large-scale manufacturing.
The estimated shares of the tobacco and cigarette sectors in Pakistan’s GDP6
are also presented in Table 1. It appears that the tobacco and cigarette
manufacturing sectors contribute less than 0.5 percent of GDP. Though
second-order ripple effects are not accounted for, the estimates provide a
fair reflection of the tobacco sector’s contribution to GDP.
Table 1: Value added of tobacco and cigarettes in Pakistan
Unit 2015–16 2016–17 2017–18 2018–19 2019–20
Tobacco Value-Added
Production of tobacco thousand tons 116 100 107 104 110
Value-added of tobacco* billion Rs 3.33 2.88 3.07 2.99 3.17
Share in crops value-added* % 0.40 0.35 0.35 0.36 0.37
Cigarette Value-Added
Production of cigarettes billion sticks 53.6 34.3 59.1 60.7 46.1
Value-added of cigarettes* billion Rs 43.7 28.1 48.3 49.6 37.7
Share in value-added of large- % 3.70 2.20 3.60 3.80 3.20
scale manufacturing*
Share of Value-Added of Tobacco and Cigarettes in GDP
Tobacco % 0.03 0.02 0.02 0.02 0.03
Cigarettes % 0.39 0.24 0.39 0.39 0.30
Combined % 0.42 0.26 0.42 0.42 0.33
* At 2005–06 prices
Source: SPDC estimates based on Economic Survey of Pakistan 20019–20, Finance Division, Government of Pakistan
Exports of Tobacco and Cigarettes
Given that Pakistan is a trade-deficit country, another important aspect may
be to look at the role of tobacco and cigarette manufacturing in foreign
exchange earnings. Table 2 provides the value of exports of raw tobacco and
cigarettes during the last five years. It shows that the nominal value of
tobacco exports grew from Rs 1 billion in 2015–16 to almost Rs 2.9 billion in
2018–19. In 2019–20, it declined to Rs 2.6 billion. Similarly, the share of raw
tobacco exports increased from 12.4 percent in 2015–16 to almost 26
percent in 2018–19 and then declined to 17.4 percent in 2019–20. Despite
6 GDP excluding indirect taxes and subsidies.
Economic Implications of Cigarette Taxation in Pakistan: An Exploration through a CGE Model 7the growth in the share of tobacco exports, more than three-quarters of the
tobacco produced is used by domestic producers of cigarettes. In dollar
terms, raw tobacco exports earned US$ 16.7 million7 in 2019–20, which is
less than 0.1 percent of Pakistan’s total exports.
The export of cigarettes is even lower than that of raw tobacco and remains
below half a billion rupees. In 2018–19, exports of manufactured cigarettes
were valued at slightly more than Rs 220 million, which is about US$ 1.6
million, or ten times less than the exports of raw tobacco. Overall, more than
99.6 percent of manufactured cigarettes are used for domestic consumption.
In summary, the exports of raw tobacco and manufactured cigarettes do not
generate a significant amount of foreign exchange. Considering this situation,
the structure of the CGE model in this research is based on a closed economy
instead of an open economy.
Table 2: Export of tobacco and cigarettes in Pakistan
Unit 2015–16 2016–17 2017–18 2018–19 2019–20
Tobacco Exports
Exports of raw tobacco million Rs 1,066 1,305 2,557 2,866 2,638
Value-added of tobacco million Rs 8,629 8,801 10,456 11,048 15,193
Share in exports in value-added % 12.4 14.8 24.4 25.9 17.4
Cigarette Exports
Exports of cigarettes million Rs 154 168 344 277 224
Value-added of cigarettes million Rs 183,176 200,243 107,964 185,666 236,154
Share in exports in value-added % 0.08 0.08 0.32 0.15 0.09
Source: SPDC estimates based on Foreign Trade Statistics and Pakistan Statistical Year Book, Pakistan Burau of Statistics
Employed Labor Force
Generally, tobacco growing is considered a labor-intensive sector in
Pakistan. However, detailed information about employment in tobacco
cultivation (as per the industrial classification) is not available in the labor
force surveys conducted by the Pakistan Bureau of Statistics.8 Therefore, the
analysis is limited to employment in cigarette manufacturing abstracted
from micro data sets of labor force surveys. The estimates show that the total
number of employed persons in cigarette manufacturing was 30,400 in
2017-18. Figure 1 presents the trend in the share of the employed labor force
in cigarette manufacturing in Pakistan. Cigarette manufacturing accounted
7Average exchange rate is applied.
8Estimates based on Pakistan Labor Force Survey 2014-15 show that a total number of
8,200 persons were engaged in tobacco farming in Pakistan. This information, however, is
not available in the subsequent survey of 2017-18.
8 Economic Implications of Cigarette Taxation in Pakistan: An Exploration through a CGE Modelfor 0.2 percent of industrial employment in 2017–18, which had declined
from 0.5 percent in 2010–11. The low share of employment indicates that
the cigarette industry is not labor-intensive, while the declining trend is a
reflection of a decline in production in 2017–18 compared to 2010–11 and
2014–15.
Figure 1: Share of the cigarette industry in industrial employment (%)
2017-18 0.2
2014-15 0.3
2010-11 0.5
Source: Authors’ estimates based on micro data sets of Labour Force Survey of Pakistan
Consumption of Cigarettes
The average per capita annual spending on cigarettes (in current prices) was
almost Rs 700 in 2018–19—the poorest 20 percent spent Rs 502 per capita,
while the richest 20 percent spent Rs 941. The trend in spending at constant
2010–11 prices shows that per capita expenditures declined in 2015–16 and
2018–19 compared to 2010–11. The sharpest decline occurred in the upper-
middle-income group, while there was a modest decline in the poorest 20
percent. This indicates that the per capita expenditure of the poorest quintile
was relatively higher in 2018–19 in comparison with other income groups
compared to 2010–11.
In summary, the descriptive analysis presented in this section provides some
important insights. First of all, despite being one of the top ten tobacco-
producing countries, the role of tobacco growing and manufacturing in
Pakistan is rather limited. These sectors consist of less than 0.5 percent of
GDP. Their contribution to exports is meager, around US$ 20 million.
Moreover, almost all manufactured cigarettes are consumed in the domestic
market—a situation that sets the stage for a closed economy with limited
scope for the rest of the world. The cigarette industry is not labor-intensive,
as it employs 0.2 percent of industrial employment. Finally, consumers
spend a sizeable amount on cigarettes. While in real per capita terms, annual
expenditure on cigarettes shows a declining trend overall, this is less visible
in the poorest 20 percent.
Economic Implications of Cigarette Taxation in Pakistan: An Exploration through a CGE Model 93 Tobacco Taxation Policy
Tobacco taxation policy in Pakistan has a dual objective—discouraging
smoking and raising revenues. This section presents a brief overview of
tobacco taxes and revenue performance, summarizes recent policy reforms,
and highlights some ongoing challenges.
Tobacco Taxes in Pakistan
Taxes can be divided into direct and indirect taxes. Income and corporate
taxes are largely categorized as direct taxes, while taxes on consumption,
production, and imports are considered indirect taxes. With regard to
tobacco taxation, income and corporate taxes are not commodity-specific
taxes and, therefore, cannot be classified as tobacco taxes. Apart from direct
taxes, three major indirect taxes prevail in Pakistan. These include general
sales tax (GST) on domestic production and imports, Federal Excise Duty
(FED) applicable on specific goods, and import duties applicable on imports.
A variety of taxes are levied on tobacco and related products (see Table 3).
The FED on cigarettes is the largest source of revenue from the tobacco
sector; it accounts for almost 80 percent of the revenue from the sector and
is considered a major and specific tobacco tax. The second-largest revenue
source is the domestic sales tax on the production of cigarettes. There is also
a tobacco development cess levied by provincial governments on the output
from the cultivation of tobacco. The tobacco development cess is a relatively
small source of revenue due to its small production base.
Table 3: Major indirect taxes on cigarettes in Pakistan
Tax Name Stage Collecting Authority
Domestic Taxes
Federal Excise Duty Retail price
Federal Board of Revenue
Sales Tax Domestic Retail price
Taxes on Imports
Import Duty Import value
Federal Excise Duty Import value Federal Board of Revenue
Sales Tax on Imports Retail price
Tobacco crop
Tobacco Development Cess Provincial Tax Authorities
production
Source: Federal Board of Revenue (FBR), Government of Pakistan
10 Economic Implications of Cigarette Taxation in Pakistan: An Exploration through a CGE ModelRevenue Performance
The revenue performance of indirect taxes collected from cigarettes is
shown in Table 4. Domestic taxes account for around 99 percent of all taxes
collected from cigarettes. The FED revenue collection was low in 2016–17
and 2017–18 (Rs 66.3 billion and Rs 67.1 billion, respectively) as compared
to 2015–16, 2018–19, and 2019–20, where average FED revenue in these
three years was almost Rs 90 billion.
Domestic sales tax, which is applied at the rate of 17 percent of the printed
retail price (including FED), also followed the same trend. However, in 2019–
20, while FED experienced a marginal decline of 1.7 percent, domestic sales
tax showed a marginal growth of 0.5 percent. This deviation indicates an
increase in cigarette prices excluding FED, despite a decrease in production
(Table 2).
Table 4: Collection of indirect taxes on cigarettes in Pakistan (million Rs)
2015–16 2016–17 2017–18 2018–19 2019–20
Domestic Taxes
Federal Excise Duty 90,544 66,299 67,116 90,166 88,620
Sales Tax Domestic 23,767 17,562 20,527 23,109 23,231
Total - Domestic 114,311 83,861 87,643 113,275 111,851
Taxes on Imports
Import Duty 165 181 357 817
Sales Tax on Imports 344 301 285 631
Federal Excise Duty 374 26 23 633
Total - Imports 883 508 665 2081
Total indirect tax on cigarettes 115,194 84,369 88,308 115,356 111,851
Share of domestic taxes (%) 99.2 99.4 99.2 98.2
Share of taxes on imports (%) 0.8 0.6 0.8 1.8
Source: FBR Yearbook 2018-19 & 2019-20
Table 5: Share of cigarette taxes in total indirect taxes (%)
2015–16 2016–17 2017–18 2018–19 2019–20
Domestic Taxes
Federal Excise Duty 4.78 3.28 2.91 3.78 3.58
Sales Tax Domestic 1.25 0.87 0.89 0.97 0.94
Total - Domestic 6.03 4.14 3.80 4.75 4.52
Taxes on Imports
Import Duty 0.01 0.01 0.02 0.03
Sales Tax on Imports 0.02 0.01 0.01 0.03
Total - Imports 0.03 0.02 0.03 0.06
Total 6.06 4.17 3.83 4.81 4.52
Source: FBR Yearbook 2018–19 & 2019–20
Economic Implications of Cigarette Taxation in Pakistan: An Exploration through a CGE Model 11As shown in Table 5, the share of taxes on imports is less than 0.1 percent of
the net indirect taxes. In contrast, domestic taxes contributed more than six
percent in 2015–16. However, their contribution declined to 4.1 percent in
2016–17 and dropped further to 3.8 percent in 2017–18. In subsequent
years, domestic taxes on cigarettes contributed more than 4.5 percent of
indirect taxes.
Recent FED Reforms
Before 2013, the structure of FED on cigarettes in Pakistan was a mix of a
specific tax on low-priced brands, an ad valorem tax on high-priced brands,
and a combined specific and ad valorem tax on mid-priced brands. In 2013,
the ad valorem tax was withdrawn with the introduction of a two-tier
structure of specific taxes based on a range of retail prices (exclusive of GST).
Until 2016–17, the two-tier system remained intact, with an annual upward
revision of tax rates of both tiers (Table 6). As shown in Figure 2, there was
a massive drop in the declared production of cigarettes in 2016–17 (from 53
billion sticks to 34 billion sticks), which led to a decline in revenues (see
Table 4). Following this, a three-tier excise duty structure was introduced in
2017–18 with a new tier for low-priced brands. The reason for this change,
as stated by the government, was to combat the illicit trade in cigarettes by
reducing the price differential for the lowest tier and enhancing revenue by
increasing the share of duty-paid cigarettes (SPDC, 2018). However, the
change in the FED structure did not meet the objective, as the production
level was regained by the industry in 2017–18 but revenues from FED did
not increase proportionately.
Table 6: Structure of Federal Excise Duty on cigarettes
Tier/ FED Tier/ FED
Price per thousand sticks Rate Price per thousand sticks Rate
2013–14 2017–18
Tier 1: ≤ Rs 2,286 Rs 880 Tier 1: ≤ Rs 2,950 Rs 800
Tier 2: > Rs 2,286 Rs 2,350 Tier 2: > Rs 2,950 ≤ Rs 4,500 Rs 1,670
Tier 3: > Rs 4,500 Rs 3,740
2014–15 2018–19
Tier 1: ≤ Rs 2,706 Rs 1,085 Tier 1: ≤ Rs 2,950 Rs 848
Tier 2: > Rs 2,706 Rs 2,632 Tier 2: > Rs 2,950 ≤ Rs 4,500 Rs 1,770
Tier 3: > Rs 4,500 Rs 3,964
2015–16 2019–20
Tier 1: ≤ Rs 3,600 Rs 1,420 Tier 1: ≤ Rs 5,960 Rs 1,650
Tier 2: > Rs 3,600 Rs 3,155 Tier 2: > 5,960 Rs 5,200
2016–17 2020–21
Tier 1: ≤ Rs 4,000 Rs 1,536 Tier 1: ≤ Rs 5,960 Rs 1,650
Tier 2: > Rs 4,000 Rs 3,436 Tier 2: > 5,960 Rs 5,200
Source: Federal Board of Revenue (FBR)
12 Economic Implications of Cigarette Taxation in Pakistan: An Exploration through a CGE ModelFigure 2: Production of cigarettes and effective FED rates
59.1 60.7
53.5 1.93 1.92
46.1 1.69
1.48
34.3 1.14
2015-16 2016-17 2017-18 2018-19 2019-20 2015-16 2016-17 2017-18 2018-19 2019-20
A. Production of cigarettes (billion sticks) B. Effective FED rates (Rs per cigarette)
Source: Economic Survey of Pakistan, Government of Pakistan; FBR
To further elaborate on this point, the effective FED rates—the ratio of FED
collection to the number of cigarettes—are presented in Figure 2. It appears
that, despite low production, the effective FED rate in 2016–17 was Rs 1.93
per cigarette. However, due to the three-tier structure, the effective tax rate
declined to Rs 1.14 per cigarette in 2017–18. While the three-tier structure
prevailed in 2018–19, the government raised the statutory FED rates, which
led to an increase in revenues. However, the effective FED rate did not
increase enough to reach the previous level. In 2019, the government
abolished the third tier and restored a two-tier structure with higher rates,
which resulted in a significant increase in the effective FED rate—from Rs
1.5 per cigarette to Rs 1.9 per cigarette. However, it is important to note that
total revenue from FED still remains around Rs 90 billion. Therefore, the
situation calls for adopting a strategy aimed at increasing the effective FED
rate across all tiers.
Cigarette Prices and FED Policy Choice
Cigarette prices in Pakistan are the lowest compared to the other countries
in the region. The price of a 20-cigarette pack of the most-sold brand in
Pakistan was US$ 1.60 in 2018, whereas it was US$ 10.51 in India. Sri Lanka
had even higher prices compared to India and Pakistan (Figure 3).
One of the possible explanations for the relatively low price is the low excise
tax rates in Pakistan, far below the widely-accepted benchmark of 70 percent
of the retail price. For instance, FED is just 41 percent of the final consumer
price of a pack of 20 cigarettes of Capstan—a low-priced brand that falls in
Economic Implications of Cigarette Taxation in Pakistan: An Exploration through a CGE Model 13tier 1 of the FED. On the other hand, the FED on John Player—a high-priced
brand that falls under tier-2—is 57.8 percent of the final consumer price
(Figure 4). Therefore, there is ample room to raise prices in Pakistan by
raising taxes on cigarettes.
Figure 3: Price of a 20-cigarette pack of the most-sold brands in 2018
(international dollars at purchasing power parity)
Sri Lanka, $22.17
India, $10.51
Maldives, $6.78
Nepal, $6.19
Iran, $3.68
Bangladesh, $2.53
Pakistan, $1.60
Afghanistan, $1.50
$- $5.00 $10.00 $15.00 $20.00 $25.00
Source: WHO (2019)
Figure 4: Federal Excise Duty as a percentage of indicative consumer price in Pakistan
100%
80%
57.8%
60%
41.3%
40%
20%
0%
Capstan Gold Leaf
Source: Authors’ estimates based on Indicative Consumer Price
14 Economic Implications of Cigarette Taxation in Pakistan: An Exploration through a CGE ModelEmpirical Strategy for
4
Policy Analysis
CGE modeling was chosen as a research tool for this study since it
encompasses a general equilibrium framework, integrates income and
expenditure multipliers, and is capable of simulating policy choices with
welfare implications for consumers. Even though CGE modeling is a
relatively recent development, a great deal of literature is available on the
subject. For instance, Jangra and Narwal (2014), Feltenstein et al. (2013),
Hosny (2013), and Iqbal and Siddiqui (2001) have surveyed a wide variety
of CGE models and classified them into various categories. Their
classification depends on the methodology used and whether the model is
single-country, regional, or global.
According to these classifications, a stream of literature covers various
distributional aspects of international trade on the economy of developing
countries under several initiatives, including a global trade analysis program
(Jha et al., 2020). Another body of CGE literature focuses on impacts of fiscal
policy, including taxation and public spending, on reducing poverty and
inequality (Jangra and Narwal, 2014). Feltenstein et al. (2013) also provided
a review of micro-simulation and CGE literature that was used for evaluating
the distributional impacts of taxation. In addition, a wide range of literature
covers methodological issues and provides systematic ways to calibrate CGE
models with software support (Raihan, 2015; Decaluwé et al., 2013). The
following subsections present a brief overview of the literature that uses CGE
models for tobacco policy prescriptions, describes the building blocks of the
empirical strategy, and provides a snapshot of CGE model parameters.
CGE Models and Tobacco Tax Policy Analysis
A search of the available literature resulted in only two studies that analyze
the various impacts of a tobacco tax rate increase on welfare based on CGE
models. Ye et al. (2006) evaluated the impact of an increase in cigarette tax
in Taiwan on the overall economy as well as the health benefits. They used a
multisector model to simulate the impact of reduced cigarette consumption
resulting from a new tax scheme and predicted that it would result in a
marked reduction in cigarette consumption along with a notable increase in
health benefits. While the reduction in cigarette consumption would result
in a small decline in GDP, the value of the health benefits would exceed the
GDP loss.
In quantitative terms, their estimates showed a saving of 1.2~2.4 billion New
Taiwan dollars (NT$) (where US$ 1 = NT$ 34.6 at the time of the study)
Economic Implications of Cigarette Taxation in Pakistan: An Exploration through a CGE Model 15annually in life-threatening, cigarette-related health insurance expenses. On
the other hand, a decrease of NT$ 1.3 billion in GDP was projected, largely
due to a reduction in consumption. At the same time, their results showed
that the rise in cigarette prices would also lead to a NT$ 13.1 billion increase
in household welfare. This could be interpreted as an impressive tenfold
counter-effect against the decrease in GDP. The study also highlights the
decrease in tax revenue due to a decline in GDP and concludes that the
increased cigarette tax would be beneficial in terms of both the health of the
general public and the economy.
Jha et al. (2020) analyzed the economic effects of reducing tobacco
consumption in Tanzania based on a multisectoral CGE model. The model
contained comprehensive details on tobacco and tobacco products/sectors
using the Global Trade Analysis Program environment model and database.
The results indicated that a 30-percent reduction in tobacco use would lead
to an employment loss of about 20.8 percent in the tobacco industry and 7.8
percent in the tobacco products sector initially. When compensated for by
increases in other sectors, the overall decline in employment was very
small—0.5 percent. The decline in the economy was negligible at 0.3 percent.
They recommended that some assistance from the government was needed
for the displaced workers from the tobacco sector to compensate for the loss
as a result of the decline in smoking prevalence. However, a limitation of the
study is that the analysis did not net out the economic burden of diseases
caused by tobacco. If such a burden is added, the economic gains from the
reduction in tobacco consumption would be far higher than the sectoral
losses. The results also showed revenue gain from higher taxes to the
government, which can be used to provide financial assistance to displaced
tobacco farmers and workers.
A thorough search of CGE literature did not yield a single study simulating
the economic impacts of higher tobacco taxes in Pakistan. To the best of the
authors’ knowledge, this research is the first study evaluating the economic
impacts of higher tobacco taxes in Pakistan by using a CGE model.
Empirical Strategy: The Building Blocks
This study is primarily based on the methodology used by Decaluwé et al.
(2013). There are two reasons for adopting this methodology. First, under
the Modeling and Policy Impact Analysis (MPIA) program, they assisted
developing country researchers in constructing models of their national
economies, including Pakistan’s, to simulate the impact of macroeconomic
shocks and policies on various dimensions of poverty and welfare. The
approach works well for tax analysis in developing countries, including
Pakistan. Second, the open-access user guide and other supporting materials
are readily available.
16 Economic Implications of Cigarette Taxation in Pakistan: An Exploration through a CGE ModelDecaluwé et al. (2013) offer a variety of CGE models including static and
dynamic, single country and multi-country, and others. Given the research
objectives, a static single-country CGE model was deemed appropriate to
simulate the economic and distributional impacts of an increase in tobacco
tax rates in Pakistan.
The following five-step methodology was used for the analysis:
1. Aggregate production sectors and commodities.
2. Build a benchmark equilibrium data set – the structure of SAM.
3. Set the basic behavior of institutions and choose a functional form;
specify extraneous elasticity values and determine parameter values
through calibration.
4. Ensure equilibrium verifying Walras’ Law.
5. Conduct policy simulation.
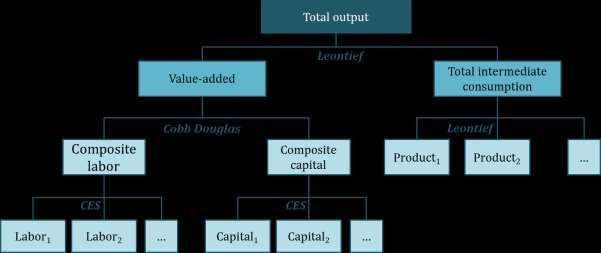
Aggregate Production Sectors and Commodities
As defined by Decaluwé et al. (2013) and Raihan (2015), the CGE model is
based on a representative firm in each industry that maximizes profits
subject to its production technology. The sectoral output follows a Leontief
production function. Each industry’s value added consists of composite labor
and composite capital, following a constant elasticity of substitution (CES)
specification. Different categories of labor follow a CES technology with
imperfect substitutability between different types of labor. Composite
capital is a CES combination of different categories of capital. It is assumed
that intermediate inputs are perfectly complementary; they are combined
following a Leontief production function (Figure 5).
An economy-wide input-output (I-O) table contains the values of composite
labor, capital, intermediate inputs and value added, and total output that
serves as a base for SAM. In the case of Pakistan, two I-O tables are available;
both are calibrated for the year 2010–11. The officially constructed I-O table
contains 82 sectors of the economy and has been used for tax incidence
analysis by the Federal Board of Revenue (FBR). On the other hand, the
Pakistan Institute of Development Economics (PIDE) has developed an
updated I-O table that is based on the System of National Accounts (SNA)
2008 and contains 42 sectors (Zeeshan & Nasir, 2019).
A comparison of the two I-O tables indicates vast differences in terms of labor
and capital productivity due to methodological choices. PIDE’s I-O table is an
industry-by-industry table that does not contain products due to
aggregation. For instance, the entire agriculture sector is grouped into only
three industries, namely Crop and Animal Production, Hunting, and Related
Economic Implications of Cigarette Taxation in Pakistan: An Exploration through a CGE Model 17Service Activities; Forestry and Logging; and Fishing and Aquaculture. Since
it does not contain tobacco crop separately, it is less useful for this research
where distributional impacts on raw tobacco producers are an integral part
of the analytical framework.
Therefore, an attempt was made for this research to construct a product-by-
product I-O table to decompose the agriculture sector by using the Supply
and Use tables for Pakistan developed by the Asian Development Bank
(ADB).9 The resulting I-O table contains 54 by 54 products with 19 categories
for agriculture. However, it was found that tobacco growing is integrated into
Forage Products, Fibres, Living Plants, Cut Flowers and Flower Buds,
Unmanufactured Tobacco, and Natural Rubber. Further decomposition of
this category required various assumptions in the absence of disaggregated
data. Therefore, the FBR’s I-O table (2010–11) was considered more
appropriate for this study as it contains interlinkages of tobacco crop and
tobacco manufacturing with other sectors. For the CGE model, the I-O table
is calibrated for 2018–19.
Figure 5: Production and intermediate consumption
Source: (Decaluwé et al., 2013)
After the selection of the I-O table, the sectors are mapped into the desired
number of aggregate commodities and sectors. The sectors and commodities
of the I-O table are reduced to 13 sectors and commodities. In line with the
scope of the research, the mapped sectors and commodities of the I-O table
are linked with the major household consumption categories found in the
Household Integrated Economic Survey (HIES) 2018–19. These categories
include food, raw tobacco, cigarettes, household durables, clothing, energy,
9 https://data.adb.org/dataset/supply-and-use-tables-pakistan
18 Economic Implications of Cigarette Taxation in Pakistan: An Exploration through a CGE Modelhousing, transport, public administration, education, health, leisure, and
others. Table 7 shows the result of the mapping exercise that sets a
foundation for SAM and CGE. These categories are also consistent with a
recent SPDC study on the impact of tobacco use on household consumption
patterns in Pakistan (Saleem & Iqbal, 2020). The basic objective of mapping
is to include as many sectors as possible to cover all related final
consumption categories and help in computing the impacts of change in
tobacco consumption on consumption categories.
Table 7: Mapping of 81 sectors input-output (I-O) matrix in 13 sectors
Mapped Sectors Description
Rice, wheat, pulses, potatoes, vegetables & condiments, fruits, livestock & slaughter products,
Food fisheries, vegetable oils etc, milled grains, bakery products, sugar, beverages, hotels &
restaurants, sugar cane, oil seeds, and other food
Tobacco Raw and manufactured (cigarettes) tobacco
Cotton, ginned cotton, cotton yarn, cotton cloth, art silk, made-up textile goods, knitwear,
Clothing
carpets, garments, other textile products, leather & leather products, and footwear
Health Health care, and pharmaceutical products
Education Education, and Paper & Printing
Railway, road transportation, water transportation, air transportation, other transportation &
Transportation
storage, and transport equipment
Energy and Utilities Coal, crude oil, natural gas, electricity, gas supply, refined petroleum and water works & supply
Public Administration Public administration & defence
Bricks, cement, other non-metallic mineral products, construction & land improvement,
Housing
ownership of dwellings, and real estate services
Forestry, wood and wood products, furniture, electrical equipment, handicrafts, jewelry, and
Household Commodities
precious metals
Recreation Social & cultural services, and personal & household services
Fertilizers & pesticides, chemical consumer products, rubber & plastic products, other
chemicals, basic metal products, metal products, non-electrical machinery, surgical
Others instruments, other manufacturing prods, business services, central monetary authority,
scheduled & coop banks, other credit institutions, insurance, wholesale trade, retail trade, and
other
Source: Authors’ mapping in accordance with the major household consumption categories of HIES 2018-19
Construction of SAM
The CGE model is based on a social accounting matrix (SAM) of the economy.
A SAM is a square matrix that provides a snapshot of the economy for a given
year. In the case of Pakistan, the latest SAM was developed by Debowicz et
al. (2012) for the fiscal year 2007–08. However, their SAM did not contain
tobacco crop and cigarette manufacturing separately. Therefore, a SAM was
constructed by using national accounts, input-output tables, family income
and expenditures, trade and balance of payments, value-added data (capital
income by industry and labor income by industry), and other government
data sources.
Economic Implications of Cigarette Taxation in Pakistan: An Exploration through a CGE Model 19The SAM constructed for this study consists of four types of institutions or
agents: households, firms, government, and the rest of the world. Given the
scope of this research, the SAM is limited to analyze tobacco tax policy
simulations; hence, the rest of the world is dropped from the analysis. The
remaining agents are further divided into appropriate groups. The factors of
production are divided into labor and capital, while the land is grouped with
capital. Similarly, households are divided into two broad categories: urban
and rural. Other institutions include government, corporation, and capital
(Table 8).
Table 8: Description of Pakistan SAM accounts
Set Description of Elements
Sectors/Activity (13) basic food, raw tobacco, cigarettes, household durables,
clothing, energy, housing, transport, public account,
education, health, leisure and others
Commodity (13) basic food, raw tobacco, cigarettes, household durables,
clothing, energy, housing, transport, public account,
education, health, leisure and others
Factors of Production (2) Labor and capital
Households (2) Rural and urban
Other Institutions (3) Government, corporation; and capital
Structure of the CGE Model
The CGE model contains the production block, income and saving block,
demand-side utility functions, price structure, equilibrium conditions, and a
set of exogenous variables.
Production block
The production block consists of a two-level nested production structure in
all 13 sectors. At the first level, a Leontief fixed-proportion production
function between value-added and intermediate consumption is assumed.
This implies that there are no substitution possibilities between
intermediate consumption and value added. On the intermediate
consumption side, the Leontief production function between different inputs
is assumed. At the second level, the assumption is that substitution is
possible between labor and capital on the value-added side. To capture the
substitution possibilities, a Cobb–Douglas production function is used in
each sector, which implies that the budget share of each factor of production
is fixed in the short run. A fixed wage rate for labor and fixed capital in all
sectors is also assumed, which implies that input market is perfectly
competitive and the factors of production are perfectly mobile in all sectors.
20 Economic Implications of Cigarette Taxation in Pakistan: An Exploration through a CGE ModelIncome and savings block
As defined in the SAM, the income and savings block consists of the income
of households, corporations, and government. Household income comes
from three possible sources: labor income, capital income, and transfers
received from other agents. HIES (2018–19) data are used to compute the
share of labor income of rural and urban households. The same data set is
used to compute dividends to rural and urban households. However, it turns
out that only urban households received income from firms in the form of
dividends in 2018–19. It is also assumed that dividends are exogenous to the
model. To compute the share of household income from capital and savings
of corporations, the share of capital income in the total income of households
is applied. Apart from these incomes, households also receive income from
the government in the form of fiscal transfers. The difference between
household disposable income and the consumption budget constitutes
household savings.
Corporate income consists of its share of capital income. It is assumed that
firms receive a fixed share of capital income after the payment of dividends
and corporate income tax. This income is not distributed to households and
is entirely dedicated to firms’ savings.
The government draws its income from household and corporate income
taxes, taxes on products, and other taxes on production. These taxes can be
divided into direct taxes and indirect taxes; the latter are further divided into
GST and FED, which are collected on the sales of tradable commodities. It is
assumed that public administration is not a tradeable commodity. It is also
assumed that firms and households pay a fixed share of their income as
income tax. Finally, government savings are the difference between
government income and government expenditures.
Demand side
The demand for goods and services consists of household consumption
demand, investment demand, and demand by the government. The Cobb–
Douglas utility function is assumed to drive households’ final consumption
demand, which implies that households allocate a constant share of their
budget to each commodity. Similar behavior of households regarding the
final demand for investment purposes is also assumed. Intermediate
demand is the sum of demand from each industry derived from the I-O table.
Prices
The value-added price is the weighted sum of the cost of labor and capital.
Total production cost is the weighted sum of value-added price and price of
intermediate consumption. Producer prices and purchaser prices are
denoted by PO and PD, while the difference between these two divided by PD
Economic Implications of Cigarette Taxation in Pakistan: An Exploration through a CGE Model 21You can also read