Creating value by fulfilling our purpose Advancing the World of Health - August 5, 2021 - Investors
←
→
Page content transcription
If your browser does not render page correctly, please read the page content below

Creating value by fulfilling our purpose
Advancing the World of Health™
August 5, 2021
Caution Concerning Forward-Looking Statements
    This presentation contains certain estimates and other forward-looking statements (as defined under Federal securities laws) regarding BD’s future prospects and performance, including, but not limited to,
    future revenues, margins, earnings per share, leverage targets, capital deployment, total return targets, and the proposed spinoff of the diabetes business, including strategies of BD and the independent
    company following the proposed spinoff, the anticipated benefits of the spinoff, and the expected timing of completion of the spinoff. All such statements are based upon current expectations of BD and
    involve a number of business risks and uncertainties. Actual results could vary materially from anticipated results described, implied or projected in any forward-looking statement. With respect to forward-
    looking statements contained herein, a number of factors could cause actual results to vary materially. These factors include, but are not limited to, risks relating to the impact of the COVID-19 pandemic on
    our business (including decreases in the demand for our products, any disruptions to our operations and our supply chain, and factors such as vaccine availability and utilization and increased competition that
    could impact the demand and pricing for our COVID-19 diagnostics testing); product efficacy or safety concerns resulting in product recalls or actions being taken with respect to our products; new or changing
    laws and regulations impacting our business (including the imposition of tariffs or changes in laws impacting international trade) or changes in enforcement practices with respect to such laws; fluctuations in
    costs and availability of raw materials, labor shortages or increased labor costs and BD’s ability to maintain favorable supplier arrangements and relationships; legislative or regulatory changes to the U.S. or
    foreign healthcare systems, potential cuts in governmental healthcare spending (including China’s volume-based procurement tender process), or governmental or private measures to contain healthcare costs,
    including changes in pricing and reimbursement policies, each of which could result in reduced demand for our products or downward pricing pressure; changes in interest or foreign currency exchange rates;
    adverse changes in regional, national or foreign economic conditions, including inflation, deflation and fluctuations in interest rates, particularly in emerging markets, including any impact on our ability to
    access credit markets and finance our operations; the demand for our products and services, or our suppliers' ability to provide products needed for our operations; the adverse impact of cyber-attacks on our
    information systems or products; competitive factors including technological advances and new products introduced by competitors; risks related to our overall indebtedness; interruptions in our supply chain,
    manufacturing or sterilization processes; pricing and market pressures; difficulties inherent in product development, delays in product introductions and uncertainty of market acceptance of new products;
    adverse changes in geopolitical conditions; increases in energy costs and their effect on, among other things, the cost of producing BD’s products; the remediation of our infusion pump business (including risks
    relating to our ability to obtain regulatory clearance and market acceptance of the BD Alaris™ System); our ability to achieve our projected level or mix of product sales; our ability to successfully integrate any
    businesses we acquire; uncertainties of litigation and/or investigations and/or subpoenas (as described in BD’s filings with the Securities and Exchange Commission); issuance of new or revised accounting
    standards; risks associated with the impact, timing or terms of the spinoff; risks associated with the expected benefits and costs of the spinoff, including the risk that the expected benefits of the spinoff will not
    be realized within the expected time frame, in full or at all, and the risk that conditions to the spinoff will not be satisfied and/or that the spinoff will not be completed within the expected time frame, on the
    expected terms or at all; the expected qualification of the spinoff as a tax-free transaction for U.S. federal income tax purposes, including whether or not an IRS ruling will be sought or obtained; the risk that
    any consents or approvals required in connection with the spinoff will not be received or obtained within the expected time frame, on the expected terms or at all; risks associated with expected financing
    transactions undertaken in connection with the spinoff and risks associated with indebtedness incurred in connection with the spinoff; the risk that dis-synergy costs, costs of restructuring transactions and
    other costs incurred in connection with the spinoff will exceed our estimates; and the impact of the spinoff on our businesses and the risk that the spinoff may be more difficult, time-consuming or costly than
    expected, including the impact on our resources, systems, procedures and controls, diversion of management’s attention and the impact on relationships with customers, suppliers, employees and other
    business counterparties, as well as other factors discussed in BD’s filings with the Securities and Exchange Commission. There can be no assurance that BD’s spinoff will in fact be completed in the manner
    described or at all. In addition, we have made certain assumptions in making these forward-looking statements, particularly regarding the impact of the COVID-19 pandemic on BD and its results of operations
    and financial conditions. If any of these assumptions, including the impact of the COVID-19 pandemic are incorrect, BD's actual results could differ materially from those described in these forward-looking
    statements. We do not intend to update any forward-looking statements to reflect events or circumstances after the date hereof except as required by applicable laws or regulations.

    The guidance in this presentation is only effective as of the date given, August 5, 2021, and will not be updated or affirmed unless and until we publicly announce updated
    or affirmed guidance.
2
Caution Concerning Non-GAAP Financial Measures
    These non-GAAP financial measures are not in accordance with generally accepted accounting principles in the United States. BD management believes that the
    use of non-GAAP measures to adjust for items that are considered by management to be outside of BD’s underlying operational results or that affect period to
    period comparability helps investors to gain a better understanding of our performance year-over-year, to analyze underlying trends in our businesses, to analyze
    our base operating results, and understand future prospects. Management uses these non-GAAP financial measures to measure and forecast the company’s
    performance, especially when comparing such results to previous periods or forecasts. We believe presenting such adjusted metrics provides investors with greater
    transparency to the information used by BD management for its operational decision-making and for comparison for other companies within the medical
    technology industry. Although BD’s management believes non-GAAP results are useful in evaluating the performance of its business, its reliance on these measures
    is limited since items excluded from such measures may have a material impact on BD’s net income, earnings per share or cash flows calculated in accordance
    with GAAP. Therefore, management typically uses non-GAAP results in conjunction with GAAP results to address these limitations. BD strongly encourages
    investors to review its consolidated financial statements and publicly filed reports in their entirety and cautions investors that the non-GAAP measures used by BD
    may differ from similar measures used by other companies, even when similar terms are used to identify such measures. Non-GAAP measures should not be
    considered replacements for, and should be read together with, the most comparable GAAP financial measures.
    Reconciliations of these and other non-GAAP measures to the comparable GAAP measures are included in the attached financial tables. Within the attached
    financial tables presented, certain columns and rows may not add due to the use of rounded numbers. Percentages and earnings per share amounts presented are
    calculated from the underlying amounts. Current and prior-year adjusted diluted earnings per share results exclude, among other things, the impact of purchase
    accounting adjustments, integration and restructuring costs, spin-off related charges, certain transaction gains, certain legal defense and product remediation
    costs, certain regulatory costs, certain asset impairments, the impact of the extinguishment of debt and the dilutive impact of shares issued in May 2020.
    We also provide these measures, as well as revenues, on a currency-neutral basis after eliminating the effect of foreign currency translation, where applicable. We
    calculate foreign currency-neutral percentages by converting our current-period local currency financial results using the prior period foreign currency exchange
    rates and comparing these adjusted amounts to our current-period results. Reconciliations of these amounts to the most directly comparable GAAP measures are
    included in the tables at the end of this presentation and in our August 5, 2021, earnings press release.

3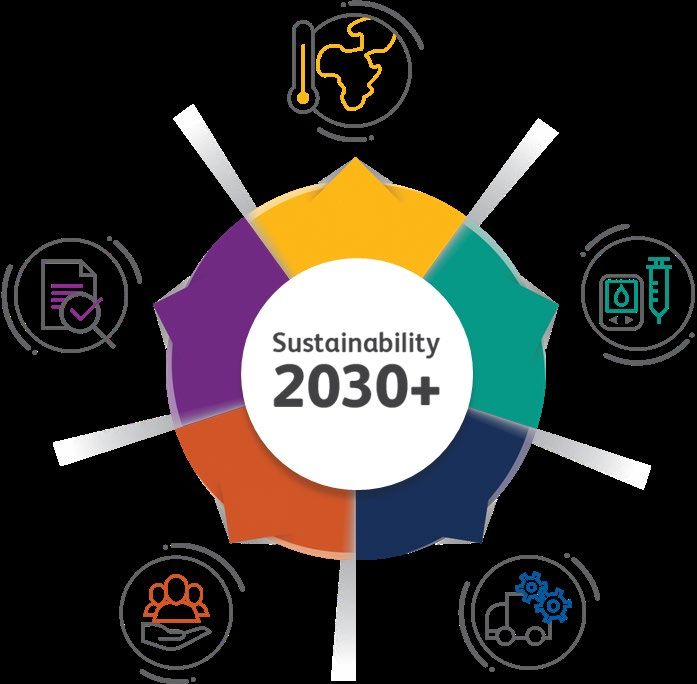
Basis of Presentation
    All dollar amounts presented are USD ($) in millions, unless otherwise indicated, except per share figures.
    Certain financial information, described as FXN (defined below), excludes the impact of foreign currency translation.
    Revenue year-over-year change comparisons are on a FXN basis unless otherwise noted.
    Base business margins adjusts for the net impact of estimated COVID-19 diagnostic testing profitability and the related profit reinvestments back into our business.
    Base revenue denotes total revenues less estimated revenues for COVID-19 diagnostic testing
    Business Unit Acronyms

        BDB       Biosciences                                PI        Peripheral Intervention

        DC        Diabetes Care                              PS        Pharmaceutical Systems

        IDS       Integrated Diagnostics Solutions           SURG      Surgery

        MDS       Medication Delivery Solutions              UCC       Urology & Critical Care
        MMS       Medication Management Solutions

    COVID diagnostic testing includes our BD Veritor™ and BD Max ™ COVID assays as well as estimated collection, transport, and swab related to COVID.
    FXN denotes currency neutral basis. We calculate foreign currency-neutral percentages by converting our current-period local currency financial results using the prior
    period foreign currency exchange rates and comparing these adjusted amounts to our current-period results.
    NewCo refers to the diabetes care business unit on a pro forma basis as an independent publicly traded company.
    RemainCo refers to BD on a pro forma basis post the separation of the diabetes care business.
    Total return adjusted EPS growth plus dividend yield.

4
BD is an innovative medtech leader with the global reach and scale to
    address healthcare’s most pressing challenges

       Revenues by segment                                                                                                                        Revenues by region
                                                                                          70,000 +
                                                                                           BD associates

                    SURG
              UCC
               7%
                     6%          MDS                                                          190 +                                                        Europe
                                                                                                                                                                                     China
                                 21%                                                     countries served
         PI
         9%
                                                                                                                                                            20%
                                                                                                                                         57%                                         6%
       BDB
       7%
                    $17.1               MMS                                                   40B +
                       billion          14%                                          devices made annually                          United States                       17%
              IDS                  PS                                                                                                                                Rest of World
              21%           DC
                            6%
                                   9%
                                                                                              $1B +
                                                                                      annual R&D spending

             #1 in nearly all                                                                                                                     43% International Revenue
         major served categories                                                          27,000 +                                                14% Emerging Markets
                                                                                          active patents

5   Note: BD financial information presented is for fiscal 2020. Market share information and rank based on internal estimates and publicly available information.
Tom Polen
Chairman, CEO, and President

Executive Summary
       Our base business recovery and BD 2025 strategy execution is driving performance
              • Total 3Q FY21 revenues increased 26.9% reported and 22.0% FXN.
              • Base business revenue momentum continues with base revenues up 17.6% FXN.
              • Raising our guidance for FY21 base business revenue and overall adjusted EPS despite weaker COVID-
                19 testing profitability.
       We are advancing a more balanced capital allocation strategy
              • Year-to-date, we increased our operating cash flows 80% to $3.7 billion on a year-over-year basis
                allowing us to:
                       –     Completed 7 tuck-in acquisitions which will strengthen our growth profile.
                       –     Returned $1.8 billion to shareholders vis-à-vis dividends and $1 billion in share repurchases.
       We see an exciting roadmap ahead of shareholder value creation
              • Investor Day on November 12: We will take a deep dive on our BD 2025 strategy showcasing our
                growth and innovation pipeline, our simplification and empower initiatives.
              • 1H calendar 2022 targeted for spin* of our Diabetes Care business to equity shareholders.

       We are confident in our ability to drive durable mid-single digit revenue and double-digit total return in our
       base business over the long-term.
  *The intended spinoff of the diabetes care business is subject to market, regulatory and other conditions, including final approval by the BD Board of Directors and
  the effectiveness of a Form 10 registration statement that will be filed with the SEC.
7 Please see Appendix for non-GAAP reconciliations
Our business units have made steady progress recovering to
     pre-pandemic levels
                                                                                                      Q3 FY21 Revenue Highlights
                                                                                     (All % change rates are on a FXN year-over-year basis unless noted)
                    Q3 FY21 Revenues $4.9 Billion
                   up 26.9% reported, up 22.0% FXN y/y basis                       BD Medical up 7.7%
                     up 17.6% excluding COVID-19 testing
                                                                                             •    Recovery in Medication Delivery Solutions (MDS, up 23.9%) driven
                                                                                                  by strong demand for core offerings as hospital utilization
                                                                                                  improves year-over-year as COVID anniversaries in most markets.
                                                                                             •    Continued strong revenue growth in Pharmaceutical Systems’ pre-
                                                                                                  filled devices (up 11.9%).
                                                 COVID impact
                                                                                   BD Life Sciences up 43.4% (up 26.8% ex-COVID-19 testing)
                                                                                              •   Integrated Diagnostic Solutions (up 48.7%) driven by testing
                                                                                                  recovery in most categories plus COVID testing.
                                                                                              •   Strong Bioscience growth (up 27.3%) driven by recovery in
                                                                                                  research and clinical activity year-over-year.
                                                      COVID-19, Alaris
                                                   recalls/distribution hold       BD Interventional up 34.6%
                                                                                             •    Strong growth in Surgery (up 67.7%) and Peripheral Intervention
        Q1   Q2   Q3   Q4   Q1   Q2   Q3   Q4   Q1   Q2   Q3
                                                                                                  (up 31.8%) driven by recovery in elective procedures and COVID
       FY19 FY19 FY19 FY19 FY20 FY20 FY20 FY20 FY21 FY21 FY21
                                                                                                  anniversary.
Quarter Dec March June Sept          Dec March June Sept          Dec March June             •    Urology and Critical Care revenues (up 13.5%) driven by utilization
 ended
               Base Revenues               COVID-19 Diagnostic Testing                            recovery and PureWick™.

8    Please see Appendix for non-GAAP reconciliations
Our Q3 FY21 revenues are higher relative to our pre-pandemic levels
                                                                     Q3 FY21 Revenues                   Q3 FY21 vs Q3 FY19
     Segment / Business Unit                                           ($ in millions)                    FXN % change
                                                                                                                +3.9%
     Total Revenues, ex-COVID-19 Diagnostic testing                       $4,590             (270bp impact from US MMS infusion systems;
                                                                                         +6.6% excluding impact from MMS US infusion systems)

     BD Medical                                                           $2,375                                +1.2%
         Medication Delivery Solutions (MDS)                              $1,007                                +1.9%
                                                                                                               (10.9%)
         Medication Management Solutions (MMS)                             $597                (1,790 bp impact from US infusion systems;
                                                                                           +7.0% excluding impact from US infusion systems )

         Diabetes Care (DC)                                                $294                                 +5.8%
         Pharmaceutical Systems (PS)                                       $476                                +16.9%
     BD Life Sciences, excluding COVID-19 Diagnostic testing              $1,133                                +5.2%
         Integrated Diagnostic Solutions (IDS), excluding COVID Dx         $817                                 +4.0%
         Biosciences (BDB)                                                 $316                                 +8.5%
     BD Interventional                                                    $1,082                                +8.7%
         Surgery (SURG)                                                    $336                                 +7.7%
         Peripheral Intervention (PI)                                      $436                                 +7.7%
         Urology and Critical Care (UCC)                                   $310                                +11.2%

9   Please see Appendix for non-GAAP reconciliations
We have launched a series of innovative products and solutions that
strengthen our durable core business
BD Medical
BD Cathena™ IV Safety BD PhaSeal™ Optima BD Hylok™ BD HealthSight™
BD Securis™ BD Pyxis™ Inventory BD NeXus BD BodyGuard™
Catheter with BD Locking Injector for IV BD Pyxis™ ES 1.7 Infusion Diversion,
Stabilization Device Connect 1.0 (MedCaptain) DUO Barcode
Multiguard™ Technology N40-O MedSafety
BD Life Sciences
BD BD BD COR™
BD MAX™ BD Veritor™ BD Veritor™ BD Kiestra™ BD MAX™
BD FACSymphony™ FACSymphony™ BD Veritor™ System with
FLU + COVID-19 Connectivity FLU + COVID-19 ReadA CTGCTV2
FACSDuet™ (US) A1 A5.2 SE At-Home Onclarity™ (US)
Assay Module POC Antigen Test Compact Assay
BD Interventional
Proxis™ Global Intermittent Sensica™ Automated
PeritX™ Pristine™ SureStep™ 1.1 Glidepath™ Retro Glidepath™ LE Crosser™ IQ
11/13 Self Cath - Economy Urine Output
Note: Not all products are available in all countries/regions. Denotes product has received relevant regulatory
Products that appear on this page are in development unless otherwise noted clearance/approval and/or commercially launched
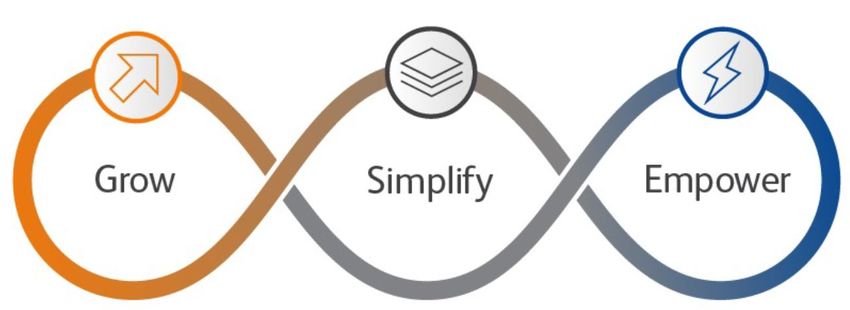
10We are executing on our value-creating BD 2025 strategy
Through our BD 2025 strategic pillars of
Grow, Simplify, and Empower, we aim to
drive sustainable and durable growth and
create value for all stakeholders while
Advancing the World of Health™.
• We are clear category leaders in many large, foundational areas of healthcare; with our global reach and scale, we can
address healthcare’s most pressing challenges.
• Advancing meaningful innovations across three key innovation themes—better outcomes through smart devices, enabling
alternative care settings, and improved diagnosis and treatment of chronic diseases—designed to enhance our durable base
business growth and add new growth drivers.
• We constantly seek to optimize and enhance our portfolio through purposeful R&D spending and strategic tuck-in
acquisitions in higher growth categories, more efficient go-to-market initiatives and improved business and operational
processes to strengthen our revenue and profit outlook while improving product quality and reducing regulatory, compliance,
and legal risks.
• We are investing in our human capital, advancing our culture of inclusion, diversity, equality, and growth mindset as well as
empowering BD associates globally to drive our long-term organizational success.
• ESG is an integral part of our long-term strategy, and we are advancing our 2030+ sustainability initiatives across our
organization.
11We are leveraging BD’s core strengths and focusing our innovation pipeline on
innovation themes that provide for long-term durable growth
BD Innovation Theme Growth area BD product/solution Category growth*
Microbiology lab automation, informatics BD Kiestra™, BD Synapsys™ Double-digits
Improving care
Integrated medication management software
processes through BD HealthSight™, Pyxis™ IV Prep, Logistics Double-digits
solutions
applying smart devices,
robotics & analytics/AI FACS™ instruments, Horizon Reagents,
Integrated flow cytometry research solutions High-single digits
FlowJo software
Point of care blood collection BD Accustat, YODA platform High-teens
Enabling alternative Point of care diagnostics BD Veritor™, POC Molecular Double-digits
care settings Self-administered drug delivery BD Intevia™, BD Vystra™, BD Libertas™ Double-digits
Non-acute medication dispensing BD ROWA™, MedBank platform Mid-teens
BD Purewick™ Urine Collection System &
Urological female incontinence Double-digits
Catheter
Better diagnosis and/or Peripheral vascular disease BD Rotarex™/Aspirex™, Venous Solutions High-single digits
treatment of chronic Endovascular AV fistula BD WaveLinQ™ Double-digits
disease
Advanced repair/reconstruction Hiatal, Incisional Reinforcement High-single digits
Molecular diagnostics BD Onclarity™ HPV Genotyping Assay Double-digits
Increased investment in FY21+ including our BD Growth & Innovation Fund
Note: Not all products are available in all countries/regions.
12 *Category growth represents management’s estimated underlying revenue growth rate, excluding the impact of COVID-19 and foreign currency rates, for the next 3 years.Our solutions across our segments and across the continuum of care provide better
outcomes for all stakeholders
Improve care processes through Improve diagnosis and/or
applying smart devices, Enabling non-acute care settings
treatment of chronic diseases
robotics & analytics/AI
Launched Q3 FY21; Controlled drug storage, Subcutaneous drug
automated urine output prescription filling, and delivery system for
monitoring leveraging retrieval system offering administration of biologics
our leading U.S. acute for retail, outpatient
Sensica™ care foley market share pharmacy settings
IntelliVault BD Libertas™*
Kiestra offers total lab Expanding access of our Extended genotyping
automation; SusceptA* COVID-19 diagnostic supports risk stratification
offers automated testing to more patients and persistence
process for antimicrobial in the home setting monitoring to guide
susceptibility testing BD Onclarity™ patient management1-5
BD Kiestra BD Veritor™
At-Home* HPV Assay
Cloud based AI technology Vacuum-assisted female Long-term hemodialysis
connects BD medication external catheter for catheter with a unique
management products to urinary incontinence; design
address diversion of expansion into LTC and
controlled substances PureWick™ Urine
homecare settings
BD HealthSightTM Pristine™
Diversion Management Collection System
*These products are in development and have not received regulatory clearance. 1. Stoler MH et al. Gynecol Oncol. 2019;153(1):26–33; 2. Bonde J et al. Int J Cancer. 2019; doi:10.1002/ijc.32291; 3. Elfgren K et al. Am J Obstet Gynecol. 2017;216(3):264.e1–264.e7.;
13 4. Radley D et al. Hum Vaccin Immunother. 2016;12(3):768–772.; 5. Bottari F et al. J Low Genit Tract Dis. 2019;23(1):39–42.Our tuck-in M&A strategy further strengthens our pipeline with innovative
solutions that advance better outcomes
# of tuck-ins per year A leader in RFID
Innovative health care
pharmacy
automation and cloud- A drug/device
0 6 7 technology solution
3 based business combination product
for tracking and
intelligent solutions for provider of testing services
FY18 FY19 FY20 YTD FY21 storing prescriptions;
non-acute medication for biopharmaceutical
served market
management; served companies; served market
growth rate
market growth rate growth rate double-digits
double-digits
mid-teens
Pristine™ BD Surgiphor™
Long-Term Sterile Wound
Hemodialysis Catheter Irrigation System
Sensica UO, Unique Y-Tip™ The first and only ready-to- Innovative, needle-free A leading developer and
Atherectomy and
automated urine Distal Lumen Design use aqueous povidone-iodine technology that enables high- manufacturer of a proprietary
thrombectomy;
output monitoring; offers innovation; (PVP-I) irrigation solution that quality blood draws from resorbable polymer technology;
served market
new market served market growth mechanically loosens and existing peripheral intravenous near-term opportunity for
growth rate
opportunity rate mid-single digits removes wound debris; new catheter (PIVC) lines; new vertical integration strategy for
double-digits
market opportunity market opportunity our Phasix™ resorbable hernia
mesh and long-term opportunity
to expand the technology into
other potential applications
14
Straub, Adaptec, and Pristine were acquired in FY20; all other transactions closed in FY21We are advancing our planned Diabetes Care spinoff, which we expect to
create value for our shareholders over the long-term
MMS
14%
PS Announced three future directors for the Diabetes Care spinoff
9% BD management
MDS
21%
DC expects the spinoff to:
6%
BD FY20
SURG Revenues
IDS • Strengthen the growth
6%
UCC 21% profile of BD and
7% PI NewCo.
BDB
9% 7%
• Enable BD and NewCo Chris Reidy
Lieutenant General (Ret.) Claire Pomeroy, MD, MBA
Diabetes Care to sharpen focus on Director
David F. Melcher Director
category innovation and
FY20 revenues: ~ $1.1 billion Non-executive Chairman
customer outcomes.
of the Board of Directors
Global leader in insulin
injection devices • Allow BD and NewCo to
have more efficient
Serving an estimated 30 business processes,
million patients worldwide allocation of resources NewCo Form 10 filing to be publicly available around the
and capital. end of the calendar year.
• Position BD and NewCo The Diabetes Care spinoff is on track to be completed in
for greater success and the first half of calendar year 2022.
value creation.
Notes: Market position and estimated number of patients are BD internal estimates.
The intended spinoff of the diabetes business is subject to market, regulatory and other conditions, including final approval by the BD Board of Directors and the effectiveness of a Form 10
15 registration statement that will be filed with the SEC.Diabetes spin off transaction summary
• Spinoff expected to be implemented by means of a distribution of 100% of the shares of a new publicly traded
Transaction details entity to BD stockholders and is intended to be tax-free for U.S. federal income tax purposes
• BD expects to receive a cash distribution from NewCo upon transaction closing
• Enable BD and NewCo to sharpen focus on their respective category innovation and customer outcomes
Strategic rationale • Allows NewCo to attract and retain talent, focus on its strategic growth goals and more efficiently allocate capital
• BD to focus on its priority businesses and continue to execute on its BD 2025 strategy
• Dev Kurdikar, current Worldwide President of BD Diabetes Care, to be CEO of NewCo
Leadership &
governance • Jake Elguicze, former Treasurer and VP of IR of Teleflex, will be CFO of NewCo
• David Melcher will be non-executive Chair of the Board of Directors; Claire Pomeroy and Chris Reidy will be Directors
• Spinoff provides further confidence in mid-single digit revenue and double-digit total return growth profile
BD
• BD current dividend is not expected to be affected; BD remains committed to its investment grade credit ratings
Financial
details
• BD Diabetes revenue base in FY2020 was nearly $1.1 billion; cash flow positive
NewCo
• NewCo capital structure is expected to provide M&A flexibility for sustained organic and inorganic investment
• Transaction is expected to be completed in the first half of calendar year 2022, subject to market, regulatory, and
Timing and closing other conditions, including final approval by BD Board of Directors and the effectiveness of a Form 10 registration
conditions statement that will be filed with the SEC
16We are building on our ESG leadership with our 2030+ sustainability strategy
Our 2030+ sustainability strategy has five impact areas:
Climate Change
Our ambitions: Minimize our contribution to global emissions and utilize our capabilities to address unmet health needs for climate
vulnerable populations.
Our commitments: We will set carbon reduction targets aligned with climate science and aim to be carbon neutral across our direct
operations by 2040. We will also use our capabilities to contribute to solutions that address climate related health challenges.
Product impacts
Our ambitions: Reduce the environmental impact of our portfolio and address the sustainability needs of our customers.
Our commitments: We will work with partners to reduce impacts of our products and packaging, with a focus on plastic, across the
value chain and apply minimum environmental and human health criteria to new products and product changes to ensure
meaningful and sustainable product improvements across the lifecycle.
Our 2030+ sustainability Supply chain resilience
strategy addresses a range of Our ambitions: Create a supply chain adaptable to disruption and able to contribute to strong environmental and social
challenges in our industry while performance.
helping to make a difference Our commitments: We will create a responsible supply chain resilient to disruptions, by strengthening engagement with supply chain
partners around sustainability expectations, practice and performance and incorporating sustainability into our supply chain
on relevant issues that affect
decisions.
society and the planet.
Our strategy will ensure we
Healthy workforce and communities
Our ambitions: Maintain a healthy and thriving workforce that cultivates our culture of inclusion, safety, well-being and contributes to
remain focused on shared community health.
value creation—meaning how Our commitments: We will provide tools and resources to empower our workforce in managing their physical, mental and financial
we address unmet societal health; improve our culture of inclusion, safety and wellbeing, and contribute to the global community.
needs through business models
and initiatives that also
contribute to the commercial Transparency
success of BD. Our ambitions: Invite trust across stakeholder groups through transparent performance reporting on environmental, social and
governance issues relevant to our business.
Our commitments: We will provide our stakeholders with meaningful information about our business by regularly disclosing clear
information about our sustainability performance and programs, aligning with relevant and recognized external sustainability
17 reporting frameworks.We are proud of our recent ESG accomplishments and ongoing efforts to
advance our 2030+ sustainability initiatives
BD was named a 2021 DiversityInc Noteworthy
We began power generation via solar Company for the second consecutive year, in
panel installation at BDs Cayey, Puerto recognition of hiring, retaining and promoting
Rico facility. The project will reduce women, minorities, people with disabilities,
carbon emissions by 900 tonnes CO2-e LGBTQ+ and veterans.
per year and supports our commitment
to increasing use of renewable energy.
BD was named a Place to Work for Disability
Inclusion for the third year in a row, earning a
score of 90 on the Disability Equality Index®
(DEI), the nation’s most comprehensive annual
benchmarking tool measuring tangible actions
As part of our Responsible Sourcing towards disability inclusion and equality.
program, we launched our updated
Expectations for Suppliers
document, which outlines specific
standards for suppliers regarding We published our 2020 Sustainability report,
social responsibility, environmental available at www.bd.com/sustainability. The
stewardship, ethical practices, report wraps up performance of our 2020
human rights and governance. Sustainability strategy, in addition to
providing details of our management
approach to various ESG issues, including
Product Quality and Safety.
18Chris Reidy EVP, CFO & CAO
Fiscal Q3 results driven by strong base recovery
                                                                                                       Fiscal Q3 FY21 Revenue Drivers
             Fiscal Q3 FY21 Revenues and Year-over-Year Percent Change                           (Commentary refers to FXN Y/Y basis unless specified)

                                                                                        BD Medical
                                                                             FXN                   •   Strong growth in core products driven by partial
                                                                           Y/Y % ∆                     recovery of hospital utilization / in-patient volumes.
                                 Q3 FY21            Reported       FXN     (ex-COVID               •   Continued strong revenue growth in pre-filled
                                 $ in millions       Y/Y % ∆     Y/Y % ∆     testing)
                                                                                                       devices.
                                                                                                   •   Contributions from COVID-related vaccines.
     BD Medical                   $2,375                +11.9%   +7.7%
                                                                                                   •   Headwinds from BD Alaris™ ship hold and higher
                                                                                                       levels of pandemic-related infusion pump revenues in
                                                                                                       prior year period.
     BD Life Sciences             $1,433                +50.7%   +43.4%    +26.8%
                                                                                        BD Life Sciences
     BD Interventional            $1,082                +38.4%   +34.6%                            •   Strong Bioscience growth driven by recovery in
                                                                                                       research and clinical activity year-over-year.
                                                                                                   •   COVID-19 testing revenues in current quarter.
     Total BD                     $4,890                +26.9%   +22.0%    +17.6%

                                                                                        BD Interventional
     US Revenues                  $2,574                +21.5%   +21.5%                            •   Anniversary of initial COVID-19 impact and the
                                                                                                       recovery of elective procedures relative to the prior
                                                                                                       year driving improvements in unit volumes across all
     OUS Revenues                 $2,316                +33.5%   +22.6%                                three business units.

20   Please see Appendix for non-GAAP reconciliations
BD Medical: Strong recovery in MDS and consistent growth in Pharm
Systems offset by expected decline in MMS
Q3 FY21
Revenues FXN Y/Y BD Management Commentary
Business Unit ($ millions) % Change (Commentary refers to FXN Y/Y basis unless specified)
• Favorable comparison to prior year period due to anniversary of peak COVID-
19 pandemic impact.
Medication Delivery • Overall utilization improving but still moderately below pre-COVID levels.
$1,007 +23.9%
Solutions (MDS) • Core performance showing strength, especially in catheters and vascular care
devices.
• Includes COVID-19 vaccination injection devices.
• Strong growth globally in dispensing. U.S. aided by favorable comparison to
Medication Management prior year period and installation delays from first half.
$597 (14.0%)
Solutions (MMS) • As expected, declines in infusion systems due to difficult comparisons in prior
period globally driven by COVID-19 pandemic needs.
• Favorable comparison to prior year period due to COVID-19 pandemic impact.
Diabetes Care $294 +8.9% • Growth in the quarter also aided by the timing of sales and slightly better than
expected market demand.
• Strong growth of pre-fillable syringes driven by continued demand and enabled
Pharmaceutical Systems $476 +11.9%
by capacity expansion.
21
BD Medical $2,375 +7.7%
Please see Appendix for non-GAAP reconciliationsBD Life Sciences: Strong balanced growth across IDS and Biosciences
Q3 FY21 FXN Y/Y
Revenues FXN Y/Y % Change BD Management Commentary
Business Unit ($ millions) % Change (ex-COVID testing) (Commentary refers to FXN Y/Y basis unless specified)
• Includes COVID-19 diagnostic revenues of $300 million
consisting of:
– BD Veritor™ Plus System: $212 million
– BD Max™, specimen collection and transport: $88
Integrated
million
Diagnostic $1,117 +48.7% +26.6%
Solutions (IDS) • Specimen collection and microbiology diagnostic testing
substantially recovered to pre-COVID-19 levels in the current
period.
• Molecular IVD and TB testing not yet fully recovered to pre-
COVID-19 levels in the current period.
• Continuing to see strong demand for research reagents and
Biosciences $316 +27.3% +27.3% instruments as a result of lab activity returning to normal
levels.
BD Life Sciences $1,433 +43.4% +26.8%
22
Please see Appendix for non-GAAP reconciliationsBD Interventional: Recovery in elective procedure drives strong growth over
prior year
Q3 FY21
Revenues FXN Y/Y BD Management Commentary
Business Unit ($ millions) % Change (Commentary refers to FXN Y/Y basis unless specified)
• High growth globally due to anniversary of COVID-19 impact, which was
most pronounced in the year ago quarter.
Surgery $336 +67.7%
• Sequentially, we saw solid growth in hernia and infection prevention.
• Growth in all regions to anniversary of COVID-19 impact, which was most
pronounced in the year ago quarter.
Peripheral Intervention (PI) $436 +31.8%
• Continued strong performance in atherectomy (Straub).
Urology and Critical Care • Strong growth in Acute Urology driven by PureWick™.
$310 +13.5%
(UCC) • Double digit growth in Targeted Temperature Management.
BD Interventional $1,082 34.6%
23
Please see Appendix for non-GAAP reconciliationsA stronger-than-expected base business performance; a lower-than-
expected tax rate offsets a COVID diagnostic inventory provision
Our COVID diagnostic profit reinvestments are
Q3 FY21 Q3 FY20 Reported FXN
Y/Y ∆ Y/Y ∆ included in COGS, SSG&A, and R&D.
(Adjusted) $ in millions $ in millions
Revenues $4,890 $3,855 +26.9% +22.0% Gross margins: Includes an unfavorable 140 bp
Gross Profit $2,521 $1,993 +26.4% +24.5%
impact from COVID Dx testing inventory provision.
Gross margin 51.5% 51.7% (20bps) +110bps
SSG&A $1,231 $979 +25.7% +21.2%
FX was a 130 bp headwind.
% of revenues 25.2% 25.4% (20bps) (20bps) SSG&A and R&D: Higher expenses due to
R&D $321 $241 +33.0% +31.1%
resumption of activities as revenues increase with
% of revenues 6.6% 6.3% +30bps +40bps
utilization recovery.
Operating Income $969 $773 +25.4% +26.5%
Operating margin 19.8% 20.1% -30 bps +70bps SSG&A: The prior year period reflected cost
Interest Income (exp), net ($115) ($135) (14.9%) (15.7%)
containment measures. Current period reflects
Other Income, net $17 $37 (54.1%) (54.6%)
higher shipping costs and reinvestment spending.
Tax Rate 5.8% 5.0% +80bps N/A
Net Income $821 $642 (A) +27.9% +29.2% R&D: Investment in BD Innovation & Growth Fund,
Preferred Dividend $23 $9 timing of spending, and reinvestment spending
Net Income Applicable to Common
$799 $634 Operating margins: Includes unfavorable 150 bp
Shareholders*
Avg diluted common shares* 291.9 291.5 (A) impact from COVID Dx testing inventory provision.
Adjusted EPS* $2.74 $2.20 (A) +24.5% +25.9%
Tax rate: reflects benefit of discrete tax items.
The adjusted non-GAAP EPS is calculated using net income (preferred dividends are excluded) while the diluted
(A)
share count includes the conversion of the preferred shares in the calculation and uses a diluted share count of
291.5 million.
24 Please see Appendix for non-GAAP reconciliationsQ3 FY21 gross and operating margins impacted by COVID-19 related items
Gross Margin Operating Margin
~ (140) bps ~ 50 bps ~ (150) bps ~ 140 bps
~1.4%
52.4%
51.5% 19.9%
19.8%
Q3 FY21 COVID inventory COVID Dx Q3 FY21 base Q3 FY21 COVID inventory COVID Dx Q3 FY21 base
adjusted provision profit net of gross margin adjusted provision profit net of operating margin
gross margin reinvestments operating margin reinvestments
25We expect our base business gross margins to increase sequentially in Q4
Headwinds from ~ 53.5% - 54%
53.8% FX subside and
53.7%
manufacturing utilization
~(0.1%) improve offsetting
~(0.7%) inflationary pressures
~ 53% - 53.5%
~(0.4%)
~(0.2%) 52.4%
Q2 FY21 COVID Dx net Q2 FY21 base Foreign Inflationary Other Q3 FY21 base Expected Q4 FY21 base FY21
adjusted of reinvestment gross margin exchange pressures (incl. expenses (incl. gross margin sequential gross margin estimated base
gross margin raw material Alaris quality expansion gross margin
costs and in- remediation)
bound freight)
Base business margins adjusts for the net impact of estimated COVID-19 diagnostic testing profitability and the related profit reinvestments back into our business;
refer to the reconciliation to adjusted figures in the appendix
The guidance in this presentation is only effective as of the date given, August 5, 2021, and will not be updated or affirmed unless and until we publicly announce updated
26 or affirmed guidance.Our disciplined capital allocation strategy prioritizes growth but also
returns capital through a competitive dividend and share repurchases
$3.7
Internal investments (e.g., R&D, capex) to drive growth
• Increasing our investments in R&D including the establishment of the
BD Growth & Innovation Fund
Operating Cash Flows
• In December 2020, announced $1.2 billion capital investment to fund
($ in billions)
$2.0 $2.1 expanded pre-filled capacity
$1.6
Tuck-in M&A, equity investments
• Beginning in 2020, BD has completed a total of 13 tuck-in M&A
transactions across all three business segments
Competitive dividend
9 Mo FY18 9 Mo FY19 9 Mo FY20 9 Mo FY21 • November 2020 marked the 49th consecutive year of increases
• BD has indicated that the dividend will be unaffected by the intended
Maintaining a strong, flexible balance sheet diabetes spinoff
• Adjusted net leverage 2.4x as of 6/30/2021
Share repurchases
• Long-term net leverage target ~2.5x • BD repurchased $1 billion in stock in Q3 FY21
• Committed to investment grade credit ratings
27 Note: capital deployment is subject to company and market conditions;
Net leverage targets are on an adjusted basis, see the Appendix for non-GAAP reconciliationsOur continued strong base business momentum powers our higher
fiscal 2021 revenue guidance
Base business FXN COVID
~ +7.5% - 8.0% diagnostic
FX Neutral FX Impact = Reported
+ testing = +
~ +14.0% ~ +2.5% - 3.0% ~ +16.5% - 17.0%
$1.8 - $1.9
billion
Unchanged revenue More favorable
range but greater mix of contribution given
international revenues geographic mix
which have lower
Our global businesses are average selling prices
recovering at a faster-
than-expected pace along
with our crisp execution on
our strategic initiatives
Revenue growth guidance is relative to FY20 revenues of $17,117 million, which included COVID diagnostics revenues of $562 million.
The guidance in this presentation is only effective as of the date given, August 5, 2021, and will not be updated or affirmed unless and until we publicly announce updated
28 or affirmed guidance.Our base momentum and lower tax rate allows us to raise our EPS outlook
while overcoming lower COVID-19 testing profitability
Y/Y adjusted EPS
and FXN growth1
of ~26% - 27%
$12.85 - $12.95
$12.75 - $12.85
May 5, 2021 guidance Continued positive base Tax rate favorability due Q3 share COVID-19 Dx testing August 5, 2021 guidance
business momentum to discrete tax items repurchase activity excess & obsolete
inventory provision, lower
ASPs/geographic mix
1Adjusted EPS growth guidance is relative to FY20 EPS of $10.20; see Appendix for non-GAAP reconciliations
The guidance in this presentation is only effective as of the date given, August 5, 2021, and will not be updated or affirmed unless and until we publicly announce updated
29 or affirmed guidance.Appendix
Supplemental Non-GAAP Reconciliation
 Revenues by Business Segments and Units
 Quarterly Reconciliation of Reported Change and Adjusted Foreign Currency Neutral Change
 For the Three Months Ended June 30, 2021
 (Unaudited; Amounts in millions)
                                    A              B             C       D=A-B      E=A-C-B     F=(A-B)/B    G=(A-B-C)/B
                                                                FX       Rptd        FXN        % Change    % Change FX-
                                  2021            2020        Impact    Change      Change      Reported       Neutral
 TOTAL REVENUES               $     4,890     $ 3,855         $   190   $ 1,036     $   846         26.9%          22.0%
 Less:
     COVID Diagnostics                  300              98        19         202         184         N/A            N/A
 Base Revenues                $     4,590     $ 3,757         $   171   $    833    $   662         22.2%          17.6%
     impact of COVID-Diagnostics1                                           5.2%        4.8%

 BD LIFE SCIENCES             $     1,433     $     951       $   70    $    482    $   412         50.7%          43.4%
 Less:
     COVID Diagnostics                  300              98        19         202         184         N/A            N/A
 BDLS ex-COVID Dx             $     1,133     $     853       $   51    $    280    $   229         32.8%          26.8%
     impact of COVID-Diagnostics1                                           21.3%       19.3%

 IDS                          $     1,117     $     714       $   55    $    403    $   348         56.4%          48.7%
 Less:
     COVID Diagnostics                  300              98        19         202         184         N/A            N/A
 IDS ex-COVID Dx              $         817   $     616       $   37    $    201    $   164         32.6%          26.6%
     impact of COVID-Diagnostics1                                           28.3%       25.7%

     1. Year over year change in COVID diagnostic revenue divided by the prior year total revenue.

     Note: FXN denotes FX-neutral.

     COVID-19 diagnostic revenues of $300 million, included $212 million in BD Veritor™ COVID-19 revenues and $88million of BD Max™
     COVID-19 testing and specimen collection and transport revenues in the Q3 FY21 period.
31
Reconciliation of Adjusted to Base Business Margins
Reconciliation of base business margins to non-GAAP adjusted margins
Q4 FY21 Full Year FY21
(A) (B) (C) = (A) – (B) (D) (E) (F) = (D)-(E)
COVID-19 Dx COVID-19 Dx
Test and Test and
Reinvestment Reinvestment
All-in Adjusted Impact Base Business All-in Adjusted Impact Base
Gross Margin ~51.5% - 52.0% ~(150) bps ~53.0% - 53.5% ~53.5% - 54.0% ~0.0% - 0.5% ~53.5% - 54.0%
Operating Margin ~18.0% - 18.5% ~(200) bps ~20.0% - 20.5% ~23.5% - 24.0% ~200 bps ~21.5% - 22.0%
COVID-19 Dx (Diagnostic) testing includes COVID-related testing on BD Veritor™ and BD Max™ COVID systems as well as swabs and transport. BD reinvested a
portion of the COVID-19 diagnostic testing into the business in FY21 and the reinvestments such reinvestments are netted against the COVID-19 diagnostic test
profitability.
The guidance in this presentation is only effective as of the date given, August 5, 2021, and will not be updated or affirmed unless and until we publicly announce updated
or affirmed guidance.
32Supplemental Non-GAAP Reconciliation
Worldwide Revenues by Business Segment and Unit
Quarterly Reconciliation of Reported Change and Adjusted Foreign Currency Neutral Change
For the Three Months Ended June 30
(Unaudited; Amounts in millions)
A B C D E F=(D-E-B)/B G=(B-C)*(1+F) H=(G-A)/A
FY21 vs FY20 FY21 vs FY19 %
2020 FX 2021 FX
2019 2020 2021 % Change 2021 at 2019 Rates Change
Impact Impact
FX-Neutral FX-Neutral
BDX ex-COVID Dx (base revenues) 4,350 3,757 (85) 4,590 171 17.6% 4,520 3.9%
BDX ex-COVID Dx, ex-US MMS Infusion 4,066 3,503 (85) 4,404 171 20.8% 4,336 6.6%
BDM 2,311 2,122 (50) 2,375 90 7.7% 2,339 1.2%
MDS 981 781 (25) 1,007 40 23.9% 999 1.9%
MMS 661 677 (9) 597 15 (14.0%) 591 (10.9%)
MMS ex-US Infusion 377 424 (9) 411 15 (6.5%) 405 7.0%
DC 275 260 (7) 294 11 8.9% 291 5.8%
PS 394 403 (8) 476 24 11.9% 461 16.9%
BDLS ex-COVID Dx 1,058 853 (24) 1,133 51 26.8% 1,113 5.2%
IDS ex-COVID Dx 774 616 (19) 817 37 26.6% 805 4.0%
BDB 284 237 (5) 316 14 27.3% 308 8.5%
BDI 981 782 (11) 1,082 30 34.6% 1,067 8.7%
PI 396 318 (6) 436 17 31.8% 427 7.7%
SURG 309 197 (2) 336 6 67.7% 333 7.7%
UCC 276 268 (3) 310 7 13.5% 307 11.2%
33Supplemental Non-GAAP Reconciliation
Quarterly Reconciliation of Adjusted Change and Adjusted Foreign Currency Neutral Change
(Unaudited; Amounts in millions, except per share data)
Other Interest
Acquisitions Operating Income Other Income Diluted
Gross and Other (Income) Operating (Expense) Income, Tax Net Earnings per
Revenues Profit SSG&A R&D Restructurings Expense, Net Income Net Net Provision Income Share
Three Months Ended Jun 30, 2021
Reported $ for Three Months Ended Jun 30, 2021 $4,890 $2,161 $1,237 $344 $24 ($72) $628 ($113) ($1) ($11) $525 $1.72
Reported % of Revenues 44.2% 25.3% 7.0% 12.8% 10.7%
Reported effective tax rate -2.1%
Specified items:
Purchase accounting adjustments pre-tax (1) - 349 (6) (1) - - 357 (1) - - 355 1.22
Integration costs pre-tax (2) - - - - (27) - 27 - - - 27 0.09
Restructuring costs pre-tax (2) - - - - 3 - (3) - - - (3) (0.01)
Separation & Related costs (3) - - - - - (16) 16 - - - 16 0.05
Transaction gain/loss, product and other litigation-related matters pre-tax (4) - - - - - 88 (88) - 18 - (70) (0.24)
European regulatory initiatives-related costs pre-tax (5) - 10 (0) (22) - - 32 - - - 32 0.11
Income tax benefit of special items and impact of tax reform - - - - - - - - - 61 (61) (0.21)
Adjusted $ for Three Months Ended Jun 30, 2021 A $4,890 $2,521 $1,231 $321 $0 $0 $969 ($115) $17 $51 $821 $2.74
Adjusted % of Adjusted Revenues 51.5% 25.2% 6.6% 19.8% 16.8%
Adjusted FXN % of Adjusted Revenues (A adjusted for E) 52.8% 25.2% 6.7% 20.8%
Adjusted effective tax rate 5.8%
1. Includes amortization and other adjustments related to the purchase accounting for acquisitions impacting identified intangible assets and valuation of fixed assets and debt.
2. Represents amounts associated with integration and restructuring activities resulting from acquisitions, as well as simplification and other cost saving initiatives.
3. Represents costs recorded to Other operating income, net which were incurred for consulting, legal, tax and other advisory services associated with the planned spinoff of BD's Diabetes Care business. Represents costs
required to develop processes and systems to comply with regulations such as the European Union Medical Device Regulation ("EUMDR") and General Data Protection Regulation ("GDPR").
4. The 2021 amount includes a gain of $88 million on a sale-leaseback transaction which was recorded to Other operating income, net. The amount in 2020 includes an adjustment of $(18) million recorded to Cost of
products sold related to the estimate of future product remediation costs and also includes costs related to another product matter which was recorded in Other (expense) income, net.
5. Represents costs required to develop processes and systems to comply with regulations such as the European Union Medical Device Regulation ("EUMDR") and General Data Protection Regulation ("GDPR").
34Supplemental Non-GAAP Reconciliation
Quarterly Reconciliation of Adjusted Change and Adjusted Foreign Currency Neutral Change
(Unaudited; Amounts in millions, except per share data)
Acquisitions Other Operating Interest Other Income Diluted
Gross and Other (Income) Operating Income Income, Tax Net Earnings per
Revenues Profit SSG&A R&D Restructurings Expense, Net Income (Expense) Net Net Provision Income Share
Three Months Ended Jun 30, 2020
Reported $ for Three Months Ended Jun 30, 2020 $3,855 $1,659 $980 $262 $74 ($15) $358 ($133) $23 ($38) $286 $0.97
Reported % of Revenues 43.1% 25.4% 6.8% 9.3% 7.4%
Reported effective tax rate -15.4%
Specified items:
Purchase accounting adjustments pre-tax (1) - 343 (1) 3 - 15 326 (1) - - 325 1.14
Integration costs pre-tax (2) - - - - (46) - 46 - - - 46 0.16
Restructuring costs pre-tax (2) - - - - (28) - 28 - - - 28 0.10
Transaction gain/loss, product and other litigation-related matters pre-tax (4) - (18) - - - - (18) - 8 - (10) (0.03)
European regulatory initiative-related costs pre-tax (4) - 9 (0) (24) - - 33 - - - 33 0.12
Impacts of debt extinguishment pre-tax - - - - - - - - 6 - 6 0.02
Dilutive impact (6) - - - - - - - - - - - (0.02)
Income tax benefit of special items and impact of tax reform - - - - - - - - - 72 (72) (0.25)
Adjusted $ for Three Months Ended Jun 30, 2020 B $3,855 $1,993 $979 $241 $0 ($0) $773 ($135) $37 $34 $642 $2.20
Adjusted % of Revenues 51.7% 25.4% 6.3% 20.1% 16.7%
Adjusted effective tax rate 5.0%
1. Includes amortization and other adjustments related to the purchase accounting for acquisitions impacting identified intangible assets and valuation of fixed assets and debt.
2. Represents amounts associated with integration and restructuring activities resulting from acquisitions, as well as simplification and other cost saving initiatives.
3. Represents costs recorded to Other operating income, net which were incurred for consulting, legal, tax and other advisory services associated with the planned spinoff of BD's Diabetes Care business. Represents costs
required to develop processes and systems to comply with regulations such as the European Union Medical Device Regulation ("EUMDR") and General Data Protection Regulation ("GDPR").
4. The 2021 amount includes a gain of $88 million on a sale-leaseback transaction which was recorded to Other operating income, net. The amount in 2020 includes an adjustment of $(18) million recorded to Cost of
products sold related to the estimate of future product remediation costs and also includes costs related to another product matter which was recorded in Other (expense) income, net.
5. Represents costs required to develop processes and systems to comply with regulations such as the European Union Medical Device Regulation ("EUMDR") and General Data Protection Regulation ("GDPR").
6. Represents the dilutive impact of BD shares issued in May 2020. The adjusted diluted average shares outstanding (in thousands) in 2020 were 291,476.
35Supplemental Non-GAAP Reconciliation
Quarterly Reconciliation of Adjusted Change and Adjusted Foreign Currency Neutral Change
(Unaudited; Amounts in millions, except per share data)
Acquisitions Other Operating Interest Other Income Diluted
Gross and Other (Income) Operating Income Income, Tax Net Earnings per
Revenues Profit SSG&A R&D Restructurings Expense, Net Income (Expense) Net Net Provision Income Share
Three Months Ended Jun 30, 2021 versus Jun 30, 2020
Adjusted $ change C=A-B $1,036 $527 ($252) ($80) $0 ($0) $196 $20 ($20) ($17) $179 $0.54
Adjusted % change D=C/B 26.9% 26.4% (25.7%) (33.0%) - - 25.4% 14.9% (54.1%) (49.6%) 27.9% 24.5%
Foreign currency translation impact E $190 $40 ($44) ($4) $0 $0 ($9) ($1) $0 $1 ($8) ($0.03)
Adjusted foreign currency neutral $ change F=C-E $846 $488 ($208) ($75) $0 ($0) $205 $21 ($20) ($18) $187 $0.57
Adjusted foreign currency neutral % change G=F/B 22.0% 24.5% (21.2%) (31.1%) - - 26.5% 15.7% (54.6%) (53.0%) 29.2% 25.9%
Please note:
A refers to the adjusted figures for the three-month period ending June 30, 2021 from slide 34
B refers to the adjusted figures for the three-month period ending June 30, 2020 from slide 35
36Supplemental Non-GAAP Reconciliation
Year-to-Date Reconciliation of Adjusted Change and Adjusted Foreign Currency Neutral Change
(Unaudited; Amounts in millions, except per share data)
Acquisitions Other Operating Interest Other Income Diluted
Gross and Other (Income) Operating Income Income, Tax Net Earnings per
Revenues Profit SSG&A R&D Restructurings Expense, Net Income (Expense) Net Net Provision Income Share
Nine Months Ended Jun 30, 2021
Reported $ for Nine Months Ended Jun 30, 2021 $15,113 $7,140 $3,535 $952 $126 $224 $2,304 ($351) $23 $149 $1,827 $6.00
Reported % of Revenues 47.2% 23.4% 6.3% 15.2% 12.1%
Reported effective tax rate 7.5%
Specified items:
Purchase accounting adjustments pre-tax (1) - 1,044 (10) (7) - - 1,061 (5) - - 1,056 3.60
Integration costs pre-tax (2) - - - - (94) - 94 - - - 94 0.32
Restructuring costs pre-tax (2) - - - - (33) - 33 - - - 33 0.11
Separation & Related costs (3) - - - - - (16) 16 - - - 16 0.05
Transaction gain/loss, product and other litigation-related matters pre-tax (4) - 45 - - - (208) 253 - 6 - 258 0.88
European regulatory initiatives-related costs pre-tax (5) - 30 (0) (62) - - 92 - - - 92 0.31
Impacts of debt extinguishment pre-tax - - - - - - - 5 26 - 30 0.10
Income tax benefit of special items and impact of tax reform - - - - - - - - - 265 (265) (0.90)
Adjusted $ for Nine Months Ended Jun 30, 2021 A $15,113 $8,259 $3,525 $884 $0 ($0) $3,850 ($352) $55 $414 $3,140 $10.48
Adjusted % of Adjusted Revenues 54.6% 23.3% 5.8% 25.5% 20.8%
Adjusted FXN % of Adjusted Revenues (A adjusted for E) 55.5% 23.4% 5.9% 26.2%
Adjusted effective tax rate 11.6%
1. Includes amortization and other adjustments related to the purchase accounting for acquisitions impacting identified intangible assets and valuation of fixed assets and debt.
2. Represents amounts associated with integration and restructuring activities resulting from acquisitions, as well as simplification and other cost saving initiatives.
3. Represents costs recorded to Other operating expense (income), net which were incurred for consulting, legal, tax and other advisory services associated with the planned spinoff of BD's Diabetes Care business.
4. The 2021 amount includes a gain of $88 million on a sale-leaseback transaction, as well as charges to record product liability reserves, including related legal defense costs, of $296 million. The product liability-related
charges and sale-leaseback gain were recorded to Other operating expense (income), net. The amounts in 2021 and 2020 include charges of $37 million and $240 million, respectively, recorded to Cost of products sold
related to the estimate of future product remediation costs. The amount in 2020 also includes costs related to another product matter which was recorded in Other income, net.
5. Represents costs required to develop processes and systems to comply with regulations such as the EUMDR and GDPR.
37Supplemental Non-GAAP Reconciliation
Year-to-Date Reconciliation of Adjusted Change and Adjusted Foreign Currency Neutral Change
(Unaudited; Amounts in millions, except per share data)
Acquisitions Other Operating Interest Other Income Diluted
Gross and Other (Income) Operating Income Income, Tax Net Earnings per
Revenues Profit SSG&A R&D Restructurings Expense, Net Income (Expense) Net Net Provision Income Share
Nine Months Ended Jun 30, 2020
Reported $ for Nine Months Ended Jun 30, 2020 $12,333 $5,372 $3,126 $797 $235 ($15) $1,229 ($400) $12 $96 $746 $2.38
Reported % of Revenues 43.6% 25.3% 6.5% 10.0% 6.1%
Reported effective tax rate 11.4%
Specified items:
Purchase accounting adjustments pre-tax (1) - 1,033 2 (0) - 15 1,016 (4) - - 1,012 3.63
Integration costs pre-tax (2) - - - - (165) - 165 - - - 165 0.59
Restructuring costs pre-tax (2) - - - - (69) - 69 - - - 69 0.25
Transaction gain/loss, product and other litigation-related matters pre-tax (4) - 240 - - - - 240 - 8 - 248 0.89
European regulatory initiatives-related costs pre-tax (5) - 22 (0) (55) - - 77 - - - 77 0.28
Investment gains/losses and asset impairments pre-tax (6) - 39 - - - - 39 - 1 - 41 0.15
Impacts of debt extinguishment pre-tax - - - - - - - - 6 - 6 0.02
Income tax benefit of special items and impact of tax reform - - - - - - - - - 218 (218) (0.78)
Adjusted $ for Nine Months Ended Jun 30, 2020 B $12,333 $6,706 $3,128 $742 $0 ($0) $2,837 ($404) $28 $314 $2,147 $7.41
Adjusted % of Revenues 54.4% 25.4% 6.0% 23.0% 17.4%
Adjusted effective tax rate 12.8%
1. Includes amortization and other adjustments related to the purchase accounting for acquisitions impacting identified intangible assets and valuation of fixed assets and debt.
2. Represents amounts associated with integration and restructuring activities resulting from acquisitions, as well as simplification and other cost saving initiatives.
3. Represents costs recorded to Other operating expense (income), net which were incurred for consulting, legal, tax and other advisory services associated with the planned spinoff of BD's Diabetes Care business.
4. Includes charge of $240 million recorded to Cost of products sold related to the estimate of future product remediation costs, and costs related to another product matter which was recorded in Other income, net.
5. Represents costs required to develop processes and systems to comply with regulations such as the EUMDR and GDPR.
6. The prior-period amount primarily represents a charge recorded to write down the carrying value of certain intangible assets in the Biosciences unit.
38You can also read