WHO'S HUNGRY FACES OF HUNGER - 2012 PROFILE OF HUNGER IN THE GTA
←
→
Page content transcription
If your browser does not render page correctly, please read the page content below
WHO’S HUNGRY
FACES OF HUNGER

2012 PROFILE OF HUNGER IN THE GTA
In this report we present the voices of those
interviewed as well as the observations
from the volunteers. Together they help
present the face of hunger. It is hoped that
by showing this face we can inspire action,
and push for solutions.
It is only through the assistance of survey
volunteers and people accessing food
banks that we are able to present the face
of hunger. “Survey Volunteers” are those
who volunteered to conduct one-on-one
interviews with people accessing food
banks. “Survey Respondents” are those
who are accessing food banks who agreed
to participate in the survey, helping share
their stories and voices.
“During one interaction, the
children in one family were
smiling and energetic
throughout. Even during the
questions about how often
they went hungry, their
warmth or smiles didn’t
wane and I couldn’t help
but find it so incongruous,
but caught myself
wondering if I was making
assumptions about how
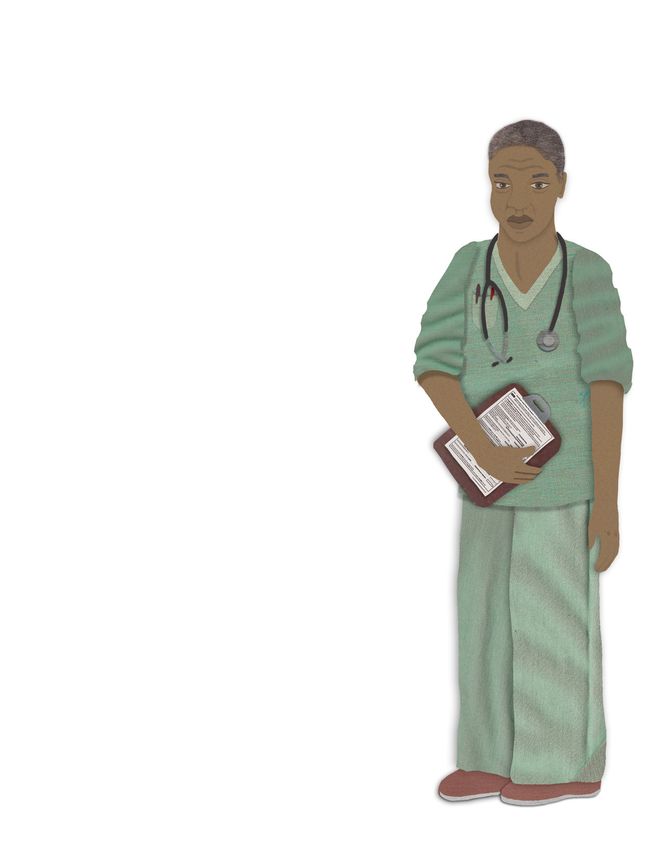
Illustrations by Alyssa Andres
hunger should look.”
~ Who’s Hungry Report 2012,
Survey Volunteer
2 | 2012 WHO’S HUNGRY REPORT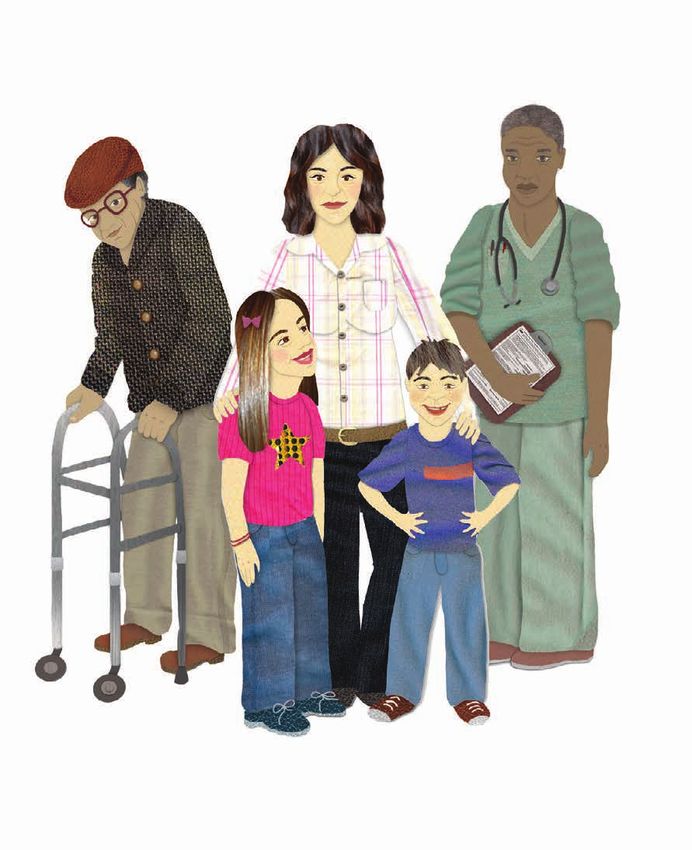
FACES OF HUNGER
      WHO’S HUNGRY
        2012 PROFILE OF HUNGER IN THE GTA

        4-5
            Message from the Chair of the Board
            and the Executive Director
        6-7     Key Findings

        8-9     The Faces of Hunger

        10-14 Hunger by the Numbers

        15-16 Changing Faces of Hunger

        17-18 Depth of Hunger

        19-21 Driving Forces of Hunger

        22-23 Solutions to Hunger

        24-25 Methodology

        26      Acknowledgements

                               2012 PROFILE OF HUNGER IN THE GTA | 3
FACES OF HUNGER

        MESSAGE FROM THE CHAIR OF THE
        BOARD AND THE EXECUTIVE DIRECTOR
        The face of hunger in our communities is not easy to see.
        In the 2012 Who’s Hungry Report: Faces of Hunger, you            person who needed a food bank, that stereotype no longer
        will see that hunger in the Greater Toronto Area (GTA) is        exists. It could be your neighbour, friend or someone in
        often hidden. Not being able to afford food and going            your extended family. It could even be you. The people
        hungry, let alone coming to a food bank, is often not            coming to a food bank are as diverse as they could possibly
        discussed with friends, family or neighbours. It is often        be. What brings them through the doors for the first time
        thought that people are not supposed to go hungry in a           could be a loss of a job, a sudden disability or being told
        wealthy country like Canada. When they do, it is seen as an      for the hundredth time that they have great skills, but no
        individual failing—something must be wrong with them.            Canadian work experience.
        So when someone is suddenly faced with the fact that
        they also cannot afford food, they may feel ashamed. They        People need support to pay the rent
        may continue to suffer quietly or only come to a food bank       AND put food on the table.
        when they can’t take the hunger any more or the worry
        about their children having enough to eat.                       As diverse as the people coming to food banks are, there
                                                                         is one key issue that brings most through our doors: they
        The reality is hunger in the GTA exists. After another year
                                                                         pay a very high percentage of their income on rent. On
        of an unsteady economy and rising food inflation, our
                                                                         average, our clients who live in market housing pay 71
        number of client visits is heading upward again, nearly 20
                                                                         per cent of their income on rent; spending 30 per cent
        per cent higher than before the recession in 2008. This year
                                                                         is considered affordable, spending 50 per cent means
        we saw 1,123,500 visits through the doors of our member
                                                                         you are one paycheque away from being on the street.
        agencies and those of our regional partners throughout
                                                                         When people are struggling with low income, rent is non-
        the GTA. The number of visits in the inner suburbs are
        catching up to those in the city core. It is especially
        disturbing to us that people, including children, are going
        hungry more often than they were before the recession.

        The face of hunger is also changing. More and more
        of those coming through our doors have a similar
        demographic profile to the general population. Twenty-
        eight per cent have a university education or higher.
        People who you don’t realize are struggling because they
        don’t “look” poor are skipping meals or not eating for an
        entire day. When you sit on a bus, look to the left or look to
        your right—one of those people may be coming to a food
        bank. It could be anyone. If there was ever a stereotypical

4 | 2012 WHO’S HUNGRY REPORT
It would be paid to all low-income people, regardless of
                                                                     whether they are receiving social assistance or working.
                                                                     By doing so, more people will be lifted out of poverty. It is
                                                                     now up to the provincial government to implement this
                                                                     next step.

                                                                     Help us continue the fight against
                                                                     hunger. Join the fight.
                                                                     The bottom line is that food banks are here to help. Coming
                                                                     to a food bank for the first time can be very difficult and
                                                                     it’s part of the reason there are so many people out there
                                                                     struggling with hunger silently. We are here for as long
negotiable. While you can eat less food when money is                or as short a time as we are needed and we do far more
tight, you can’t pay less rent, or pay for the kitchen and not       than just provide emergency food programs. While we
the bedroom. As one survey respondent said “You need                 will continue to push for the changes needed to put more
shelter to exist. Food is a luxury.” Therefore, a key solution       money in people’s pockets, we will continue to do our best
is to help people better afford housing.                             to make sure people get the healthiest food possible, as
                                                                     well as the support and information needed.
The high percentage that people coming to food banks
spend on shelter is why Daily Bread wants the Ontario                LEARN MORE about the proposed Ontario Housing Benefit
government to create a benefit that will help people to pay          and other information by visiting www.dailybread.ca. Tell
for their rent. If people get help paying for their housing,         your provincial candidate to support an Ontario housing
they will be better able to afford food. This is why housing         benefit.
matters. A housing benefit is a bold idea that would help
                                                                     Help SPREAD THE WORD by sharing this report with
people pay the rent and put food on the table.
                                                                     friends, family and neighbours.

Times are changing and the labour                                    VOLUNTEER with Daily Bread Food Bank, or at the local
                                                                     food bank in your community.
market is changing. Our income security
                                                                     DONATE. Daily Bread Food Bank relies on your generous
system needs to change with it.                                      donations to be able to fund research, pressure the
                                                                     government for change, educate youth in schools about
Following on the heels of the Ontario Child Benefit, an
                                                                     poverty and provide food and resources to those in need.
Ontario housing benefit would be another crucial step
towards the restructuring of our income security system.

                                                            Anne Kothawala                                      Gail Nyberg
                                                            Chair of the Board                                  Executive Director

                                                                                                       2012 PROFILE OF HUNGER IN THE GTA | 5
FACES OF HUNGER

        KEY FINDINGS
        HUNGER BY THE NUMBERS
         Number of visits to GTA food banks

         1,123,500
                                                                         That’s more than
                                                                         the number of riders
                                                                         through Bloor-Yonge
                                                                                                      18%
                                                                                                      INCREASE
                                                                         station in a typical
                         OVERALL                                         work week.
                                                                                                      or over 170,000 visits since
                                                                                                      pre-recession period in 2008.

                                                                    177,500                        946,000
                                                                               905                     TORONTO

                                                                                                  799,500
                                                                                 DBFB MEMBER AGENCIES

         DRIVING FORCES OF HUNGER
         The driving force of demand for food banks is lack of income. The amount of money people are left with per day after rent
         has been paid is less than a TTC round trip.

        $691      Median monthly income.                      $5.83 Money available per person per day after rent is paid.

        Percentage income spent on rent/mortgage including utilities :

           30%       AVERAGE AFFORDABLE                 50%   RISK OF HOMELESSNESS              71%    FOOD BANK CLIENT

6 | 2012 WHO’S HUNGRY REPORT
TOTAL FOOD BANK VISITS, 1995 TO PRESENT
  1,400,000

  1,200,000

  1,000,000
                            Tenant Protection Act (TPA) introduced                                      Start of recession
   800,000
                                                        Rents go up as a result of TPA
   600,000
                Welfare rates cut by over 20%
   400,000

         0
              1995   1996   1997   1998   1999 2000   2001   2002    2003 2004   2005    2006   2007 2008   2009   2010   2011   2012

DEPTH OF HUNGER                                        THE CHANGING FACE OF HUNGER
39%    Adults who have not eaten
       for a day because of lack of
                                                       Overall, compared to five years ago, people visiting food banks are older,
                                                       more likely to be born outside of Canada and have higher levels of education.
       money.

45%    Adults who go hungry
       at least once per week
                                                                          				2012                                  2007
       because of lack of money.                                          Born outside of Canada............... 51% 44%

32%    Food bank clients who are
       children.
                                                                          Graduated university................... 28%            25%
25%    Children who go hungry
       at least once per week                                             45 to 64 years old........................ 26%         24%
       because of lack of money.

32%    Adults who have given up
       food in order to pay rent.

                                                                                                             2012 PROFILE OF HUNGER IN THE GTA | 7
FACES OF HUNGER

        THE FACES OF HUNGER
             “I feel honoured to have heard these people’s stories and am surprised by the courage, warmth,
          openness and hope I encountered. It makes it even more difficult to understand how the problem of
         hunger is so widespread and how easy it is to miss. But it is very real in ways one might not necessarily
         imagine. I feel that my experience won’t allow me to forget these faces and how much I was affected.
             The facts of their circumstances were painful to hear, yet their spirits were so full of energy and
                                         directness that it made it overwhelming to take in.”
                                                             ~ Survey Volunteer

        Every year Daily Bread conducts a survey across the GTA            banks, but also get a rare glimpse of the face of hunger in
        of people who access food banks. Over 100 volunteers               the GTA. We can see that poverty in our communities is a
        go out to over 40 food banks across the city to conduct            contradiction between the dignity, pride and strength of
        one-on-one interviews with food bank clients. The only             those who are struggling to make ends meet and their present
        project of its kind in Canada, Daily Bread’s annual survey         circumstances in which they have to contend with the pain of
        is a crucial tool that helps to raise awareness of the issues      hunger in order to keep a roof over their heads.
        that contribute to hunger and poverty by listening to the
                                                                           Through the annual survey we also get to hear a diverse
        people that it is affecting the most.
                                                                           range of voices not heard in public policy debates about
        It is only through the assistance of these volunteers and people   poverty. We can hear first-hand through those with lived
        accessing food banks that we are able to do this work. Hunger      experience about what causes hunger, where the social
        and poverty are often very well hidden in the GTA. Through         safety net has holes in it, and the desire to contribute to their
        this process we not only see how many people come to food          community or get back on their feet.

8 | 2012 WHO’S HUNGRY REPORT
Through their interviews, survey volunteers help to share this    this face we can inspire action, and push for solutions. A big
voice. Volunteers can also give us an overall view of what they   part of this solution has to address that the driving force
saw, heard and felt during the interviews. Their observations     behind hunger and poverty in the GTA is a lack of income.
add to the face of poverty that many don’t see, with many         Food banks are essential but emergency food programs
having their own assumptions and beliefs being challenged.        can only help to a certain point. It is crucial to push for the
The volunteers emphasize how much they could identify with        solutions that address lack of income while supporting those
the people they interviewed, and that the only way they differ    who need help. This means creating an income security
in most cases was their present financial circumstances.          system that allows for more people to put food on the table
                                                                  and keep a roof over their heads, while still providing food to
In this report we present the voices of those interviewed as
                                                                  those who need it. Above all, we need solutions that support
well as the observations from the volunteers. Together they
                                                                  people’s pride and dignity, while making sure they don’t go
help present the face of hunger. It is hoped that by showing
                                                                  hungry.

                                                                      “When I signed up to volunteer for the Daily
                                                                  Bread Food Bank’s annual survey, I was unsure of
                                                                  exactly what to expect. The people who use food
                                                                  banks are not a part of society to which we pay a
                                                                  great deal of attention, nor are many who use the
                                                                  food bank open with that fact to their friends and
                                                                  family. Still, I had somehow ended up considering
                                                                   people who use the food bank as different than
                                                                     me. But one of the realizations I made when I
                                                                     started talking to people was just how many
                                                                   similarities there are between us. If just a couple
                                                                     of things were to be changed, anyone could
                                                                  easily be in their position. While I may have heard
                                                                    it before, I finally understood and experienced
                                                                     first-hand that poverty and hunger can strike
                                                                                     anyone at any time.”
                                                                                     ~ Survey Volunteer

                                                                                                     2012 PROFILE OF HUNGER IN THE GTA | 9
FACES OF HUNGER

        HUNGER BY THE NUMBERS
        For every one person who comes to a food bank, there is at least one other person
        who cannot afford food and is struggling with hunger who does not come.

               Overall Number of Client Visits
                         April 2011 to March 2012

                    1,123,500

                            799,500                                                                177,500                                          946,000
               DBFB MEMBER AGENCIES                                                                                    905                                TORONTO

        The high numbers of people coming to a food bank in the                                per cent increase. Overall, the numbers of client visits are still
        GTA shows the extent of the economic hardship that many                                18 per cent percent higher than before the 2008 recession,
        people are facing. The highest increase in numbers of people                           which provides a clear illustration of the lasting effect the
        coming to a food bank in over a decade happened two years                              economic crisis has had in the GTA. Since the recession,
        after the recession, not during. Then unemployment rates                               visits have markedly increased in the inner suburbs such as
        stabilized, and numbers decreased — but uncertainty and                                Etobicoke, North York and much of Scarborough.
        a feeling of fear over economic stability was still in the air.
                                                                                               These numbers may just be the tip of the iceberg. One study
        Now due to rising costs of living, more people are having a
                                                                                               showed that only 40 per cent of households deemed to
        harder time affording the basics and as a result the numbers
                                                                                               be “severely food insecure” had actually used a food bank
        of people needing help is rising again. Total client visits from
                                                                                               during the previous year.1 What this disturbing information
        April 2011 to March 2012 were 1,123,500, the fourth year in
                                                                                               may mean is that for every one person who comes to a food
        a row surpassing one million visits. There is now a four per
                                                                                               bank, there may be at least one other person who cannot
        cent increase in client visits over last year in the GTA. Toronto
                                                                                               afford food and needs the help who does not come. There
        saw a four per cent increase, and the 905 region saw a two

                                          1
                                              Sharon I. Kirkpatrick, PhD, RD, and Valerie Tarasuk, PhD, “Food Insecurity and Participation in Community Food Programs among Low-income Toronto
10 | 2012 WHO’S HUNGRY REPORT                 Families”, Canadian Journal of Public Health, March/April 2009, pp.135-139. “Severely food insecure” is defined as “reduced food intake and disrupted eating
                                              patterns” (Statistics Canada, Canadian Community Health Survey, Cycle 2.2 Nutrition (2004): Income-Related Household Food Insecurity in Canada).
are various reasons why people who are clearly struggling have less than six dollars per day available after rent is
with hunger aren’t coming to food banks. paid—not enough to cover a round trip TTC fare.
“Stigma” is when someone is labeled by society in a
negative way as “different”. There is a strong stigma
How long have people been coming to a
associated with poverty in a wealthy society such as food bank on a regular basis?
Canada, and getting help from a food bank is seen as a
Length of time coming to a food bank 2012 2007
symbol of poverty. When asked why they thought people
Less than 1 year 49% 59%
don’t come to a food bank even when they need to, survey
More than 1 year to 2 years 19% 13%
respondents said repeatedly that a sense of pride and More than 2 years 33% 28%
stigma may be a reason, and noted that they themselves
had not come in the past for similar reasons. Respondents
also frequently mentioned that the cost of public
transportation is a significant barrier to accessing a food
bank, not surprising given that on average respondents
“It was painful to hear many people repeat the phrase, “I was ashamed,” as
the reason they hesitated to come [to the food bank].”
~ Survey Volunteer
“Pride stops a lot of people. I’ve been suffering for years but being too
proud has made my health suffer as well. Time to humble oneself.”
~ Survey Respondent
“There’s a stigma of not being able to provide for yourself that stops
people; as adults you’re measured by your ability to take care of yourself.
When you can’t, you feel embarrassed.”
~ Survey Respondent
“There is some reluctance, especially if one is used to not relying on any
support. (There’s) a sense of some stigma…often people use food banks
as a temporary aid, when stabilizing their finances. It’s not always forever.”
~ Survey Respondent
2012 PROFILE OF HUNGER IN THE GTA | 11FACES OF HUNGER
For many people, coming to a food bank is a temporary
Why people initially need help
measure to get them through a difficult financial period.
About half of people coming to a food bank have been Losing a job is a key reason why a significant portion of
doing so for less than a year, with people coming on average people come to a food bank for the first time. There is often
for 16 months. However, five years ago, the majority (59 per a delay in the amount of time people come to a food bank
cent) were coming for less than one year, and on average for after losing work—they may have run out of Employment
only 12 months. We are now seeing more people coming Insurance benefits (E.I.) if they have been able to access it, or
for longer periods of time, with the majority (52 per cent) have spent down their savings or used a line of credit. Many
coming for more than one year, compared to five years ago have part-time, casual or seasonal work arrangements and
when 41 per cent had been coming for more than one year. are not eligible for E.I., and have to come to food banks so
One reason for this may be that in the last few years, rates of they can get food during gaps in their employment income.
inflation on basic items such as food have been increasing
The sudden onset of a disability or serious illness is often a
faster than the core inflation rate itself, having a greater
trigger for poverty, especially when there are few income
impact on those with limited incomes.2
supports available except for social assistance for those
who do not have disability coverage. Those with long-term
Reason Percentage disabilities receiving fixed incomes have to contend with
Lost job 34% food and energy prices rising above inflation, and are more
Disability 16% likely to find their dollar simply does not last until the end of
New to area 16% the month.
Just found out about food bank 10%
Those who are new to the area are often newcomers who
Living on savings 9%
have been in the country for five years or less. Some are
Family break-up 8%
refugee claimants waiting for their claims to be processed,
Left Employment Insurance 4%
while others are landed immigrants who are having difficulty
Can’t access Employment Insurance 4%
getting their foreign credentials and education recognized
Reduced hours at work 3%
and cannot find employment.
Can’t access social assistance 2%
Other 12%
“… some [people] have been using the food
bank for years, while others have just gotten
over the stigma of making their first trip. Some
can’t see a way out of relying on the food bank,
while others are hopeful for the future.”
~ Survey Volunteer
2
John Stapleton, “Less on their Plate,” Canadian Centre for Policy Alternatives, September 1, 2011.
12 | 2012 WHO’S HUNGRY REPORT www.policyalternatives.ca/publications/monitor/less-their-plateConvention Refugees are forced to
leave their countries to escape war,
persecution or harm and seek refuge or
protection in another country. When a
refugee arrives in Canada, the claimant
must be granted approval from the
Immigration and Refugee Board (IRB)
to be able to remain in the country. This
year, six per cent of survey respondents
were refugee claimants.
Recently, refugees from North Korea
have managed to escape their home
country and have arrived in Canada,
and these North Korean newcomers
are among the faces of hunger in
the GTA. What they have endured
from their escape from North Korea
may not immediately be apparent
as they sit silently waiting with their
hamper bags, chatting quietly with
their friends, or cooing joyfully over
their babies, but their stories are real,
powerful and transcend any language
barrier that might exist. Similar to
so many other food bank clients,
one North Korean newcomer said
that “people are shy”accessing food
from a food bank, and feel a sense of
“embarrassment” doing so. It can be
extremely difficult and traumatic to
have to flee a country, but food banks
and emergency food programs are here
to help in whatever ways possible.
2012 PROFILE OF HUNGER IN THE GTA | 13“Some days I was
overwhelmed by the
number of seniors using
the food bank. Many
had lost jobs late in
their careers, throwing
a wrench into their
retirement savings. I had
heard it was difficult
for older people to
get hired, but now I
know it’s true. And it’s
especially difficult when
English is not your first
language. Retirement
is supposed to be a
great time to relax and
enjoy life, but when
you’re living paycheque-
to-paycheque it’s
impossible.”
Illustrations by Alyssa Andres
~ Survey Volunteer
14 | 2012 WHO’S HUNGRY REPORTCHANGING FACES OF HUNGER
Overall, people visiting food banks are getting older, more likely to be born outside Canada and
are likely to have higher levels of education compared to five years ago.
Those between 45 and 64 are now 26 per cent of those coming Citizenship Status 2012 2007
to food banks, whereas five years ago they were 24 per cent. Canadian Citizen/First Nations 73% 78%
The median age of survey respondents five years ago was 42; Landed immigrant/permanent resident 20% 15%
it is now 46. Many survey respondents in this age bracket are Refugee claimant 6% 4%
single-person households and have a long-term disability. The Other 2% 3%
increase in persons 45 and up is reflective of the demographic First Nations 2012 2007
trend occurring in the general population of Toronto.3 Yes 7% 8%
Country of Birth 2012 2007
The majority (51 per cent ) of those coming to food banks are Born outside Canada 51% 44%
born outside of Canada, whereas five years ago they were 44 Gender 2012 2007
per cent of respondents. They are more likely to have university Female 53% 55%
levels of education, have families with children under 18 and Male 47% 45%
Age Groups 2012 2007
have someone in the household who is working. Newcomers
18 and under 32% 34%
may be Canadian citizens, permanent residents (landed
19 to 44 38% 38%
immigrants) or refugee claimants waiting for their claims to
45 to 64 26% 24%
be processed. Most face the difficulty of finding an affordable
65 and up 4% 3%
place to live for themselves and their families, and pay a very Median age 46 years 42 years
high portion of their income on rent as a result.
Household Composition 2012 2007
Higher numbers of people born outside of Canada coming Single 45% 44%
Single parent 17% 19%
to food banks is related to the increase of respondents
Couple without children 8% 9%
with a university or college degree. Twenty-eight per cent
Couple with children 18% 18%
of respondents report a university or college education or
Extended family without children 9% 6%
higher compared to 25 per cent five years ago. Those who
Extended family with children 4% 4%
are university educated are more likely to have permanent Education 2012 2007
resident (landed immigrant) status. Those with permanent Grade school or less 8% 9%
resident status are often skilled and educated workers, facing Some high school 20% 23%
the ongoing barrier of having their skills and credentials Graduated high school 22% 23%
recognized once they settle in the country, often lacking the Some college or university 23% 21%
social and professional networks to compete for jobs in a Graduated college or university 24% 22%
troubled economy. Post-graduate degree 4% 3%
Disability 2012 2007
There are regional differences in regards to demographics. Yes 45% 51%
There are more families with children coming to food banks
in the 905 area, while there are higher numbers of single
people and a larger percentage of those in the 45 to 64 age
group in the 416 area.
3
For the Toronto Census Metropolitan area those in the age range of 45 to 64 are 27 per cent of the population. 2012 PROFILE OF HUNGER IN THE GTA | 15
www.toronto.ca/demographics/pdf/censusbackgrounder_ageandsex_2011.pdf“There’s a question on the survey
that asks for your highest level of
education. At first I assumed that
for people using the food bank,
education levels would probably
be quite low, but that’s not true
at all. Both women I met that
morning had master’s degrees
from their native countries. One
was an engineer from Algeria
and the other was a scientist
from Cuba. Neither could get
work here in thier field. They both
spoke good English and were
taking classes to improve but
they said it’s very difficult to get
employers here to recognize their
qualifications. Both had children
and were using the food bank to
support their families. I have a
master’s degree and got a job in
my field as soon as I graduated.
Meeting these women made
me realize this isn’t something I
Illustrations by Alyssa Andres
should take for granted.”
~ Survey Volunteer
16 | 2012 WHO’S HUNGRY REPORTDEPTH OF HUNGER
“You need shelter to exist. Food is a luxury.”
~ Survey Respondent
While food banks have been seeing much greater numbers How often were your children hungry in
of people than the pre-recession period, those numbers
are just one indicator of the economic hardship people are
the last 3 months because you could not
facing. The frequency with which people go hungry is also afford to buy food?
increasing and is substantially more than five years ago.
Forty-five per cent of adults are going hungry at least once a Amount 2012 2007
week in 2012, compared to 40 per cent in 2007. Twenty-five
At least a couple days per week 12% 10%
per cent of children are hungry at least once a week in 2012,
At least one day a week 13% 8%
compared to 18 per cent in 2007. This could be because the
cost of food is rising faster than inflation, whereas incomes At least one day a month 10% 5%
have stayed relatively stagnant. Rarely 17% 15%
Never 48% 62%
Hunger means not being able to afford balanced meals,
skipping or reducing sizes of meals, or not eating at all for People skip meals so they can afford transportation in order
an entire day due to lack of money. For those living on fixed to get to work, school, or essential services such as medical or
monthly incomes, hunger often occurs toward the end of the child care. Not being able to afford transportation is a huge
month when money has run out. barrier even in regards to accessing food. Many respondents
mentioned they cannot get to a food bank because they
Hunger is also the result of making frightening choices. You could not afford public transportation.
pay your rent so you don’t get evicted, or you eat. For most
the choice is obvious. You may be able to eat less food when Hunger means prioritizing a loved one’s needs over your
money is tight, but you cannot pay less rent. Utility bills like own. Households with kids said that they had given up
gas, water or heat also have to be paid. meals for their children, or for child-related items/activities.
People give up eating so their kids can eat properly, purchase
formula and diapers for infants, or so a daughter’s broken
school bag could be replaced.
How often were you hungry in the last 3
People often go hungry in order to afford prescription
months because you could not afford to medications as well as over-the-counter medication such
buy food? as cough medicine or aspirin. While recipients of social
assistance are usually provided a drug plan and limited
Amount 2012 2007 dental coverage, the benefits are not exhaustive. Numerous
At least a couple days per week 24% 22%
respondents with serious long-term illness or disability
indicate they’ve had to give up meals to pay for medicine not
At least one day a week 21% 18%
covered by the Ontario Disability Support Program.
At least one day a month 15% 10%
Rarely 21% 22%
Never 20% 29%
2012 PROFILE OF HUNGER IN THE GTA | 17FACES OF HUNGER
In the past 12 months, have you ever not eaten for a whole
day because of lack of money for food?
Amount 2012
Yes 39%
If yes, how often?
Amount 2012
Almost every month 54%
Some months but not every month 31%
Only one or two months 15%
“During another interview I had to fight
to not get emotional while listening
59%
Survey respondents who have had to a woman talk about how she tried
to give up a meal in order to pay for to make a can of soup last for several
something else in the last 3 months.
days. She told me that she would try
to flavour water sometimes even just
Survey respondents gave up a meal to pay for: slightly by reusing tea bags, and how
RENT
that would quell her hunger a bit more
32%
than just using plain water.”
BILLS/UTILITIES (GAS, HYDRO, WATER)
20% ~ Survey Volunteer
TRANSPORTATION
15% “The tendency is to eat heartily for a couple
CHILD AND CHILD-RELATED
of weeks and have to ration/go hungry
9% until the following month.”
HEALTH AND MEDICAL ~ Survey Respondent
6%
18 | 2012 WHO’S HUNGRY REPORTDRIVING FORCES OF HUNGER
“Until I met food bank clients, I had no idea how little people on Ontario Works receive. And if you’re
not in subsidized housing, it’s absolutely astonishing how much income people spend on rent. For
some people I spoke with, there was sometimes not even $50 left to cover all other expenses after
paying for housing. Doing surveys has made me far more aware of income inequality in Toronto and
the lack of subsidized housing in the city.”
~ Survey Volunteer
The driving force of hunger and of demand for food banks
68%
is lack of income. The median monthly income for people Survey respondents who report
coming to food banks is $691.4 With the average cost of getting their main income from one
a bachelor apartment in the GTA being $818 and a one of two social assistance programs.
bedroom $973,5 it is extremely challenging to find a place
to live that is remotely affordable for this level of monthly
In Ontario, the social assistance programs are:
income. Households with children are less likely to be able
to find apartments below average cost, as there are fewer Ontario Works (commonly known as welfare),
affordable options due to the extra rooms that are required. intended to provide a temporary source of income
For the 70 per cent of survey respondents who pay market when job loss occurs or if no other source of income
rent, they are spending on average 71 per cent of their is available.
income on rent. Ontario Disability Support Program, which is
provided to individuals with chronic or long-term
This lack of income is related to the sources of income
illness or disability in order to help them meet their
people receive. Sixty-eight per cent of respondents report
living expenses.
getting their main source of income from one of two social
assistance programs in Ontario: Ontario Works (sometimes On their own, neither form of income is enough to
referred to as welfare) and the Ontario Disability Support live on, nor are they indexed to the costs of living.
Program. Ontario Works is intended to provide a temporary Receiving social assistance and going hungry is not an
source of income when job loss occurs or if no other income isolated phenomenon. Health Canada research shows
is available, and Ontario Disability Support Program is that nationally, receipt of social assistance as a main
provided to individuals with chronic or long-term illnesses or source of income is by far most closely associated with
disability in order to help them meet their living expenses. food insecurity.
On their own, neither form of income is enough to live on,
nor are they indexed to the costs of living. For example, the going hungry is not an isolated phenomenon. Health Canada
monthly income for a person receiving Ontario Works is research shows that nationally, receipt of social assistance
$599, an amount which makes coming to a food bank on as a main source of income is by far most closely associated
a regular basis a necessity. Receipt of social assistance and with food insecurity.6
4
This is “adjusted” median household income, a method which takes into account the varying sizes of all households and adjusts the dollar value accordingly. This method divides a
household’s income by the square root of the size of the household. The “unadjusted” amount of income is $1,039. The adjusted level of household income is lower because of the high
numbers of survey respondents who were single-person households and therefore receiving lower levels of social assistance income.
5
Canada Mortgage and Housing Corporation, “Rental Market Report, Greater Toronto Area.” Fall 2011.
6
Canadian Community Health Survey, Cycle 2.2, Nutrition (2004) ”Income-Related Household Food Security in Canada” 2012 PROFILE OF HUNGER IN THE GTA | 19
Office of Nutrition Policy and Promotion, Health Products and Food Branch. Health Canada, 2007.FACES OF HUNGER
Paid work does not guarantee freedom from hunger. As a result, people have to choose between dental work and
Thirteen per cent of respondents receive their main source of medications, or food.
income from employment, and one quarter of respondents
Some people require both welfare and work to get them
have at least one person in their household who is
through the course of the year. Due to casual or seasonal work
employed. While much focus is often given to increasing
arrangements, such as landscaping or construction, the length
the minimum wage to address poverty for those who are
of work periods are shorter and qualifying for Employment
working, this focus only addresses part of the issue. The
Insurance becomes less likely. Therefore Ontario Works
median hourly income for respondents who are working
becomes the only option to fill the gap in income. Close to
is $11.23 and 68 per cent of respondents earn more than
one third (32 per cent) of respondents receiving Ontario Works
the minimum wage of $10.25 per hour. Almost one quarter
have cycled on and off of it two or more times.
(22 per cent) earn more than $15 an hour. The current
labour market trend, of moving from full-time employment For survey respondents, the cost of living related to housing
towards part-time and casual employment, is being seen in is only partly mitigated by subsidized housing. Subsidized
the employment situations of survey respondents as well. housing, also known as Rent Geared to Income (RGI)
Survey respondents who are employed often earn more than housing, refers to apartments that are subsidized by the
minimum wage but on average are only working 20 hours government so that people living on low income can afford
a week. Added to this precarious nature of employment is them and rent is adjusted so tenants pay about 30 per cent
that most respondents do not have drug or dental benefits.
Median monthly income: $691 Money available per person per day after rent is paid: $5.83
Percentage income spent on rent/mortgage including utilities :
30% 50% 71%
AVERAGE AFFORDABLE RISK OF HOMELESSNESS FOOD BANK CLIENT
Paying no more than 30% of household Spending over 50% of household income The average food bank client pays 71%
income on housing is considered affordable. puts one at severe risk of homelessness. of their household income on housing.
20 | 2012 WHO’S HUNGRY REPORTof their income to live there. The waiting lists are very long to are reduced when they secure subsidized housing units,
access these units: wait times are between 5 and 10 years in which reduces their overall income. Added to this is the fact
Toronto and up to 15 years in Peel region.7 Because the units that many in subsidized housing still have to pay high utility
are scarce and the wait times are so long, many don’t even costs like heat and hydro, which have been taken out of their
bother applying. rent calculations and have to be paid out of the remaining
income. Rapidly rising energy and food costs dig even further
However, living in subsidized housing does not necessarily
into remaining income. Many survey respondents who live
alleviate the need to come to a food bank. Close to one third
in subsidized housing are also more likely to have a disability.
of people coming to food banks are residents of subsidized
Having a disability adds to many of the expenses due to the
housing. In addition, past results have found that the level of
costs associated with medication and other supports needed.
hunger is also about the same between respondents living in
subsidized housing versus those who are not.8
There could be various reasons for this. One may have to
do with how social assistance benefits and rules around
subsidized housing rent calculations interact with each other.
For those receiving social assistance, their overall benefits
WHAT IS THE PRIMARY SOURCE OF INCOME FOR YOUR HOUSEHOLD?
Primary Source of Household Income Percentage Employment (the working poor)
Ontario Works 43% Someone in household employed 25%
Ontario Disability Support Program 25% Median hourly wage $11.23
Job/employment 13% Median hours of work per week 20
Pension 5%
Hourly wage (categories)
Child tax benefits 5%
Less than $10.25 20%
Employment Insurance 2%
$10.25 (current minimum wage) 13%
No income 2% Between $10.25 and $15.00 46%
Other 4% More than $15.00 22%
Cycled off/on Ontario Works two or more times 32%
Benefits
Dental 3%
Drug 1%
Both 16%
Neither 81%
“It’s hard. You’re working [for] a certain amount of money
and then you’re at the food bank.”
~ Survey Respondent
7
Ontario Non Profit Housing Association Waiting Lists Survey, 2011.
8
Who’s Hungry 2011, p.18. 2012 PROFILE OF HUNGER IN THE GTA | 21FACES OF HUNGER
SOLUTIONS TO HUNGER
In order to make sustained progress on poverty reduction and reduce the need for food banks,
people need an income security system that not only allows people to keep a roof over their
heads and put food on the table, but also provides opportunities to move forward.
The face of hunger in the GTA shows us we have a lot of such as the state of the economy, a better income security
work to do to fight hunger and poverty in the GTA. As the system can soften the blow. We are seeing this with families
economy struggles to recover and the cost of food rises, who have children who receive various tax benefits, such
more people need help, and are coming to food banks for as the federal Child Tax Benefit and the provincial Ontario
longer periods of time. Even more disturbing, both adults Child Benefit, to complement their employment and social
and children are going hungry more often than before. assistance income. As a result of these benefits, there are
signs of promise: families with children have decreased
The face of hunger is also changing. Similar to the general
substantially as a portion of welfare caseloads, in spite of
population, people accessing food banks are getting older,
unsteady economic times. Clearly more work needs to be
increasingly not born in Canada and are more educated. All
done on this front, but what has been accomplished in the
are contending with an income security system that doesn’t
last ten years to improve income secuity programs for this
meet their needs. Social assistance on its own doesn’t
age group has made a significant impact.
provide the basics of life, nor does a labour market that
provides less security, fewer full-time opportunities and no As our population and labour market changes, our income
guarantee out of poverty. Food banks or any other food security system has to continue to change with it. We’ve
program can address hunger to a point, but providing food seen positive results with the introdution of the Ontario
on its own will not be able to address the driving forces of Child Benefit back in 2008. A next step to transform our
the issue. income security system could be to provide an additional
benefit to the working age population.
The key driving forces are poverty and lack of income. As
much as this lack of income is caused by uncertainties
22 | 2012 WHO’S HUNGRY REPORTA key issue for people coming to food banks, regardless of
other circumstances, is that a high portion of their income
is spent on housing. A housing benefit could help address
this, and would be a huge step forward in continuing the
transformation of our income security system to meet
the needs of a changing population and economy. Such
a benefit, provided to all low-income households with or
without children, would provide an added top-up to social
assistance or employment income, so they could afford
both rent and food. It would also provide opportunity, by
reducing barriers from welfare to work and not “claw back”,
or reduce employment income for those making
that transition.
Emergency food programs like food banks are important
mainstays for many people who are struggling financially,
and it is important this system exists and continues to
evolve to meet the needs of the people it serves. People
also need an income security system that recognizes their
situation changes, similar to how the state of the economy
changes, and does not trap them in poverty when they
encounter difficult times.
Regardless of their situation, people remain hopeful and
strong. While food banks and other food programs are
doing the best they can to minimize stigma, our income
security system needs to do its part to give people more
support, opportunity and hope.
“Food banks serve a very important function in
helping those who, for whatever reasons, need
that resource. For those with marginal income,
they make a big—often vital—difference.”
~ Survey Respondent
2012 PROFILE OF HUNGER IN THE GTA | 23FACES OF HUNGER
METHODOLOGY
Who’s Hungry 2012: Faces of Hunger reports the number of people served (vs. the number of
individuals) in participating neighbourhood food banks in the Greater Toronto Area (GTA). The
total numbers reported on pages 6 and 10 are for Daily Bread Food Bank member agencies and
regional partners only (regional partners are The Mississauga Food Bank, North York Harvest
Food Bank, York Region Food Network, and Feed the Need in Durham). These total numbers do
not include meal programs or non-Daily Bread affiliated organizations such as St. Vincent de
Paul and the Salvation Army, with the exception of Salvation Army Ajax.
Collecting the Data
Daily Bread Food Bank’s annual survey took place from conducted interviews. The reality surrounding food banks
mid-February until mid-April 2012, in neighbourhood food made random selection of participants difficult. However,
banks across the GTA. Volunteers were trained to conduct volunteers were trained in ways to approach clients to
a 38-question survey in an open-style interview with food address the issue of randomness. Any concerns with
bank clients. Respondents also had the option of filling in the randomness were mitigated by the sample size, ensuring
survey themselves. that the survey was largely representative of all households
using food banks.
Surveys were conducted on location at participating food
banks. Food bank clients were invited to participate in the For ethical purposes, food bank clients were informed that
survey either while waiting to collect or just after they had participation was entirely voluntary, they could withdraw
collected their food. As in previous years, the target number from the survey at any time and participants could skip
of interviews for each food bank was set at three per cent any question within the survey. Additionally, volunteers
of their average monthly client visits. Overall, 49 food banks emphasized that the interview was confidential and clients
participated in the survey, and 107 trained volunteers could not be identified by their responses.
24 | 2012 WHO’S HUNGRY REPORTAnalyzing the Data
About 1835 surveys were conducted for this study;
1778 were sufficiently complete to be used for analysis.
Preparation and analysis of the data occurred in three
stages; data “cleaning”, data entry and data analysis.
First, the data was cleaned, which involved going through
each survey and ensuring the survey was sufficiently
complete for analysis. Incomplete surveys were discarded
and were not considered for further use. The survey
cleaning also ensured the data was sufficiently clear
for the data entry process. Results and analysis were
generated using software called Statistical Package for
Social Sciences v17 (SPSS).
“I had the chance to interview a few new clients at the food bank. For
most, the issue was a recent loss of job. Many had spent a considerable
amount of time unemployed before going to the food bank. Whether
they were living off savings, E.I. or borrowing, people waited to come to
the food bank until it was necessary. This just goes to show how much
stigma there is in getting help from the food bank. None of this was
entirely surprising, but their attitude after they overcame that barrier
was. Many of the people felt empowered by going to the food bank,
by overcoming that barrier and reaching out for help. More than that,
they felt optimistic and hopeful that the future would bring better
things, and that using the food bank would help them bridge into future
opportunities to support themselves. It was an interesting experience,
and I wonder what I might do, or how I might feel in their situation.”
~ Survey Volunteer
2012 PROFILE OF HUNGER IN THE GTA | 25FACES OF HUNGER
ACKNOWLEDGEMENTS
The annual survey of food bank clients is made possible through the contributions of hundreds
who have donated their time and experience.
Foremost, Daily Bread Food Bank thanks the more than Daily Bread thanks the participants of our survey committee,
1800 food bank clients who shared their personal accounts. including Daily Bread Food Bank board member John
We are always grateful that you are willing to share your Stapleton, Andy Mitchell from the Social Assistance in the
time and experiences. You are helping to reveal the faces New Economy Project at the University of Toronto, Joan
of hunger in the GTA and helping us to move towards Stonehocker and Catherine Cook from York Region Food
solutions. The annual survey would be impossible without Network, Daniel Liadsky from North York Harvest Food Bank,
your participation. Hopefully, your stories will inspire others and Harvey Low from the Social Policy Analysis and Research
to join the fight against hunger. Unit at the City of Toronto. We are also grateful for survey
input from Valerie Tarasuk from the Department of Health
Daily Bread thanks the many volunteers who participated in
Sciences at the University of Toronto, Micheylnn Lafleche
conducting the surveys. Your commitment to the successful
from the United Way of Greater Toronto, and Matthew Feaver
completion of this project is greatly appreciated. We would
from Campbell Company of Canada.
also like to thank June Larkin and Stanley Doyle-Wood from
the Equity Studies program at the University of Toronto for Daily Bread extends its thanks to regional survey partners,
including volunteering in the survey as part of the structured including York Region Food Network, North York Harvest
component of their curriculum. Food Bank, The Mississauga Food Bank, and Feed the Need
in Durham for their contributions.
Last but not least, a sincere thank-you to the following food banks for their support of Who’s Hungry, and their
participation in the annual survey of food bank clients:
Agincourt Community Services Fort York CAC SDA Oshawa
Allan Gardens Food Bank Georgina Community Food Pantry Seva Food Bank
Aurora Food Pantry Glen Rhodes United Church Simcoe Hall Settlement House
Bathurst-Finch Community Food Bank Haven on the Queensway Sorauren Food Bank
Calvary Baptist Church Lansing United Church St. Mary’s Food Bank Coopers
Central Etobicoke Economic Support Lawrence Heights Community Food Bank St. Mary’s Food Bank Dundas
Christ Church St. James Food Pantry Malvern Healthy Community Cupboard St. Ninian’s Anglican Church
Churches by the Bluffs Markham Food Bank Syme-Woolner Neighbourhood and Family
Churches on the Hill New Toronto Street Food Bank Centre
Community Alliance Food Bank Newmarket Food Pantry The Lighthouse Centre
Community Share Food Bank OASIS Dufferin Community Centre The Stop Community Food Centre
Compass Market Food Bank Our Saviour Lutheran Church Weston Area Emergency Support
Eastview Neighbourhood Community Centre Pape Food Bank Whitchurch-Stouffville Food Bank
Eden Food Bank Battleford PWA Toronto Woodbine Baptist Church
Eden Food Bank Unity Richmond Hill Community Food Bank YMCA O’Connor Focus Community Food Bank
Fareshare Oakville Scarborough Centre for Healthy Communities Yonge Street Mission
Flemingdon Park Ministry Scott Mission
26 | 2012 WHO’S HUNGRY REPORT“I had thought that only a certain type of person would end up using the
food bank. However the individuals who use the food bank are as reflective
of Toronto’s diversity as any other group of people.”
~ Survey Volunteer
Illustrations by Alyssa Andres
2012 PROFILE OF HUNGER IN THE GTA | 27Who’s Hungry 2012 was “I have never had to worry about my access to food. Most of
the time I only ever had to worry about when I wanted to eat,
written by Richard Matern
or what I was going to make. Interacting with people and
and Susie Kim, and designed
understanding that hunger and access to food are daily issues
by Anita Sekharan and for them was eye opening. I cannot fully imagine what that
Jessica Ward. Special struggle would be like. It is astonishing to me how tenuous so
thanks goes to Sarah many people’s grasp on the basic necessities of life are.”
~ Survey Volunteer
Anderson, Acting Director
of Communications, John “When it was just myself—I would do without. But when
Stapleton, board member, children are with me, then I will use this facility (food bank).”
and Catherine Leek of ~ Survey Respondent
Green Onion Publishing for
“In (another country) I was completing my PhD in chemistry.
their creative direction and When I came to Canada my qualifications were not recognized
editorial assistance. and I could not get work in my field. This caused much
disappointment and frustration and depression.”
Illustrations provided by Alyssa Andres
www.alyssaandres.com ~ Survey Respondent
“Two years ago $100 could buy food for one month. Now $100
only lasts a week. The increase in the cost of food has gone up
way faster than the money to survive on. “
~ Survey Respondent
“I was always amazed that even when people had almost no
money, they would always make sure their children had what
they needed. Many parents said they would routinely skip
meals in order to make sure their children had food they liked
and enough of it.”
~ Survey Volunteer
“I do not feel comfortable asking. I ask for my kids—if it were
just me I would not come.”
~ Survey Respondent
For more information or to make a
donation, please contact:
The printing of Who’s Hungry has been
416.203.0050 / info@dailybread.ca generously sponsored by:
www.dailybread.ca
Daily Bread is a registered charitable organization
Registered Charity Number: 11888 1549 RR0001You can also read