CITY OF HAGERSTOWN COMMUNITY SURVEY FINDINGS 2021 - Thomas S. Alexander, Ph.D. 1 - Hagerstown, MD
←
→
Page content transcription
If your browser does not render page correctly, please read the page content below
2021

   CITY OF HAGERSTOWN

COMMUNITY SURVEY FINDINGS

                   Thomas S. Alexander, Ph.D.

                                           1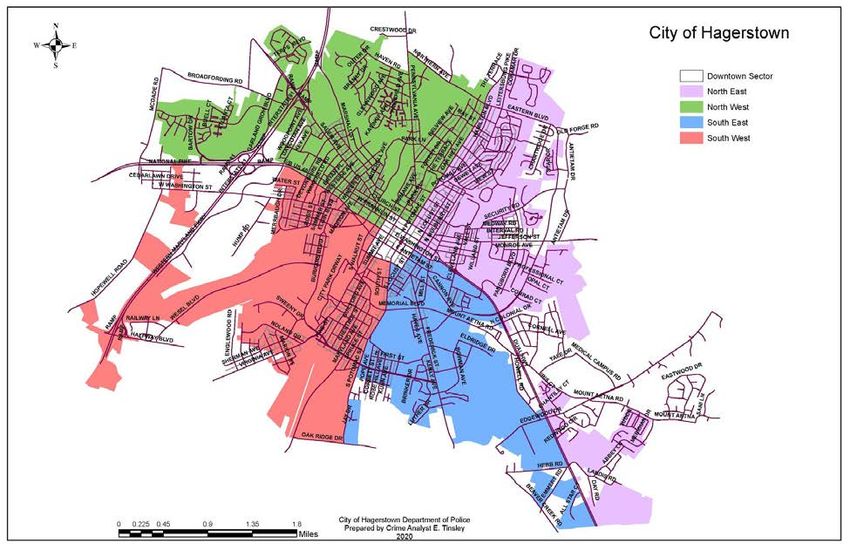
Table of Contents

I.     Executive Summary

II.    Background Information and Methodology

III.   Survey Question Results

IV.    Demographic Question Responses

V.     Appendix (Subjective Responses)

VI.    SPSS OUTPUT tables

                                                       2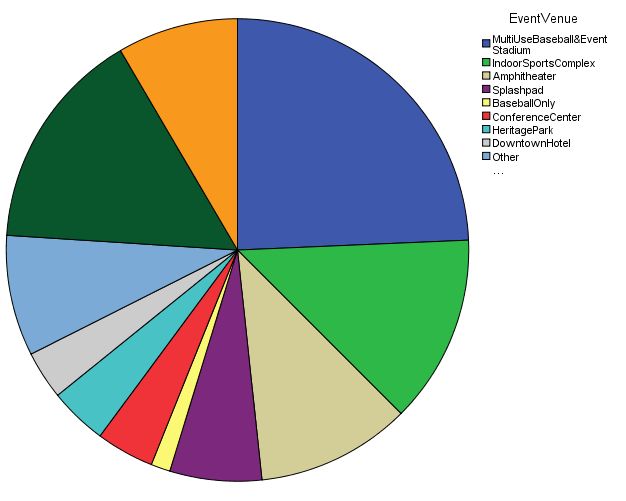
Executive Summary

In November of 2020, a newly elected Mayor and City Council took the oath of office for the City of
Hagerstown, MD. A Community Survey was developed for distribution to citizens in order to develop a
vision for the new administration to operate under. The survey posed questions on Economic
Development, City Services and Infrastructure, as well as Goals and Objectives. The survey was mailed
out on January 6, 2021 and was to be returned by January 31st. The data included in this report included
surveys returned by March 1st.

                                              Methodology

The survey was aimed at residents of the city of Hagerstown. Businesses were excluded for this specific
study. The area to be surveyed excluded the downtown area which is primarily businesses. The sample
area was divided into four quadrants. These quadrants were based on a patrol beat map used by the police
department. The map (Figure 1) divides the city into a Downtown area, a Northwest area, Northeast area,
Southwest area, and a Southeast area. As stated, the Downtown area was excluded for this study.

                                        Figure 1 Police Beat Map

Since the locations that were to be surveyed were residents of the city of Hagerstown, the assistance of
the Planning and Code Administration was requested. This department had the capability of providing a
list of residences from the beat areas.

                                                                                                           3
The addresses were pulled from tax assessment information. Once that information was acquired,
properties were eliminated that were identified as commercial either through the State Department of
Assessments and Taxation (SDAT) or in utilities. Properties were eliminated where they were registered
as vacant with the City. After receiving the list, a proportionate sample was drawn. The selection process
allowed for a proportionate random sample to be drawn from each of the four areas.
The statistical constraints for selection of the sample size were a 95% confidence level, a 5% margin of
error, and the population proportion of 50%,
The total combined population for all four survey areas was 12,334. Once the areas were broken down
into the four areas, the population from which the random selection would occur was SW- 2529, SE-
1562, NW-4512, and NE-3731.
1347 surveys were mailed out. The sample was chosen by proportionate random sampling based on the
four areas of Hagerstown as defined in Figure 1 (SW, SE, NW, and NE). Based on the random sampling,
the following were the sample numbers mailed to those 4 areas: SW-334, SE-309, NW-355, and NE- 349.
296 surveys were returned. This is a 22% return rate. A survey response rate of 50% is considered
excellent however survey response rates from 5% to 30% are more typical.
The data reported in this publication comes from those surveys which were returned. When examining
demographic data, the reader should be cautioned against drawing conclusions based on the demographic
data regarding its representativeness of specific factors since data was not available for the sample which
was surveyed for comparison. This data reflects those who actually returned their surveys.
4SURVEY QUESTION RESPONSES
Economic Development:
Question #17
How often do you shop or eat at locally owned restaurant or business (non-chain restaurant)?
o Never- 15 (5.1%)
o Less than once a Month- 84 (28.4%)
o More than once a Month- 107 (36.1%)
o Weekly- 89 (30.1%)
o No Response/Missing- 1 (0.3%)
Question #18
Where do you prefer to shop for food?
o Farmers Markets- 47 (15.9%)
o Chain Grocery Stores- 216 (73%)
o Online Grocery Delivery Services- 16 (5.4%)
o Local fruit/vegetable vendors- 9 (3%)
o Other- 8 (2.7%)
Question #19
Where do you prefer to shop retail?
o Locally owned small businesses- 77 (26%)
o Valley Mall – 60 (20.3%)
o Outlets- 28 (9.5%)
o Amazon/Online- 89 (30.1%)
o Other 37 (12.5%)
o No Response/Missing- 5 (1.7%)
Question #20
If there are people in your household that would be interested in job training, what type of new skills
would interest you?
o ___________________________________________________
o There is no one interested in this household
NO
245 Not Interested
1 Fully disabled
1 Retired
18 No Responses
YES responses
Accounting 2
Anything 1
Arts & Entertainment 1
Basic Skills 1
CDL 1
Computer/IT 6
5Dentist/Medical 2
Electrical 2
Exercise Training 1
Machinist 1
Manufacturing 1
Medical Billing 1
Plumbing 1
Small Business 3
Solar Energy 1
Teaching 1
Welding 2
City Services/Infrastructure:
Question #21
How safe do you feel in your neighborhood?
o Safe- 138 (46.6%)
o Somewhat Safe- 111 (37.5%)
o Somewhat Unsafe- 29 (9.8%)
o Unsafe- 18 (6.1%)
Figure 2: How safe in your neighborhood?
6Question #22
What specific safety measure would you like to see implemented in your neighborhood? (ranked)
___________________________________________________________________________
No Response 100
Police Presence or more Police 69
Speed Control 17
Better Lighting 17
Cameras and surveillance 15
Speed Bumps 9
Traffic Control 7
None 6
Drug Dealing 5
Watch Groups 5
It is Safe 4
Streets need fixed 4
Not Sure 3
Remove the Homeless 3
Panhandlers 2
Anonymous Reporting 1
Can’t say 1
Allow Open Carry 1
Anything to Help 1
Better Sidewalks 1
Parking Enforcement 1
Curfew 1
No Opinion 1
No Safe Place 1
Crime Prevention 1
Wider Streets 1
Keep dogs on a leash 1
Noisy motors 1
Eliminate rentals 1
Better screening for housing 1
Increase your budget 1
Know your neighbors 1
Question #23
Do you feel that there is a park close to your home?
o Yes- 239 (80.7%)
o No- 43 (14.5%)
o No Response/Missing- 14 (4.7%)
Question #24
Would you walk to the closest park to your home?
o Yes- 181 (61.1%)
o No- 98 (33.1%)
o No Response/Missing- 17 (5.7%)
7Question #25
Are you proud of your neighborhood?
o Yes why?- 184 (62.2%)
______________________________________________________________________
o No- 83 (28%) if no, what could the City do to help change that?
______________________________________________________________________
o No Response/Missing- 29 (9.8%)
See Appendix A for specific comments
Question #26
What, if any, improvements would you offer to create a more positive community in your small town?
o _____________________________________________________________________
o I do not think any improvements are necessary
See Appendix B for specific comments
Question #27
If you could change the community without challenge, what would you change?
o ______________________________________________________________________
o I would not make any changes
See Appendix C for specific comments
Question #28
Would you be interested in a monthly billing for water/sewer that may be averaged between quarterly
readings?
o Yes- 89 (30%)
o No- 180 (61%)
o Not Applicable- 27 (9%)
Goals and Objectives
Question #29
What is Hagerstown’s biggest strength? Pick up to 3
o Parks and Recreation 148
o Access to Restaurants 125
o Affordability of Housing 84
o Walkability 72
o Safety/Security 54
o Employment Opportunities 43
o Availability of Public Art 33
o Other 30
o Types of Housing 4
8Question #30
What do you see as Hagerstown’s biggest issue? Pick up to 3.
o Drug Addiction 218
o Blighted/Vacant Buildings 171
o Homelessness 153
o Safety/Security 99
o Cost of housing/rent- 53
o Employment Opportunities- 52
o Quality of housing 33
o Other 13
Question #31
How would you like to receive updates and event notifications from the City?
o Facebook 89
o Newspaper- 78
o Website- 72
o Other 56
Responses for Other were: 13 USPS. 32 email, 4 text, 1 city gov., 1 nextdoor.com, 2 app, 1 radio, 2 not
specified
o Television- 30
o I would not like to receive notifications from the City in any manner- 27
o No Response- 13
o Instagram- 9
Question #32
What large scale event venue would you like to have in Hagerstown?
This group of data was gathered by taking a respondent’s first choice. Since the question asked for venue
and not venues, one primary response appeared to be desired.
o Multiuse Baseball & Events Stadium 72
o None 46
o Indoor Sports Complex 39
o Amphitheater 32
o Other 25
o No Response/Missing 25
o Splashpad 19
o Conference Center 12
o Heritage Park 12
o Downtown Hotel 10
o Baseball only stadium 4
This group of data included every response even if a person gave multiple responses.
o Multiuse Baseball & Events Stadium 83
o Indoor Sports Complex 51
o Amphitheater 46
o Splashpad 27
o Conference Center 23
o Heritage Park 22
9o Downtown Hotel 19
o Baseball only stadium 10
o Other 28
These are the actual responses from those respondents who wrote something in for “Other”
-Quit spending on stadium study, won’t work downtown
-More things for kids
-casinos
-wind down Fridays at MD Theater
-Ag Center
-Downtown grocer
-indoor tennis courts
-Outdoor music at Fairgrounds
-Go karts
-Full-time organic store
-Use current stadium for music and arts
-Downtown grocery, hardware, variety stores
-Civic center
-Community center
-Concerts
-Casinos
-Skate park
-Move Board of Education into building downtown
-A place for all age groups
-Concerts
-BMX track
-More things for kids
-Downtown small business revitalization
-Help people
-Casino
-Antique or flea market
-Family center
-Downtown Farmer’s Market
o None 52
Respondent comments after indicating none for those who left a comment.
-stop talking about a baseball stadium, that ship sunk
-not a basis for growth
-invest in the drug issues
-are much bigger issues
-could be better spent cleaning up the city
-baseball out of the city
o No Response/Missing 28
10Figure 3: Event Venue Choices
Question #33
What type of community events would you like to see? (Ranked)
o Music Events 161
o Arts Festivals 102
o Cultural Celebration Festivals 92
o Neighborhood Block Parties 82
o Car Shows 55
o Other 18
o None 15
o No Response 20
The 18 other Responses when listed were vendor events, bike week, track & field events, BMX races,
rock & roll concerts, street fairs, low cost events, baseball, blues fest, downtown events, kids events,
family events.
Question #34
What family friendly activities would you like to see available in Hagerstown?
___________________________________________________________________
See Appendix D for specific comments
11Question #35
If there are people in your household that would be interested in higher education or job training, what is
the main obstacle that exists to prevent that?
o Money 89
o Transportation 8
o Child care 1
o Do not have a GED 4
o Time away from work 14
o Other 12
o There is no one interested in our household 161
o No Response/Missing 37
Question #36
If you have children residing with you, what types of activities do you or your children wish were
available to them in Hagerstown?
o ___________________________________________________________________
o I have no children residing at my household
See Appendix E for specific comments.
Question #37
Is there anything that keeps or prevents you from participating in community engagement?
o Yes if yes, what? ____________________________________________________
o Nothing keeps me from participating
Yes 85 responses:
These responses were combined where applicable and summarized below
Disabled
Diabetic
Crowds
Covid
Age, vision, health, Senior citizen
Working, too busy
The neighborhood
Short on Time
Safety/Feel unsafe/Safety downtown
Long drive
Wife has the car
Too far to walk
Traffic
Trashy people
Violence
The Homeless
Poor communication/notification/Public relations
Political Division
Drug problems
12Nothing keeps me from participating 11
No Response/Missing 36
13II. DEMOGRAPHIC RESPONSES
Question #1
How long you have lived in Hagerstown?
o Less than 5 years 31
o 5-10 years 38
o 11-20 years 54
o More than 20 years 171
Question #2
Do you work in the City?
o Yes 89
o No 201
o No Response/Missing 6
Figure 4: Work in the City?
Question #3
If your answer to Question 2 was no, which best describes your place of employment? If you answered
yes to Question 2, skip to Question 4.
o Outside the City of Hagerstown but still in Washington County 32
o Outside Washington County but in Maryland 36
o Outside of the State of Maryland 18
o Do Not Work 108
o N/A, means Yes to Question 2 90
o No Response/Missing 12
14Question #4
Which of these describes your personal income last year (2019)?
o $0 1
o $1 to $9 999 2
o $10 000 to $24 999 40
o $25 000 to 49 999 80
o $50 000 to 74 999 57
o $75 000 to 99 999 33
o $100 000 to 149 999 35
o $150 000 and greater 14
o Refused 25
o No Response/Missing 9
Question #5
What is your age?
o Under 25 5
o 25 to 34 15
o 35 to 44 31
o 45 to 54 42
o 55 to 64 75
o 65+ 124
o Refused 3
o No Response/Missing 1
Question #6
Which of the following best describes your race?
o African American/Black 19
o American Indian or Alaska Native 11
o Asian, Hawaiian or Other Pacific Islander 4
o White 249
o Other: _______________ 9
o No Response/Missing 4
Question #7
Are you or other members of your household of Hispanic or Latino ancestry?
o Yes 14
o No 278
o No Response/Missing 4
Question #8
How do you identify yourself?
o Male 129
o Female 154
o Other (please specify): 0
o Prefer not to answer 5
o No Response/Missing 8
15Question #9
What is your marital status?
o Married 142
o Divorced 47
o Separated 4
o Widowed 45
o Single 48
o No Response/Missing 10
Question #10
What amount of your total household income is spent on housing expenses (mortgage or rent) including
utilities?
o Less than 15% 57
o 15% - 19.9% 37
o 20% - 29.9% 60
o 30% - 39.9% 49
o 40% - 49.9% 28
o More than 50% 41
o No Response/Missing 24
Question #11
Do you own or rent your home?
o Own 251
o Rent 36
o No Response/Missing 9
Figure 5: Own or Rent?
16Question #12
How many people live with you at your current residence? ________________________________
0 people 49
1 person 88
2 people 78
3 people 37
4 people 15
5 people 9
6 people 2
7 people 3
10 people 1
No Response/Missing 14
Question #13
What is the highest degree or level of education you have completed?
o Some High School 15
o High School 121
o Bachelor’s Degree 65
o Master’s Degree 40
o Ph.D. or higher 6
o Trade School 23
o Prefer not to answer 11
o No Response/Missing 15
Question #14
What type of dwelling do you live in?
o Single-family detached 177
o ½ double, townhouse/rowhouse 84
o Apartment 11
o Other 16
o No Response/Missing 8
Question #15
What would be your preferred housing type?
o Single-family detached 230
o ½ double, townhouse/rowhouse 29
o Apartment 11
o Other 16
o No Response/Missing 10
17APPENDIX A
Question #25
Are you proud of your neighborhood?
Yes why?
No if no, what could the City do to help change that?
Yes
- Used to be but it has changed, lower class people have moved in
-Northgate
-Diverse, safe, and clean
-Clean and friendly
-Organized
-3 block radius all are home owners
-Nice houses, diverse friendly neighborhood
-Cute homes, mostly well maintained and safe
-Character and cleanliness
-Historic and clean
-Everyone shows respect and is nice
-Very safe, very clean, very friendly
-Neighbors are friendly, clean, and quiet
-Friendly environment
-Well maintained and good neighbors
-Quiet and nice neighbors
-Kind neighbors, homes taken care of by most
-Clean and well maintained
-Where I grew up but it is getting too congested
-Close to the park and Hartle’s
-Neighbors take pride in how houses and lawns look
-Safe and neighborhood watch
-Very nice, quiet, friendly
-Nice neighbors, neatly kept homes
-Old condo development, still attractive
-Because
-People take pride in their property, safety
-Clean
-Properties are kept up
-Quiet neighborhood and people are nice
-Quiet, good neighborhood, property pride and care-Lots of families, close to shopping, pretty safe
-Quiet, peaceful neighborhood
-Is an old neighborhood in this part of town, we know each other and watch out for each other
-North end is generally a better neighborhood; walkable
-Diverse, neat and clean
-The houses are all very different
-Safety
-Parks are beautiful and nice to play in
-Nice neighbors, well mannered
-Relatively clean, home to a 100% vegan restaurant as of 2020
-Crime seems low, a convenient location
18-Friendly people
-Most residents care
-Neighbors
-It is in the middle of the city but is very quiet
-Beautiful and well-maintained
-Friendly but not overly
-Quiet and kind
-Obvious pride of ownership
-Somewhat
-Bester Community of Hope has done so much!
-Not as much as I used to be. Passers-by are not friendly, drive too fast
-Gated community
-Diversity
-Somewhat
-People are very friendly
-Good HOA
-Great neighbors, people have pride in their houses
-Friendly, well kept (mostly)
-I feel safe here
-Friendly neighbors
-Neighbors keep up their properties
-We can play in the street if we want to
-Safe, friendly, attractive
-Friendly neighbors, good lighting
-Gated community
-Clean
-Not much trash, very little crime
-The people are wonderful
-It’s a 55 or older community
-Neighbors are friendly
-Historic homes with great yards
-Nice, helpful neighbors
-Clean and peaceful
-It’s a friendly neighborhood. Folks tend to keep their property up well
-There are a growing number of owner occupants on the street
-Nice neighbors
-Historic district and great neighbors
-It’s clean and safe
-It’s quiet and family focused
-Homeowner maintains properties more than rental properties
-Nice neighbors
-Nice people
-Immediate vicinity neighbors have lived here a long time. We are close and help each other
-The Church is making it better
-It is well maintained clean and safe
-Clean, neighbors friendly
- Somewhat it’s better than most Hagerstown city locations
-Architecture and history
-Great next door neighbors
-I think the South end is really cute. I love the architecture of all the houses
-Only 4 houses on the block
19-Know all my neighbors many years
-The neighbors look out for one another
-Nice neighborhood
-Quiet, clean, and orderly
-Nice architecture (older), trees, people maintain their properties
-Everyone is friendly and looks out for each other
-Clean/Quiet
-Good neighbors
-Quiet except for trains
-It is a nice, quiet, clean community
-While there has been great changes since moving here in 1989, I still like my neighborhood. It’s what
you make it.
-Clean, quiet, convenient to resources
-Good neighbor
-Because it’s a “community” where everyone works toward on goal
-Quiet
-Good neighbors and relatives
-Houses kept neat
-It is safe
-Clean and safe
-People keep yards and homes in good shape
-Clean and brick homes
-Few criminals
-It is quiet, neat, and clean
-Quiet family environments
-Safe
-Clean and attractive
-They are all very nice
-Location/safety
-It is safe, clean, and friendly
-Our HOA has/is taking good care of it
-Not bad, stay ourself
-Proud of home and neighbors/either side
-Neighbors take pride in homes
-Some don’t but most take pride in their property and community
-Quiet
-Because it’s safe
-We all try to keep our neighborhoods clean
-Except for 1 house on the block that’s an eyesore. Never cuts grass, trash everywhere!!
-Quiet area besides speeders
-Everyone kinda minds their own business
-Good friends and good neighbors
-Gateway crossing, HUD HOPE VI
-Quiet hidden gem, but someone has taken belongings out of our vehicle
-Homes are occupied and maintenance is good
-It’s ok, fairly quiet and homes are appealable
-It is nice and it is kept well
-Well kept, friendly
-Owners help to keep the area clean
-Good neighbors
-Well kept, friendly for the most part
20-It is quiet
-Neighbors are respectable
-Owners take care of their homes/yards. People are willing to come together to solve problems and
support causes
-Somewhat most are good, couple renters for section 8 always drug dealers move in
-Clean and friendly neighbors
-Clean and safe good neighbors
-Well kept, nice and friendly neighbors
-The people try to keep it cleaned up of trash
-Quiet when no school (between buses and large trucks), good neighbors
-Houses generally well kept
No
-Indifferent
-A group home has moved across the street and there’s always a drama
-Always to keep our trash and recycle bins from being out front
-Effective police patrols and enforcement
-Mostly all senior citizens
-Unfriendly neighbors, one wants to kill me because I have cats even though they are confined in my
house
-Trash thrown around, noise, fireworks and dogs barking at all hours
-The grassy space between View St and Valleybrook looks like crap
-Get rid of the drug dealers
-Maintain strict control of renters and rental property
-People think it is a trash area
-No opinion right now, just moved here
-Streets are dirty, cluttered with junk and have a lot of ruts
-Code enforcement and police response
-Enforce trash regulations with management companies. Tenants place trash on curbs all week long.
-Remove the drug dealers
-Speeding on Langley Drive is extreme
-Challenges with vehicle tampering and loud exhausts on vehicles
-Code enforcement not enforced
-Used to be proud, need to handle the crime
-There is a lot of multi-family and low income housing. It is hard to make friends.
-Would say not proud but there are areas that could use improvement but those areas may not have
individuals capable of making those improvements
-Need to clean streets more often, enforce individual trash clean up at private houses, rundown abandoned
buildings
-A lot needs to be changed
-We can’t let our kids play freely due to rowdiness and bullying in the parks
-Renovate vacant buildings
-Elizabeth St, the trash on the street, trash cans setting out front which could be put in back. The vacant
houses that are boarded up that has been empty for years
-Clean up drug houses
-Too many rental houses with activity that wasn’t there 20 years ago
-My street is a major cut through road
-City could purchase lot at corner of S. Mulberry and Lee St for small park
-Grants to owners to upgrade exteriors
21-Provide better homes for the homeless
-Follow-up on police calls for b&e or theft reports
-Lots of rentals and landlord don’t care how it looks, trash cans on sidewalk, lots of foot traffic making
litter
-Trash bags and cans left sitting on sidewalks all week, Enforce the codes in place!
-Organize live music, downtown shopping malls, parks with the performance of comedians, amateur
cycling, prizes for the first 10 places, outdoor art exhibits, organize the selection of the most beautiful girl
in Hagerstown
-More park space, green space
-Our pool has been closed for years, area is covered in litter
-City is worried about looks (cleaning sidewalks, overhanging trees) but no one addresses homeless/drugs
in alleys
-Cleaner streets, more lighting
-Parking enforcement, garbage, parking on lawn
-Do something with homeless and drugs
-Figure out how to encourage people to keep up/clean up their properties and alleyways
-Equally issue and enforce citations for properties that are in poor condition. Also enforce policy to force
residents to keep their property free from trash
-Activities, programs, etc. to encourage neighborhood interaction
-Removal of the homeless and panhandlers, went downhill over the last 5 years, speed camera or bump
-Force outside maintenance
-More presence, enforcement of rules, traffic safety
-Enforce neighbors to keep house and yard up to date, mow their grass, fix their fences and sidewalk
obstructions
-Keep sidewalks clean
-Our neighbors look terrible. He hauls junk and a camper is out front
-Better lighting
-Cite homeowners for homes in disrepair
-Fix sidewalks, noise control, following ordinances
-Clean up public housing
-Help with violence, appearance, and random violence
-This is not the town I was born and raised in. Too much crime that no one can control
-Make people clean up their property including Section 8 and welfare after all….they don’t work, they
have nothing but time
-A lot of drug use, would like to see less
-Get the beggars off the corners
-Need more home ownership
-Would rather move in the country but will never get what I paid for my house
-Fiber optic connection, sidewalks not to code, HOA amenities not available, food/community commerce
area, food and dessert
-Too much trash on sidewalks, street (pick up) catch speeding motorists
-Do something about all the empty homes
-A lot of rentals have went downhill
We are an HOA community but they do not enforce the bylaws for home ownership (E.g., mold on
homes, mailboxes falling over, and grass being tall…)
-Make it safe, too much transient traffic
-Clean-up/beautification projects, building restoration. More community activities
-Stricter controls on rental properties, littering laws
-My neighbors all 25 cars all up and down the street
-Not sure
-Too many drug dealers and drug addicts
22-North end has gone downhill- thefts and vagrants
-Rentals and people they draw
-Trash, rundown rentals, empty houses, illegal activity
-It’s the people who live here
-City cannot do anything as I am out of the city limits
-Don’t know how to change trashy people
-It’s filthy, people are constantly dumping items garbage in our yard
-First get rid of all the abandoned houses, neighbors throw trash out front of their house
No Response or just checked Yes or No
67
23APPENDIX B
Question #26
What, if any improvements would you offer to create a more positive community in your small
town?
________
I do not think any improvements are necessary?
Response
-More activities
-More cleanup of trash
-Hagerstown County Fair
-Lots of kids on street, maybe speed bumps for speeders
-We have support from city for block parties and community events, police and fire are helpful
-I would like to see downtown developed more
-More attention to roads during winter snow
-A revitalized downtown Housing for the homeless or some kind of shelter
-Get rid of the drug users and drug dealers
-Speed camera on this street
-More community involvement
-More public events that are low cost
-Keep the street clean
-Outdoor dining
-Community yard sales and summer gatherings
-Social gatherings when permitted
-There is nothing you can do to change the neighborhood
-For people to respect others and clean up after themselves
-Have no idea
-Public water/sewer/good internet
-Remove crumbly city center area
-More places for kids to go so they are not hanging out on the streets
-Small neighborhood events
-Utilize old YMCA for shelter for the homeless year around
-Less drug dealing
24-Pay it forward mentality
-Less drug trafficking
-More structured activities for kids and seniors
-Get rid of homeless/druggies/littering
-More public events at spaces
-Help the poor
-Clean up the downtown, trash should not be on the curb 24/7
-Honestly unsure of what would help
-More neighborhood involvement
-More job training
-Litter pick up
-Grants for people to own their home
-Get the beggers of the corners
-Keep neighborhood clean
-Cameras
-Homes kept up to code
-Online community paper
-More downtown economic development
-Persons should be next to their phones and answer them
-I wish we were like Frederick, but we will never be like them
-Do something about the house that was burnt
-Less rentals and more homeowners
-Less homeless people
-Speeding on our street is a problem
-Trash clean up
-More reasons to come downtown and spend time there
-Improve safety in the city
-Fewer people doing and dealing drugs
-Activity classes for those ages 12-21
-Clean it up, entice people to move here
-More ethnic involvement
25-More vital businesses downtown
-Do something about the homeless and loitering downtown
-Togetherness events, like block parties
-Making downtown safer
-Get rid of the drug addicts
-Back to reward system
-Involvement in events
-Arrest the drug dealers the first time instead of trying to build to a case against the kingpin
-Need businesses downtown because it feels unsafe
-Safer streets
-More lights
-Clean up downtown
-Decorative infrastructure
-Put for things for kids to do
-Spread the wealth not only on the first block of South Potomac St. but the first block each way
-Persons released from prison should be sent home
-City to rehabilitate vacant properties
-Unkempt properties are scary and unsafe
-Tear down the buildings that are falling apart
-More parks and green spaces
-Poor sidewalk conditions outside of the downtown area
-Fixing up downtown area to look like Frederick
-Keeping grass cut
-More businesses to improve tax base
-The safety of the people
-Antietam has a monopoly, give us more affordable options
-Have a place for the homeless
-Infrastructure improvements
-More open shops downtown
-Clean it up
-Better support of downtown merchants
26-Get rid of slum apartment’s downtown
-Hagerstown has a huge problem with poverty and housing, more education investment
-Volunteer to pick up trash along the street
-Improve quality of life for minorities
-Tear down most of downtown Hagerstown and just start over
-Police and City council outreach meetings
-Fill the vacant buildings
-Just keeping it cleaner
-Programs for teens and kids with positive interaction
-Better public transportation
-Do not know
-Keep out drugs
-Move the prison
-Repair the rundown structures
-Grocery market that is within a safe walking distance
-Bottle recycling and glass recycling
-Would like some kind of drainage in the streets
-A trash bin on streets
-Less development for reduced traffic
-More community events
-Make it safe and provide a sense of safety in the downtown area
-Get the homeless and panhandlers out
-More local and family oriented activities
-A better downtown and farmers market
-More non-drinking establishments such as small cafes
-More inclusions in cultural events
-Hold section 8 landlords more accountable
-Landlords should make people keep their places clean and neat
-Do more about loitering
-Have inspector check the areas
-Positive signs through town such as “smile” “be kind” or “have a nice day”
27-Do away with the drug dealers and thieves downtown
-I have a backyard BBQ
-Make downtown more like Frederick
-Housing for the homeless
-Clean up downtown
-More family centered events
-Paint street striping and curbs
-Remove the guy with 8 cars that blasts his music extremely
-Open communication with police and at risks communities
-Police explain murders and motives
-Make downtown city more vibrant
-Cleaner streets and less vacant properties
-Don’t need drug rehab at the end of the street
-Police on foot patrols
-Window coverings and better trash bins
-Get residential trash cans off the sidewalks and vending machines off of sidewalks
-More parks and more lighting
-Get a handle on the homeless
-More community and local activities
-Keep streets cleaner
-Have timely snow removal
-Parole gets sent back to where they came from
-Downtown shopping and movie theater
-Help individuals with lawn care and bulk item removal
-A farmers market or concert place
-A more successful arts district
-Get rid of the “old boy system”
-Consequences for breaking the law
-More sidewalks and places to walk
-Tear down all these dumpy buildings
-Eco friendly efforts
28-Address speeding
-A much better stadium facility would help
-More community meetings
-Mask enforcement in retail stores
-More police and better judges for punishments
-Block parties
-Wider easier walkways and better trash collection
-More police
-Get vagrants off the streets and away from downtown , remove the beggers
-Make a walking trail more
-A better kind of police force, we have too many city employees that are bureaucrats
-Get section 8 out of downtown
-Enforce the codes downtown
-Trash can bins on the streets to get the trash off the of streets
-Police presence
-Trash needs cleaned up, more patrol on streets due to high speed in 25mph zones
-More focus on improving education and outreach programs, less money downtown
-Open the pool, clean up the outside garbage
-More jobs, parks, higher education programs
-Allow for more small shops to be open places other than downtown, in the communities
-More involvement in all areas of Hagerstown
-Services to actually deal with mental health and drug addiction
-Highlight positive people and businesses to do great
-Do something with the homeless and the drugs
-Each community to have a recycling dumpster
-Real internet access, whole food and trader joes
-Fewer rental units where property owners live, they do not keep up with their houses
-Downtown shops and restaurants
-Fill store fronts downtown
29I DO NOT THINK ANY IMPROVEMENTS ARE NECESSARY
37
No Response or Missing
87
30APPENDIX C
Question #27
If you could change the community without challenge, what would you change?
________
Or I would not make any changes
Response
-Community Relations
-Dramatic wholesale improvements in the community would result in more homeowner
-More police presence
-All the homeless
-No more at large elections for the city
-Better elections
-The panhandlers and opioid crisis
-Cameras
-Better policing as well as better punishment for minors
-More community outreach programs
-Double taxes and little service. County and City should merge
-More home ownership, take cars off the properties
-Push out the homeless and the drugs like heroin
-Pick up after your dog
-Cleaning up Hagerstown and making it a great town to live in
-For a community to feel safe and feel proud, more community bases activities
-Improve public transportation
-Stop the beggers on every street corner
-Community clean up
-More festivals and farmers markets
-A downtown like Frederick
-More anti-drug efforts
-People coming together and looking out for each other
-More police officers to reduce the crime rate
-Long term center city business presence
31-Keep city golf courses
-Combine city and county taxes
-Less housing and less handouts
-Increase education and standards of living
-Created integrated positive homeless housing, have a major investor come in
-Cleaner streets
- I don’t feel comfortable walking downtown, it feels deserted
-Seniors should not have to pay taxes
-Homeless and drug recovery
-Wasteful spending
-More businesses downtown
-Too many trucks by our house
-Get better people in section 8 rentals
-Community gatherings
-Help get the homeless people off the streets
-Stop the speeders and bike riders racing up and down the street and Dual Highway
-Have programs for drug users to get clean longer than 28 days
-Constant homeless people walking around and pushing shopping carts
-More trash receptacles around town
-Bring in more small restaurants
-Better internet-More homeowners and less renters
-People to be more respectful of others
-Clean the people out who abuse the government
-Remove drugs
-Not possible, there will always be a challenge
-Neighbors put trash cans away
-Less prejudice against the homeless and those released from incarceration
-Litter pick up and community reform
-More information about city events, programs and new projects
-Have more cable companies
-Force the ex-cons to leave the area
32-Put something in the old sears already
-No section 8 housing
-Homelessness
-Be totally intolerant of drug activity
-Host a community clean up, some want to tear up my backyard using it as an impound lot
-Too much crime
-Outdoor dining
-Have the Walmart clean up its parking lot, and the homeless camps in the wooded area near
Sams
-Influx of money to encourage city upgrades
-More community activities and things going on, more public trash cans and pick up
-The thieves need to go
-People have a bad attitude towards town, I would change that
-Improve downtown environment
-Little late for that
-The chief of police
-Encourage additional development
-Lower real estate taxes
-Keep it safe
-Better information/News vehicles
-Fines for not maintaining your property
-Patrol more
-You can’t change people’s hearts
-Enforce existing drug laws
-Help the homeless and reduce the drug addiction, also stop the panhandling
-Downtown could be better
-Its attitude and less visible trash
-Need more parking spaces
33-That the community would be more open to talk about how bad the drug problem is
-More trash pickup in low income areas
-More police presence
-Get rid of the people who are homeless by choice
-Prevention for addiction, child abuse/neglect, homelessness and unemployment
-Make sure people have enough food and shelter, work to reduce homelessness and mental
health
-Less section 8 housing
-Increase home ownership in the downtown
-Can’t allow the homeless and drug addicts to occupy the street corners
-Be more inclusive
-Less people
-The negative perception of Hagerstown
-More tot lots to occupy the empty commercial spaces, more police patrol
-Get rid of all of the cynicism
-The downtown area
-Make downtown and interesting place to dine and shop
-More night police
-Community center with upgraded facilities
-Starbucks downtown and a Jazz club downtown
-Clean up properties and plant some trees and plants, things stamped in concrete
-More affordable rent for seniors
-More the horrible blue trash cans to the backyards, we look like a trash dump
-More bright and fancy downtown streets
-Create boutiques and small businesses downtown such as pop-up shops
-More green spaces
-Landlords taking better care of rentals
-Deregulate income qualifications for improvements
-Better leadership
34-Less panhandling, more police presence, masks enforced in stored
-Do more town center truly at the towncenter
-Add considerable new employees and dramatically improve city amenities
-Access to fresh, local produce year round, greater access to holistic alternative health care
-Get rid of the neighbors and keep the street clean
-Get the neighbors to keep the street clean
-Clean up the drug problem
-Eliminate homelessness and break up the section 8 housing near downtown, encourage the
wealthy homeowners to re-locate there
-I would instill more consideration towards others
-More opportunity for purchasing property and less rentals, less drug activity
-Meth problem
-Bulldoze empty houses and parking lots
-More funding for the police, fire and EMS
-Parking enforcement, garbage and parking on lawn
-Cleanup the downtown area, make it a place people want to visit, less crimes
-To have city residents only pay city taxes, not city and county taxes, why do we pay both?
-More cleaner streets in all areas
-Ease solar power restrictions
-Better kept sidewalks and more handicap parking
-Just more lighting
-Fix up and maintain better homes
-The homeless sitting downtown and begging on corners
-Make people responsible for their property
-Get rid of the murals/replace them with murals about Hagertown’s history
-More trash cans
-More effort to increase higher education and promote critical thinking
-Churches open their doors for the homeless and help the less fortunate
-I would like a ball park somewhere in the city
35-Low income housing out of downtown
-Remove the mental health and drug rehab centers from out of town
-A more vibrant downtown
-Everything one does is challenged, too many narrow minded people
-All this section 8
-More street lights
-More flexible HOA
-Move the prison, draws criminals
-Can’t think of anything
-Repair the streets, rebuild the trolly
-Homeless at every major intersection and shopping center
-Stop prison releases from being dropped off in the city
-Institute a plant a tree program
-Eliminate anyone associated with a gang in the downtown area
-Open political discussion to the public
-Change the drug dealers and prison release, they just stay here because it is cheap to live
-Get rid of the slum apartment’s downtown
-Have people more integrated in charge for the better
-That people have to keep up the appearances of the outside of their homes
-Cleaner streets
I would not make any changes
57
No Response or Missing
80
36APPENDIX E
Question # 36
If you have children residing with you, what types of activities do you or your children wish were
available here?
________
Or I have no children residing at my house
Response
-More variety of outdoor activities
-Ball games
-Kids events in city park
-Outdoor concerts
-Lower costs to participate in sports
-Reading club
-More events that involve exercise
-Anything fun and safe
-Safer community activities
-Baseball
-Cheaper karate and better quality, basketball
-We are satisfied with the options we do have, thanks
-Mini golf course
-Parades, carnivals, neighborhood picnics, Christmas caroling, egg hunts
-Fishing
-Social activities for 18-20 year olds
-More free events for kids
-Anything where there is no smoking
-Better regular activities in the parks
-Game room
37-More sports
-More local events that are not crowded to the brim
-More indoor activities when the weather is bad. Discovery Station and Ready Set Play are all we have
-We try to get out of town as much as possible
-Skate park
-Outdoor events
-Music and cultural events
-More city sponsored activities
-Theme park
-More children activities in the park
-Indoor pool for during winter
-A lot more than what you have
-Safe places for families
-Paid and staff activities, amusement park and zoo
-Involved in wrestling at the PAL
-Just events with no drugs and alcohol involved
-Amusement park
-Community events, outdoor recreation park
-My children are older
-Affordable water play, more inclusive places for special needs kids
-We have really good activities which is why we moved to Hagerstown, such as good parks
-Indoor events and climbing areas
-More places to take kids, like sky zone
-We like to use parks
38-Splashpad
I Have no children residing at my household
204
No Response or Missing
45
39SPSS OUTPUTS
*Questions where a subjective response was possible are excluded from the outputs.
Question #17
How often do you shop or eat at locally owned restaurant or business (non-chain restaurant)?
ShopEatLocal
Cumulative
Frequency Percent Valid Percent Percent
Valid Never 15 5.1 5.1 5.1
LessthanonceaMonth 84 28.4 28.4 33.4
MorethanonceaMonth 107 36.1 36.1 69.6
Weekly 89 30.1 30.1 99.7
NoResponse/Missing 1 .3 .3 100.0
Total 296 100.0 100.0
Question #18
Where do you prefer to shop for food?
WhereShopFood
Cumulative
Frequency Percent Valid Percent Percent
Valid FarmersMarket 47 15.9 15.9 15.9
ChainGroceryStore 216 73.0 73.0 88.9
OnlineGroceryDeliveryServic 16 5.4 5.4 94.3
e
LocalFruitVegetOwner 9 3.0 3.0 97.3
Other 8 2.7 2.7 100.0
Total 296 100.0 100.0
40Question #19
Where do you prefer to shop retail?
PrefShopRetail
Cumulative
Frequency Percent Valid Percent Percent
Valid Local Small 77 26.0 26.0 26.0
Valley Mall 60 20.3 20.3 46.3
Outlets 28 9.5 9.5 55.7
AmazonorOnline 89 30.1 30.1 85.8
Other 37 12.5 12.5 98.3
NoResponse/Missing 5 1.7 1.7 100.0
Total 296 100.0 100.0
Question #21
How safe do you feel in your neighborhood?
Safety
Cumulative
Frequency Percent Valid Percent Percent
Valid Safe 138 46.6 46.6 46.6
SomewhatSafe 111 37.5 37.5 84.1
SomewhatUnsafe 29 9.8 9.8 93.9
Unsafe 18 6.1 6.1 100.0
Total 296 100.0 100.0
41Question #23
Do you feel that there is a park close to your home?
ParkClose
Cumulative
Frequency Percent Valid Percent Percent
Valid Yes 239 80.7 80.7 80.7
No 43 14.5 14.5 95.3
NoResponse/Missing 14 4.7 4.7 100.0
Total 296 100.0 100.0
Question #24
Would you walk to the closest park to your home?
WalkPark
Cumulative
Frequency Percent Valid Percent Percent
Valid Yes 181 61.1 61.1 61.1
No 98 33.1 33.1 94.3
NoResponse/Missing 17 5.7 5.7 100.0
Total 296 100.0 100.0
42Question #28
Would you be interested in a monthly billing for water/sewer that may be averaged between quarterly
readings?
InterestMonthBill
Cumulative
Frequency Percent Valid Percent Percent
Valid 0 1 .3 .3 .3
Yes 88 29.7 29.7 30.1
No 179 60.5 60.5 90.5
3 1 .3 .3 90.9
NoResponse/Missing 27 9.1 9.1 100.0
Total 296 100.0 100.0
Question #35
If there are people in your household that would be interested in higher education or job training what is
the main obstacle that exists to prevent that?
ObstaclesEducTrain
Cumulative
Frequency Percent Valid Percent Percent
Valid Money 59 19.9 20.0 20.0
Transportation 8 2.7 2.7 22.7
ChildCare 1 .3 .3 23.1
DoNotHaveaGED 4 1.4 1.4 24.4
TimeAwayfromOthers 14 4.7 4.7 29.2
Other 12 4.1 4.1 33.2
NoOneInterested 161 54.4 54.6 87.8
NoResponse/Missing 36 12.2 12.2 100.0
Total 295 99.7 100.0
Missing System 1 .3
Total 296 100.0
43Question #1
How long have you lived in Hagerstown?
LivedCity
Cumulative
Frequency Percent Valid Percent Percent
Valid Less than 5 years 31 10.5 10.5 10.5
5 to 10 years 38 12.8 12.8 23.3
11 to 20 years 54 18.2 18.2 41.6
more than 20 years 171 57.8 57.8 99.3
No Response or Missing 2 .7 .7 100.0
Total 296 100.0 100.0
Question #2
Do you work in the City?
WorkCity
Cumulative
Frequency Percent Valid Percent Percent
Valid Yes 89 30.1 30.1 30.1
No 201 67.9 67.9 98.0
No Response/Missing 6 2.0 2.0 100.0
Total 296 100.0 100.0
44Question #3
If your answer to Question 2 was no, which best describes your place of employment? If you answered
yes to Question 2, skip to Question 4.
PlaceEmploy
Cumulative
Frequency Percent Valid Percent Percent
Valid Out of City, in Wash County 32 10.8 10.8 10.8
Out of Wash Co, in Maryland 36 12.2 12.2 23.0
Out of Maryland 18 6.1 6.1 29.1
Do Not Work 108 36.5 36.5 65.5
N/A, means Yes to previous 90 30.4 30.4 95.9
question
No Response/Missing 12 4.1 4.1 100.0
Total 296 100.0 100.0
45Question #4
Which of these describes your household income last year (2019)?
HouseInc
Cumulative
Frequency Percent Valid Percent Percent
Valid $0 1 .3 .3 .3
$1-$9,999 2 .7 .7 1.0
$10,000-$24,999 40 13.5 13.5 14.5
$25,000-$49,999 80 27.0 27.0 41.6
$50,000-$74,999 57 19.3 19.3 60.8
$75,000-$99,999 33 11.1 11.1 72.0
$100,000-$149,999 35 11.8 11.8 83.8
$150,000 or greater 14 4.7 4.7 88.5
9 25 8.4 8.4 97.0
No Response/Missing 9 3.0 3.0 100.0
Total 296 100.0 100.0
46Question #5
What is your age?
Age
Cumulative
Frequency Percent Valid Percent Percent
Valid Under 25 5 1.7 1.7 1.7
25-34 15 5.1 5.1 6.8
35-44 31 10.5 10.5 17.2
45-54 42 14.2 14.2 31.4
55-64 75 25.3 25.3 56.8
65+ 124 41.9 41.9 98.6
7 3 1.0 1.0 99.7
9 1 .3 .3 100.0
Total 296 100.0 100.0
47Question #6
Which of the following best describes your race?
Race
Cumulative
Frequency Percent Valid Percent Percent
Valid African American/Black 19 6.4 6.4 6.4
American Indian/Alaskan 11 3.7 3.7 10.1
Native
Asian,Hawaiian,Pacific 4 1.4 1.4 11.5
Islander
White 249 84.1 84.1 95.6
Other 9 3.0 3.0 98.6
No Response Missing 4 1.4 1.4 100.0
Total 296 100.0 100.0
Question #7
Are you or other members of your household of Hispanic or Latino ancestry?
LatinoHispanic
Cumulative
Frequency Percent Valid Percent Percent
Valid Yes 14 4.7 4.7 4.7
No 277 93.6 93.6 98.3
4 1 .3 .3 98.6
No Response/Missing 4 1.4 1.4 100.0
Total 296 100.0 100.0
48Question #8
How do you identify yourself?
Gender
Cumulative
Frequency Percent Valid Percent Percent
Valid Male 129 43.6 43.6 43.6
Female 154 52.0 52.0 95.6
PreferNottoAnswer 5 1.7 1.7 97.3
NoResponse/Missing 8 2.7 2.7 100.0
Total 296 100.0 100.0
Question #9
What is your marital status?
MaritalStatus
Cumulative
Frequency Percent Valid Percent Percent
Valid Married 142 48.0 48.0 48.0
Divorced 47 15.9 15.9 63.9
Separated 4 1.4 1.4 65.2
Widowed 45 15.2 15.2 80.4
Single 48 16.2 16.2 96.6
NoResponse/Missing 10 3.4 3.4 100.0
Total 296 100.0 100.0
49Question #10
What amount of your total household income is spent on housing expenses (mortgage or rent) including
utilities?
Expenses
Cumulative
Frequency Percent Valid Percent Percent
Valid Lessthan15% 57 19.3 19.3 19.3
15-19.9% 37 12.5 12.5 31.8
20-29.9% 60 20.3 20.3 52.0
30-39.99% 49 16.6 16.6 68.6
40-49.9% 28 9.5 9.5 78.0
>50% 41 13.9 13.9 91.9
NoResponse/Missing 24 8.1 8.1 100.0
Total 296 100.0 100.0
Question #11
Do you own or rent your home?
OwnRent
Cumulative
Frequency Percent Valid Percent Percent
Valid Own 251 84.8 84.8 84.8
Rent 36 12.2 12.2 97.0
NoResponse/Missing 9 3.0 3.0 100.0
Total 296 100.0 100.0
50Question #12
How many people live with you at your current residence?
LiveatResid
Cumulative
Frequency Percent Valid Percent Percent
Valid 0 49 16.6 16.6 16.6
1 88 29.7 29.7 46.3
10 1 .3 .3 46.6
2 78 26.4 26.4 73.0
3 37 12.5 12.5 85.5
4 15 5.1 5.1 90.5
5 9 3.0 3.0 93.6
6 2 .7 .7 94.3
7 3 1.0 1.0 95.3
99 14 4.7 4.7 100.0
Total 296 100.0 100.0
51Question #13
What is the highest degree or level of education you have completed?
Education
Cumulative
Frequency Percent Valid Percent Percent
Valid SomeHighSchool 15 5.1 5.1 5.1
HighSchool 121 40.9 40.9 45.9
Bachelors 65 22.0 22.0 67.9
Masters 40 13.5 13.5 81.4
PhDorPostGrad 6 2.0 2.0 83.4
TradeSchool 23 7.8 7.8 91.2
PreferNottoAnswer 11 3.7 3.7 94.9
NoResponse/Missing 15 5.1 5.1 100.0
Total 296 100.0 100.0
Question #14
What type of dwelling do you live in?
TypeDwelling
Cumulative
Frequency Percent Valid Percent Percent
Valid SingleFamilyDetached 177 59.8 59.8 59.8
1/2DoubleTownhouse/RowH 84 28.4 28.4 88.2
ouse
Apartment 11 3.7 3.7 91.9
Other 16 5.4 5.4 97.3
NoResponse/Missing 8 2.7 2.7 100.0
Total 296 100.0 100.0
52Question #15
What type would be your preferred housing type?
PreferredHous
Cumulative
Frequency Percent Valid Percent Percent
Valid SingleFamilyDetached 230 77.7 77.7 77.7
1/2DoubleTownhouse/Rowh 29 9.8 9.8 87.5
ouse
Apartment 11 3.7 3.7 91.2
Other 16 5.4 5.4 96.6
NoResponse/Missing 10 3.4 3.4 100.0
Total 296 100.0 100.0
Question #16
If you are currently renting your home, would you be interested in learning about steps to take to get
prepared to own a house?
LearntoOwn
Cumulative
Frequency Percent Valid Percent Percent
Valid Yes 14 4.7 4.7 4.7
No 34 11.5 11.5 16.2
N/A 237 80.1 80.1 96.3
NoResponse/Missing 11 3.7 3.7 100.0
Total 296 100.0 100.0
53Question #17
How often do you shop or eat at locally owned restaurant or business (non-chain restaurant)?
ShopEatLocal
Cumulative
Frequency Percent Valid Percent Percent
Valid Never 15 5.1 5.1 5.1
LessthanonceaMonth 84 28.4 28.4 33.4
MorethanonceaMonth 107 36.1 36.1 69.6
Weekly 89 30.1 30.1 99.7
NoResponse/Missing 1 .3 .3 100.0
Total 296 100.0 100.0
Question #18
Where do you prefer to shop for food?
WhereShopFood
Cumulative
Frequency Percent Valid Percent Percent
Valid FarmersMarket 47 15.9 15.9 15.9
ChainGroceryStore 216 73.0 73.0 88.9
OnlineGroceryDeliveryServic 16 5.4 5.4 94.3
e
LocalFruitVegetOwner 9 3.0 3.0 97.3
Other 8 2.7 2.7 100.0
Total 296 100.0 100.0
54Question #19
Where do you prefer to shop retail?
PrefShopRetail
Cumulative
Frequency Percent Valid Percent Percent
Valid Local Small 77 26.0 26.0 26.0
Valley Mall 60 20.3 20.3 46.3
Outlets 28 9.5 9.5 55.7
AmazonorOnline 89 30.1 30.1 85.8
Other 37 12.5 12.5 98.3
NoResponse/Missing 5 1.7 1.7 100.0
Total 296 100.0 100.0
Question #21
How safe do you feel in your neighborhood?
Safety
Cumulative
Frequency Percent Valid Percent Percent
Valid Safe 138 46.6 46.6 46.6
SomewhatSafe 111 37.5 37.5 84.1
SomewhatUnsafe 29 9.8 9.8 93.9
Unsafe 18 6.1 6.1 100.0
Total 296 100.0 100.0
55Question #23
Do you feel that there is a park close to your home?
ParkClose
Cumulative
Frequency Percent Valid Percent Percent
Valid Yes 239 80.7 80.7 80.7
No 43 14.5 14.5 95.3
NoResponse/Missing 14 4.7 4.7 100.0
Total 296 100.0 100.0
Question #24
Would you walk to the closest park to your home?
WalkPark
Cumulative
Frequency Percent Valid Percent Percent
Valid Yes 181 61.1 61.1 61.1
No 98 33.1 33.1 94.3
NoResponse/Missing 17 5.7 5.7 100.0
Total 296 100.0 100.0
56Question #28
Would you be interested in a monthly billing for water/sewer that may be averaged between quarterly
readings?
InterestMonthBill
Cumulative
Frequency Percent Valid Percent Percent
Valid 0 1 .3 .3 .3
Yes 88 29.7 29.7 30.1
No 179 60.5 60.5 90.5
3 1 .3 .3 90.9
NoResponse/Missing 27 9.1 9.1 100.0
Total 296 100.0 100.0
57You can also read