EHLANZENI - Cooperative Governance and Traditional ...
←
→
Page content transcription
If your browser does not render page correctly, please read the page content below

/52   EHLANZENI
      DISTRICT: MP
      Ehlanzeni, a tourism destination of
      choice as it showcases areas such
      as God's Window, Mac Mac Falls,
      Bourke's Luck potholes, Kruger
      National Park and others. The
      District features three border
      gates to both Swaziland and
      Mozambique.
2
              PROFILE: EHLANZENI DISTRICT

CONTENT
1. Executive Summary ........................................................................................... 4

2. Introduction: Brief Overview ............................................................................. 6
     2.1     Location ................................................................................................................. 6
     2.2     Historical Perspective ............................................................................................ 6
     2.3     Spatial Status ........................................................................................................ 8
     2.3     Landownership .................................................................................................... 10

3. Social Development Profile ............................................................................. 10
     3.1     Key Social Demographics .................................................................................... 10
     3.1.1      Population........................................................................................................ 10
     3.1.2      Gender, age and race ...................................................................................... 11
     3.1.3      Households...................................................................................................... 13
     3.2     Health Profile ....................................................................................................... 13
     3.3     COVID-19 ............................................................................................................ 14
     3.4     Poverty Dimensions ............................................................................................. 16
     3.4.1      Distribution....................................................................................................... 16
     3.4.2      Inequality ......................................................................................................... 17
     3.4.3      Employment/Unemployed ................................................................................ 19
     3.4.4      Crime ............................................................................................................... 21
     3.5     Education and Skills ............................................................................................ 22

4. Drivers of the Economy ................................................................................... 23
     4.1.       Structure of the Economy ................................................................................ 23
     4.2.       Primary Sector ................................................................................................. 24
     4.3.       Secondary Sector ............................................................................................ 25
     4.4.       Tertiary Sector ................................................................................................. 26

5. Service Delivery ............................................................................................... 26
     5.1.       Water and Sanitation ....................................................................................... 26
     5.2.        Human Settlements ........................................................................................ 28
     5.3.       Electricity ......................................................................................................... 29
     5.4        Waste Management......................................................................................... 30
     5.5.       Transport ......................................................................................................... 31

6. GOVERNANCE AND MANAGEMENT ............................................................. 31
     6.1.        Municipality Performance ................................................................................ 31
PROFILE: EHLANZENI DISTRICT            3

    6.2.     Municipal Capacity........................................................................................... 32
    6.3.     Traditional Affairs Governance......................................................................... 32

7. PROJECTS TO DIVERSIFY AND GROW PEOPLE AND THE ECONOMY ..... 33
    7.1.     Social Development Projects ........................................................................... 33
    7.2.      Spatial Development ....................................................................................... 33
    7.3.      Infrastructure Projects ..................................................................................... 34
    7.4.     Economic Projects ........................................................................................... 34
    7.5.     Environmental forecast .................................................................................... 35

8. KEY RECOMMENDATIONS ............................................................................. 35
    8.1.     Integrated Development Plan Priorities ............................................................ 35
    8.2.      Investor and Sponsorship opportunities .......................................................... 36
4
        PROFILE: EHLANZENI DISTRICT

1. Executive Summary
PROFILE: EHLANZENI DISTRICT   5

The Ehlanzeni District Municipality (EDM) is one of the three district municipalities in
the Mpumalanga Province. It is situated in the north-eastern part of the province and
it is bordered by Mozambique and Swaziland in the east. It shares boundaries with
Gert Sibande District in the south, Mopani and Sekhukhune Districts of Limpopo in the
north and Nkangala District Municipality in the west. It makes up just over a third of
the province's geographical area, covering an area of approximately 27 895 km2.

The district comprises four local municipalities of Bushbuckridge, City of Mbombela,
Nkomazi and Thaba Chweu. The City of Mbombela is the capital of Mpumalanga and
serves as home of the Mpumalanga Provincial Government. As a result, it is the most
concentrated economic hub within the province.

The District features three border gates to both Swaziland and Mozambique
(Matsamo, Komatipoort and Mananga border gates) and, therefore, movement of
people from neighbouring countries to the district, and from Gauteng to either
Swaziland or Mozambique, creates a catalyst for the economic life of the area.

With the population of 1 856 753 people in 2019, the Ehlanzeni District Municipality
houses about 40% of Mpumalanga province’s population and 3.2% of South Africa's
total population. The number of people without any schooling in the District stands at
47.8%.

As at 05 June 2020, 1 417 832 COVID-19 screenings were conducted in Ehlanzeni
District, and on 10 June 2020, the province reported a total of 3 850 702 screenings
across the province. As at this date, there were 83 confirmed positive cases, 55
recoveries and 1 death in the Ehlanzeni District, in the City of Mbombela Local
Municipality. In 2018, there were 1.24 million people living in poverty, using the upper
poverty line definition, across the Ehlanzeni District. The percentage of people living
in poverty has however decreased from 74.85% in 2008 to 67.27% in 2018.

The main drivers of the economy are Community Services (44.5%), Trade (44%),
Financial and Real Estate (43.1%), Construction (41%), Transport (37.5%),
Agriculture (35.5%), Manufacturing (19.6%), Mining (6%), Utilities (2.8%) and
Electricity (2%). The average annual income in the District was R30 000 per annum.

The EDM has identified catalytic projects which are deemed to have potential to make
a significant impact on the economic prosperity of the District. The ten packaged
projects include Fresh Fruit Market, Light Industrial Park, Packaging and Storage Hub,
Organic Fertilizer, Tonga Precast, Timber Cluster, Kruger Malalane Junction, Inyaka
Dam, Entertainment and Tourism Hub, as well as the Kruger Mpumalanga
International Airport (KMI Airport).

6
          PROFILE: EHLANZENI DISTRICT

2. Introduction: Brief Overview

    2.1 Location
The Ehlanzeni District Municipality is a Category C municipality situated in the north-
eastern part of the Mpumalanga Province. It makes up just over a third of the
province's geographical area. The district is comprised of four local municipalities:
Bushbuckridge, City of Mbombela, Nkomazi and Thaba Chweu. Mbombela (previously
Nelspruit) is the capital town of Mpumalanga, situated in the City of Mbombela Local
Municipality, which is also the home of the Mpumalanga Provincial Government and,
as a result, is the most concentrated economic hub within the province. It features
three border gates to both Swaziland and Mozambique (Matsamo, Komatipoort and
Mananga border gates) and, therefore, movement of people from neighbouring
countries to the district, and from Gauteng to either Swaziland or Mozambique, creates
a catalyst for the economic life of the area.

    2.2 Historical Perspective
Ehlazeni is an isiZulu and siSwati word meaning "lowveld", where the district is
geographically located. The area known as the Lowveld is the lowland area, below
500 metres in altitude along South Africa’s’ northern border with Botswana and
Zimbabwe with the famed Kruger National Park comprising half of it. It also comprises
sections of Limpopo Province that extend down to the east of the Drakensberg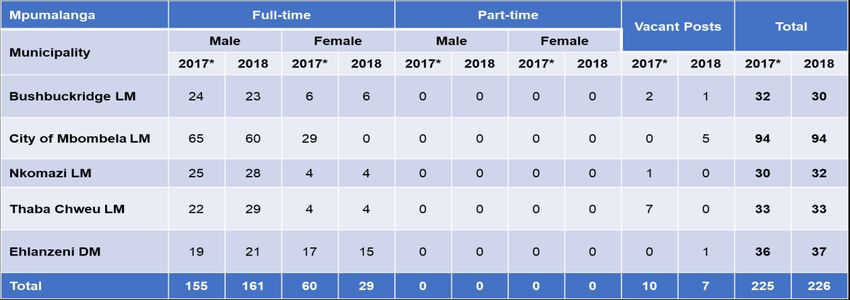
PROFILE: EHLANZENI DISTRICT   7

escarpment, through Mpumalanga and then into eastern Swaziland, joining the border
of Mozambique to the East and the Drakensberg to the West.

The cultural and historical sites in the district bare testament to early human activities
including the early, middle and late stones ages as we the iron age eras. Some pottery
found in the area also bare resemblance to similar pottery from East Africa, and some
sites show some of Africa’s oldest food cultivation examples. In addition to this, Sir
Joseph Hutchinson (a British biologist woven cotton preserved in a silver jar, dating
back to 3 000 BC which was found in Pakistan, bares testimony to this region being
the original home of the world’s cotton. This means the natives of the land possibly
travelled and exported the material over to India and across to Peru. This remains an
unsolved mystery but it is thought that this could have been as a result of the ingenuity
of the San people who occupied caves near Ohrigstad (and others scattered across
the Lowveld) many millennia ago, or as a result of Negroid tribes arriving on the scene
some 1500 years ago in successive waves from Central Africa consequently
displacing the San.

These newcomers brought with them the knowledge of iron smelting, often also
working gold, if only for ornamental purposes, practising simple agriculture, but also
tending sheep, goats and cattle. Roughly 1400AD, a second massive wave of Bantu-
speaking people migrated from the North, bringing with them huge populations and
huge herds with more sophisticated iron-smelting technology. This however heralded
the beginning of multiple tribal clashes (The Mfecane, which was a widespread period
of chaos and warfare amongst the indigenous ethnic communities in Southern Africa
from around 1815 to 1840) which dominated the scene in the Lowveld for many years
to come. This in turn saw the rise and fall of several Kingdoms, including the Swati,
Pedi and Ndebele who lived a peaceful existence until the skirmishes with both Boers
and British troops ultimately contributing to the instability of the Lowveld area, and
despite being heroic warriors, lost the battle against progress.

1835 saw the start of the Great Trek, which saw more than 10,000 Boers leaving the
Cape Colony with their families to move north. Plagued by problems such as exorbitant
taxes, conflict with the Xhosa on the Eastern frontiers, and a hearty dislike for the
English colonial authorities, made the decision to seek fertile lands and to establish
their own country for want of a word. Under the leadership of Andries Potgieter,
Andries Pretorius and Louis Trichardt these early pioneers made their way
northwards, with the Lowveld being among the areas where they settled. Thus the
Lowveld area is rich in the history of pioneers and explorers. Gold-rush towns such as
Pilgrim's Rest, Graskop, Kaapsche Hoop and Barberton, give tourists the feel of days
gone by.

A visit to Mpumalanga is not complete without testing the trout streams around Belfast,
Dullstroom, Machadodorp and Lydenburg; experiencing a trip on the Rovos Rail steam
train, walking the Fanie Botha Hiking Trail, the very first established in the National
8
          PROFILE: EHLANZENI DISTRICT

Hiking Way System of South Africa; driving up Long Tom Pass to reach the highest
point in Mpumalanga; and visiting Skukuza Rest Camp in the Kruger National Park,
one of several overnight stays available in the park. Many upmarket, private game
lodges cater to the tourist's every need.The EDM is particularly a tourist destination of
choice as it showcases areas as God’s Window, Mac Mac Falls, Bourke’s Luck
potholes and the Kruger National Park. Historical sites and villages, old wagon routes
and monuments that are located in the District mark events and characters who
passed before in search of adventure and wealth.

    2.3 Spatial Status

The Spatial Development Framework (SDF) of the district, which was developed and
approved in 2010 which is currently undergoing review, indicates that the Ehlanzeni
district is strategically well positioned within an international, regional and Southern
African context. Existing spatial development initiatives of a regional and local
importance include the Maputo Development Corridor Spatial Initiative, the Nelspruit
Phalaborwa SDI, the Tourism and Biodiversity Corridor and the Limpopo Transfrontier
Park. The total size of the is 27 895 km2 and The Kruger National Park makes up
36,8% of the district.

Bushbuckridge Local Municipality is located in the northern parts of the district at
10 248 km2 the local municipality is the largest in landmass taking accounting for a
third of the landmass. The name of the municipality is derived from the fact that the
area was once inhabited by many bushbuck. The municipal area provides a link to
Lydenburg and other centres in the Lowveld, particularly Hoedspruit, Pilgrim's Rest
and Graskop. Bushbuckridge Local Municipality can therefore be called the gateway
PROFILE: EHLANZENI DISTRICT 9 to the major tourist attraction points in Mpumalanga and the eastern part of the Limpopo Province. The main town is Sabie Park and the main economic activities are agriculture and tourism. The City of Mbombela Local Municipality was established by the amalgamation of Mbombela Local Municipality and Umjindi Local Municipality on 3 August 2016. Mbombela is a siSwati meaning "a lot of people in a small space", derived from a train carriage where migrant workers would crown in a small space. Mbombela was the name of the township that bordered Nelspruit on the north-east before its residents were forcefully relocated in the late 1960s and early 1970s to the township of Kanyamazane a couple of kilometres east of Nelspruit. The city is located in the central and southern parts of the district and it makes about a third of the district at 7 141 km². It is also the capital of the province, and serves as a gateway to some of the best eco- and adventure activities in Southern Africa and, with its moderate climate, becomes the preferred tourist destination all year round. Its subtropical fruits (like mangoes, avocados, oranges, lemons, litchis and bananas) are a huge drawcard for visitors, and during springtime the blossoms of orange trees can be smelt kilometres away. For shopping enthusiasts, the city offers world-class shopping malls, casinos and entertainment venues with air-conditioning systems. Cities, towns and places of significance in the local municipality include Barberton, Emoyeni, Entokozweni, Hazyview, Kaapschehoop, Kabokweni, Kanyamazane, Luphisi, Matsulu, Mbombela, Mpakeni, Msogwaba, Ngodwana, Skukuza, Tekwane, and White River. The key economic drivers are finance and business services, manufacturing, government services, community services, trade, transport and communications, agriculture, construction, mining and tourism. Thaba Chweu Local Municipality is located on the western part of the district and it derives its name from Sesotho meaning “white mountain” as the the municipal area is surrounded by mountains and it is also misty. Its extent is 5 719km² and the escarpment that runs through Thaba Chweu divides the locality into eastern and western halves. The western half (Lydenburg area) is dominated by agricultural and farming activities, while forestry is the main economic activity of the eastern half (Sabie/Graskop area). Thaba Chweu is one of the major tourist attraction areas in South Africa. Mashishing (previously Lydenburg) is the oldest town in the province, and a hub of heritage where the famous Lydenburg Heads, which are said to date back to 400AD, were found in the 1950s. Also found here are old stone houses. Most of all, this is the home of trout fishing. Graskop is home to the Three Rondavels, The Blyde Canyon, Potholes, God’s Window, The Pinnacle, Berlin, Lisbon, and Graskop Falls, all of which are World Heritage Sites, and form the Panorama Route. In the Sabie area, when travelling east of Mashishing through the Long Tom Pass, there are hectares of pine plantations. These mountains are part of the Drakensberg Mountain Range. Key towns and localities include Graskop, Lydenburg, Mashishing, Pilgrim's
10
          PROFILE: EHLANZENI DISTRICT

Rest, and Sabie. The main economic sectors are mining, forestry, agriculture,
business services, and tourism.

Nkomazi Local Municipality, derives its name from isiZulu meaning "a cow". The
municipality is named after a river which starts from the north, the Nkomati River as it
is called by the siSwati speaking people. Due to the isiZulu influence, it is called the
Nkomazi. It is the smallest of the four municipalities of the district at 4 787km², making
up 17% of the land in the district. The municipality is strategically placed between
Swaziland (north of Swaziland) and Mozambique (east of Mozambique). It is also
shares boundaries with the Kruger National Park to the north and City of Mbombela
Local Municipality to the west. It is linked with Swaziland by two provincial roads, and
with Mozambique by a railway line and the main national road (N4), which forms the
Maputo Corridor. Key towns and localities are Komatipoort, Malalane and Marloth
Park. The main economic activities are agriculture, mining and tourism.

     2.3 Landownership
Land ownership is one of the major challenges facing the District. The nature of the
district is such that about 70% of it is rural and thus most of the areas are rural and
therefore not surveyed. This also means that there is lack of tenure security, which
poses a serious challenge in terms of development and ownership of properties.
Significant strides have been made to ensure that portions of the areas are surveyed
and title deeds are given to the rightful owners and occupants. Challenges still remain
though in this regard, including huge backlogs in terms of outstanding households
without titles, which in turn requires a large budget to address.

3. Social Development Profile

     3.1 Key Social Demographics
         3.1.1 Population

The population trends and population growth directly and indirectly impact on the
demand for services rendered by government. Ehlanzeni’s population grew from 1 628
219 people in 2009 to 1 856 753 people in 2019.
PROFILE: EHLANZENI DISTRICT 11
Source: IHS Markit Regional eXplorer version 1803
The population projection of Ehlanzeni District Municipality shows an estimated
average annual growth rate of 1.2% between 2019 and 2024. The average annual
growth rate in the population over the forecasted period for Mpumalanga Province and
South Africa is 1.3% and 1.3% respectively. The Mpumalanga Province is estimated
to have average growth rate of 1.3% which is higher than the Ehlanzeni District
Municipality. The South Africa as a whole is estimated to have an average annual
growth rate of 1.3% which is higher than that of Ehlanzeni's growth rate.
Ehlanzeni as Ehlanzeni as
Ehlanzeni Mpumalanga National Total
% of province % of national
2019 1,860,000 4,470,000 59,000,000 41.5% 3.1%
2020 1,880,000 4,530,000 59,800,000 41.5% 3.1%
2021 1,900,000 4,590,000 60,600,000 41.5% 3.1%
2022 1,930,000 4,650,000 61,500,000 41.4% 3.1%
2023 1,950,000 4,710,000 62,300,000 41.4% 3.1%
2024 1,970,000 4,770,000 63,100,000 41.4% 3.1%
Average Annual growth
2019-2024 1.24% 1.30% 1.35%
Source: IHS Markit Regional eXplorer version 1803
3.1.2 Gender, age and race
Ehlanzeni District Municipality's male/female split in population was 88.8 males per
100 females in 2019. The Ehlanzeni District Municipality has significantly more
females (52.97%) than males. This is most probably an area with high male out
migration to look for work elsewhere. In total there were 983 000 (52.97%) females
and 873 000 (47.03%) males. This is different from the Mpumalanga Province as a
whole where the female population counted 2.3 million which constitutes 51.37% of12
PROFILE: EHLANZENI DISTRICT
the total population of 4.47 million. The median age is 22 with 52% of the population
aged between 18 and 64 years.
The largest share of population are children aged between 0 and 14 years, totalling
612 000 or 33.0% of the total population. The age category with the second largest
number of people is the young working age (25-44 years) age category with a total
share of 31.5%, followed by the teenagers and youth (15-24 years) age category with
343 000 people. The age category with the least number of people are those above
65 years with only 90 800 people, as reflected in the population pyramids below.
Population structure
Ehlanzeni vs. South Africa, 2019
Male Female
Ehlanzeni 75+
South Africa 70-74
65-69
60-64
55-59
50-54
45-49
40-44
35-39
30-34
25-29
20-24
15-19
10-14
05-09
00-04
8,0% 6,0% 4,0% 2,0% 0,0% 2,0% 4,0% 6,0% 8,0%
Source: IHS Markit Regional eXplorer version 1946
In 2019, the Ehlanzeni District Municipality's population consisted of 94.36% African
(1.75 million), 4.45% White (82 600), 0.64% Coloured (11 800) and 0.55% Asian
(10 200) people.PROFILE: EHLANZENI DISTRICT 13
3.1.3 Households
In 2019, the Ehlanzeni District Municipality comprised of 514 000 households. This
equates to an average annual growth rate of 1.92% in the number of households from
2009 to 2019. With an average annual growth rate of 1.32% in the total population,
the average household size in the Ehlanzeni District Municipality is by implication
decreasing. This is confirmed by the data where the average household size in 2009
decreased from approximately 3.8 individuals per household to 3.6 persons per
household in 2019. 85% of these households are formal dwellings whilkst 5,6% are
informal dwellings or shacks.
43,7% of the households are headed by women and 4 849 households are headed by
children.
3.2 Health Profile
The leading cause of death amongst the 25-64 age group is HIV and Tuberculosis,
being the cause of death for 42% of the people in the age group during the period
2011 – 2015. The same was the case for the 15-24 age group at 34% during the same
period. Non-Communicable Diseases (NCD) is the leading cause of death among the
65+ age group being the cause of death for 74% during the 2011 – 2015 period.
Overall, NCD (39%) and HIV and TB (30%) are the two leading causes of death in the
district.
Source: Ehlanzeni District Municipality (DC32) District Health Plan 2019/20-2021/2214
PROFILE: EHLANZENI DISTRICT
In 2018, 294 000 people in the Ehlanzeni District Municipality were infected with HIV.
This reflects an increase at an average annual rate of 2.25% since 2008, and in 2018
represented 15.95% of the district's total population. There are currently 159 821
people receiving Ante-Retroviral therapy (ARVs) in the District.
In total, the Ehlanzeni District has 141 Health care facilities which include 110 clinics,
15 Community Health Facilities, 11 District, Regional and Tertiary hospitals and 5
“other” hospitals. The largest number of facilities are concentrated in the City of
Mbombela LM, with a total of 37 clinics, 7 Community Health Centres, and 8 hospitals
across the four different categories of hospitals.
3.3 COVID-19
As at 17 June 2020, Mpumalanga had 345 diagnosed cases of COVID-19, 38% or
108 of these were in Ehlanzeni. The only death recorded in the province was in
Ehlanzeni.
The Council for Scientific and Industrial Research (CSIR) in collaboration with Albert
Luthuli Centre for Responsible leadership have developed a set of COVID-19
Vulnerability Indicators using available data and knowledge. It identifies vulnerabilities
present in communities and identifying areas in need of targeted coordinated
interventions and early response. The purpose of the indicators is intended to support
the early prevention/mitigation and preparedness phase of the disaster management
cycle and informing disaster management decision making. It is not based on
epidemiological modelling but a response to highlighting intervention areas due toPROFILE: EHLANZENI DISTRICT 15 underlying situation. The composition of the index follows two main factors, namely: transmission potential and health susceptibility. Transmission potential areas identify areas that prevent social distancing to be practiced and where limitations of practicing good basic hygiene. The health susceptibility index denotes areas where large number of people are potential more susceptible to being adversely affected by COVID-10 due to factors such as age and underlying health conditions. The Ehlanzeni vulnerability profile is presented below. The map shows low vulnerability areas (blue dotted areas) versus areas with higher vulnerability (red dotted areas) Relative population density, poverty and access to basic services such as water and sanitation are key determinants of vulnerability. Consequently the City of Mbombela shows extreme vulnerabiulit, despite the province registering lower figures. In particucular the areas of Manzini, Nsikazi and Gutshwa around Nelspruit. In White River it’s the peri urban areas of Rocky Drift which are of concern, The rural areas of Matsulu and Luphisi are also of concern. The areas on the N4 to the Mozambique in Nkomazi also display some extreme vulnerabilites especially at Emjejane and the Ressano Garcia brder. Area specific live GIS vunerability maps are available curtosy of CSIR at: https://pta-gis-2-web1.csir.co.za/portal2/apps/opsdashboard/#/390a74fb10844c7a85396e60555a866d
16
               PROFILE: EHLANZENI DISTRICT

As at 17 June there were 5 quarantine facilities assessed and available for use in the
Ehlanzeni District. This provided the district with 353 beds. As at that date A
cumulative total of 237 people had been quarantined, 50 of which had been released
and 180 were still under quarantine. The following are the quarantine sites:

                                                       Number of
                                       Number of                     Number of people        Total no      Number released
 District          Quarantine site                      people
                                         beds                         tested positive        remaining     from quarantine
                                                      quarantined
 Ehlanzeni         Royal Hotel            52              41                   0                 0                41
                   Andover Nature
                                          34              2                    0                 0                    2
                   Resort
                   KwaMadwala             54              14                   0                 0                14

                   Mercure                104            104                   0               104                    0
                   Stay Easy
                                          115             76                   0                76                    0
                   Nelspruit
                   TOTAL                  353            237                   0               180                57

As at 17 June just under 1 million people had been screened and tested by 51 teams:

                                                                                      Number of
                         Number of      Number of     Average       Cumulative                        Cumulative           Test
                                                                                   people tested/
 Ehlanzeni District       screening      people        people       number of                          number of          Results
                                                                                     referred for
                         and testing    screened      screened        people                         people tested/       (Number
                                                                                   testing for the
                            teams       for the day   per team       screened                           referred          Positive)
                                                                                         day

 BBR                             0             0          0          367 049             0                 0                 0

 COM                             14        442           32          292 909                              110                0

 Nkomazi                         37        4225          114         239 318             7                946                0

 Thaba Chweu                     0             0          0           40 899             0                 0                 0
 Ehlanzeni Total                 51        4 667         92          940 175             7               1056                0

     3.4 Poverty Dimensions
         3.4.1 Distribution
The upper poverty line is defined by StatsSA as the level of consumption at which
individuals are able to purchase both sufficient food and non-food items without
sacrificing one for the other. This variable measures the number of individuals living
below that particular level of consumption for the given area, and is balanced directly
to the official upper poverty rate as measured by StatsSA.

In 2019, there were 1.26 million people living in poverty, using the upper poverty line
definition, across Ehlanzeni District Municipality - this is 6.21% higher than the
1.19 million in 2009. The percentage of people living in poverty has decreased from
72.79% in 2009 to 67.79% in 2019, which indicates a decrease of 5 percentage points.
PROFILE: EHLANZENI DISTRICT 17
Number and percentage of people in poverty
Ehlanzeni, 2009-2019
1 300 000 74%
1 250 000 72%
70%
1 200 000
68%
1 150 000
66%
1 100 000
64%
1 050 000
62%
1 000 000 60%
950 000 58%
2009 2010 2011 2012 2013 2014 2015 2016 2017 2018 2019
Number of people in poverty Percentage of people in poverty
Source: IHS Markit Regional eXplorer version 1946
In 2019, the population group with the lowest percentage of people living in poverty
was the White population group with a total of 2.8% people living in poverty, using the
upper poverty line definition. The proportion of the White population group, living in
poverty, decreased by -0.291 percentage points, as can be seen by the change from
2.54% in 2009 to 2.83% in 2019. In 2019, 71.36% of the African population group
lived in poverty, as compared to the 76.54% in 2009. The Coloured and the Asian
population group saw a decrease in the percentage of people living in poverty, with a
decrease of 8.09 and 0.548 percentage points respectively.
African White Coloured Asian
2009 76.5% 2.5% 45.2% 16.1%
2010 72.0% 2.2% 42.0% 12.5%
2011 66.9% 1.5% 37.1% 7.5%
2012 67.0% 1.4% 37.9% 7.4%
2013 67.5% 1.2% 39.1% 7.5%
2014 68.4% 1.2% 39.6% 7.8%
2015 68.2% 1.5% 38.6% 8.2%
2016 69.8% 2.1% 38.9% 10.7%
2017 70.8% 2.4% 38.9% 12.7%
2018 71.0% 2.6% 38.3% 14.7%
2019 71.4% 2.8% 37.1% 15.6%
Source: IHS Markit Regional eXplorer version 1803
3.4.2 Inequality
In 2019, the Gini coefficient in Ehlanzeni District Municipality was at 0.602, which
reflects a decrease in the number over the ten-year period from 2009 to 2019. The
Mpumalanga Province and South Africa, both had a more unequal spread of income18
PROFILE: EHLANZENI DISTRICT
amongst their residents (at 0.604 and 0.63 respectively) when compared to Ehlanzeni
District Municipality.
Gini coefficient
Ehlanzeni, Mpumalanga and National Total, 2009-2019
0,65
0,64
0,63
0,62
0,61
0,60
0,59
0,58
0,57
2009 2010 2011 2012 2013 2014 2015 2016 2017 2018 2019
Ehlanzeni Mpumalanga National Total
Source: IHS Markit Regional eXplorer version 1946
When segmenting the Ehlanzeni District Municipality into population groups, it can be
seen that the Gini coefficient for the African population group increased the most
amongst the population groups with an average annual growth rate of 0.40%. The Gini
coefficient for the Asian population group decreased the most with an average annual
growth rate of -0.46%.
African White Coloured Asian
2009 0.56 0.42 0.56 0.47
2019 0.58 0.42 0.53 0.45
Average Annual growth
2009-2019 0.40% 0.01% -0.42% -0.46%
Source: IHS Markit Regional eXplorer version 1946
It was estimated that in 2019, 18.48% of all the households in the Ehlanzeni District
Municipality were living on R30,000 or less per annum. In comparison with 2009's
41.27%, the number is about half. The 30000-42000 income category has the highest
number of households with a total number of 65 200, followed by the 18000-30000
income category with 63 600 households. Only 52 households fall within the 0-2400
income category.PROFILE: EHLANZENI DISTRICT 19
Ehlanzeni as % of Ehlanzeni as %
Ehlanzeni Mpumalanga National Total
province of national
0-2400 52 117 1,580 44.2% 3.3%
2400-6000 1,010 2,280 31,100 44.1% 3.2%
6000-12000 10,200 23,000 305,000 44.3% 3.3%
12000-18000 20,300 45,600 597,000 44.5% 3.4%
18000-30000 63,600 138,000 1,750,000 45.9% 3.6%
30000-42000 65,200 143,000 1,790,000 45.5% 3.7%
42000-54000 52,700 122,000 1,610,000 43.2% 3.3%
54000-72000 58,500 137,000 1,780,000 42.7% 3.3%
72000-96000 53,100 128,000 1,620,000 41.6% 3.3%
96000-132000 46,900 121,000 1,560,000 38.9% 3.0%
132000-192000 43,200 116,000 1,500,000 37.3% 2.9%
192000-360000 49,700 142,000 1,920,000 35.0% 2.6%
360000-600000 28,200 84,000 1,270,000 33.6% 2.2%
600000-1200000 16,700 51,600 934,000 32.4% 1.8%
1200000-2400000 4,420 13,900 321,000 31.7% 1.4%
2400000+ 469 1,570 53,900 29.8% 0.9%
Total 514,000 1,270,000 17,000,000 40.5% 3.0%
Source: IHS Markit Regional eXplorer version 1946
For the period 2009 to 2019, the number of households earning more than R30,000
per annum increased from 58.73% to 81.52%. On the other hand, the number of
households with income equal to or lower than R6,000 per year decreased by a
significant amount.
3.4.3 Employment/Unemployed
The working age population in Ehlanzeni in 2019 was 1.15 million, increasing at an
average annual rate of 1.38% since 2009. For the same period, the working age
population for Mpumalanga Province increased at 1.49% annually, while that of South
Africa increased at 1.62% annually. 460 000 of these are employed making the district
the district with the most employed individuals in Mpumalanga.
Total
Ehlanzeni Gert Sibande Nkangala
Mpumalanga
Agriculture 46,500 23,200 16,100 85,759
Mining 7,760 27,800 61,800 97,313
Manufacturing 30,300 34,000 27,900 92,187
Electricity 3,100 5,890 14,400 23,435
Construction 37,500 26,100 29,300 92,864
Trade 111,000 72,100 63,200 246,134
Transport 21,000 14,700 17,300 52,993
Finance 55,800 41,200 44,000 141,026
Community services 102,000 59,700 55,800 217,436
Households 45,300 22,800 27,900 96,017
Total 460,000 328,000 358,000 1,145,165
Source: IHS Markit Regional eXplorer version 194620
PROFILE: EHLANZENI DISTRICT
In the Ehlanzeni District Municipality, the economic sectors that recorded the largest
number of employment in 2019 were the trade sector with a total of 111 000 employed
people or 24.1% of total employment in the district municipality. The community
services sector with a total of 102 000 (22.2%) employs the second highest number of
people relative to the rest of the sectors. The electricity sector with 3 100 (0.7%) is the
sector that employs the least number of people in Ehlanzeni District Municipality,
followed by the mining sector with 7 760 (1.7%) people employed.
Total Employment Composition
Ehlanzeni, 2019
6 Trade
24%
7 Transport
5 Construction 4%
8%
4 Electricity
1%
3 Manufacturing 8 Finance
7% 12%
2 Mining
2% 1
Agricultur
e
10%
9 Community services
22%
Households
10%
Source: IHS Markit Regional eXplorer version 1946
In 2019, there were a total number of 262 000 people unemployed in Ehlanzeni, which
is an increase of 118 000 from 144 000 in 2009. The total number of unemployed
people within Ehlanzeni constitutes 43.41% of the total number of unemployed people
in Mpumalanga Province. The Ehlanzeni District Municipality experienced an average
annual increase of 6.15% in the number of unemployed people, which is worse than
that of the Mpumalanga Province which had an average annual increase in
unemployment of 5.39%.
Ehlanzeni Mpumalanga National Total
2009 26.2% 26.7% 24.3%
2010 28.0% 28.2% 24.9%
2011 29.2% 29.2% 25.1%
2012 30.4% 29.4% 25.1%
2013 30.1% 29.0% 25.2%
2014 29.7% 28.4% 25.2%
2015 29.8% 28.3% 25.5%
2016 31.5% 29.5% 26.4%
2017 33.6% 31.2% 27.2%
2018 35.0% 32.2% 27.4%
2019 36.7% 33.5% 28.2%
Source: IHS Markit Regional eXplorer version 1946PROFILE: EHLANZENI DISTRICT 21
In 2019, the unemployment rate in Ehlanzeni District Municipality was 36.69%, which
is an increase of 10.5 percentage points. The unemployment rate in Ehlanzeni District
Municipality is higher than that of Mpumalanga. The unemployment rate for South
Africa was 28.21% in 2019, which is an increase of 3.91 percentage points from
24.31% in 2009.
Ehlanzeni Mpumalanga National Total
2009 2019 2009 2019 2009 2019
15-19 197,000 175,000 437,000 384,000 5,250,000 4,620,000
20-24 189,000 169,000 439,000 395,000 5,310,000 4,870,000
25-29 151,000 175,000 362,000 427,000 4,570,000 5,500,000
30-34 115,000 171,000 279,000 419,000 3,780,000 5,520,000
35-39 95,100 137,000 236,000 332,000 3,300,000 4,580,000
40-44 76,400 101,000 199,000 246,000 2,810,000 3,590,000
45-49 63,500 77,500 169,000 205,000 2,470,000 3,050,000
50-54 48,900 57,200 140,000 173,000 2,100,000 2,560,000
55-59 39,800 51,800 111,000 147,000 1,700,000 2,220,000
60-64 31,700 40,300 85,600 120,000 1,360,000 1,850,000
Total 1,010,000 1,150,000 2,460,000 2,850,000 32,700,000 38,400,000
Source: IHS Markit Regional eXplorer version 1803
3.4.4 Crime
Property crime is a major form of crime for all the regions in the Mpumalanga province,
relative to violent crime.
Overall, Violent and Property Crime Index
Ehlanzeni, Mpumalanga and National Total, 2018/2019
200
180
160
140
120
100
80
60
40
20
0
Ehlanzeni Mpumalanga National Total
OverallCrime Index Violent Crime Index Property Crime Index
Source: IHS Markit Regional eXplorer version 1946
For the period 2008/2009 to 2018/2019 overall crime has decreased at an average
annual rate of 4.22% within the Ehlanzeni District Municipality. Violent crime
decreased by 4.42% since 2008/2009, while property crimes decreased by 3.08%
between the 2008/2009 and 2018/2019 financial years.22
PROFILE: EHLANZENI DISTRICT
Overall, Violent and Property Crime Index
Ehlanzeni, 2008/2009-2018/2019
180
160
140
120
100
80
60
40
20
0
OverallCrime Index Violent Crime Index Property Crime Index
Source: IHS Markit Regional eXplorer version 1946
3.5 Education and Skills
The District is sub-divided into two Education District namely; Ehlanzeni and
Bohlabela. Ehlanzeni refers to Nkomazi, Umjindi and Mbombela. It is sub-divided into
14 Circuits namely: Umjindi, Mbombela, White river, White Hazy 1, White Hazy,
Mgwenya, Nsikazi, Sikhulile, Nkululeko, Malelane, Khulangwane, Nkomazi East and
Nkomazi West. Bohlabela refers to Thaba Chweu and Bushbuckridge. It is sub-divided
into 16 Circuits namely: Mashishing, Sabie, Manyeleti, Dwarsloop, Thulamahashe,
Greenvalley, Malvijan, Agincourt, Mkhuhlu, Ximhungwe, Marite, Casteel, Lehukwe,
Cottondale, Arthurseat and Shatale.
In terms of the distribution of educational facilities in the district, there are 30 circuits,
747 schools, of which 701 are no-fee schools. A total of 6 996 learners are benefitting
from scholar transport and 437 886 learners are benefitting from school nutrition
programme as per the table below:PROFILE: EHLANZENI DISTRICT 23
One TVET college, Ehlanzeni TVET College, comprising seven campuses and a
central office exist in the district. One campus in situated in the Bushbuckridge LM,
four are in the City of Mbombela, one is in Thaba Chweu and one is in Nkomazi LM.
One of the two campuses of the University of Mpumalanga is also located in this
district, in the town of Mbombela, commonly referred to as the Mbombela Campus.
The number of people without any schooling in Ehlanzeni District Municipality
accounts for 47.75% of the number of people without schooling in the province and a
total share of 5.84% of the national. In 2019, the number of people in Ehlanzeni District
Municipality with matric only was 325,000 which is a share of 39.76% of the province's
total number of people that has obtained a matric. The number of people with matric
and a Postgrad degree constitutes 44.90% of the province and 1.96% of the national.
Ehlanzeni as % of Ehlanzeni as % of
Ehlanzeni Mpumalanga National Total
province national
No schooling 124,000 260,000 2,130,000 47.8% 5.8%
Grade 0-2 19,600 50,200 660,000 39.0% 3.0%
Grade 3-6 84,300 212,000 3,080,000 39.7% 2.7%
Grade 7-9 153,000 395,000 6,170,000 38.6% 2.5%
Grade 10-11 242,000 658,000 9,070,000 36.8% 2.7%
Certificate / diploma
5,440 15,000 182,000 36.2% 3.0%
without matric
Matric only 325,000 816,000 11,300,000 39.8% 2.9%
Matric certificate /
70,500 189,000 2,330,000 37.3% 3.0%
diploma
Matric Bachelors
34,500 76,800 1,760,000 44.9% 2.0%
degree
Matric Postgrad
11,500 23,800 796,000 48.2% 1.4%
degree
Source: IHS Markit Regional eXplorer version 1946
4. Drivers of the Economy
4.1. Structure of the Economy
With a GDP of R 131 billion in 2019 (up from R 61 billion in 2009), the Ehlanzeni
District contributed 34.08% to the Mpumalanga Province GDP of R 383 billion in 2019.
The District has increased its share to the economy of Mpumalanga from 33.45% in
2009. The Ehlanzeni District contributes 2.57% to the GDP of South Africa, which had
a total GDP of R 5.08 trillion in 2019 (as measured in nominal or current prices). Its
contribution to the national economy stayed similar in importance from 2009 when it
contributed 2.43% to South Africa.
The economy of the District is made up of a variety of industries, including Agriculture,
Construction, Trade and Community Services, among others. According to the 2019
IHS Markit report, Community Services (26%), followed by Trade (21%) and Finance24
PROFILE: EHLANZENI DISTRICT
(16%) was the dominant sector in the District economy. The sector that contributed
the least to the economy of the District was the Agriculture sector with a contribution
of 3% of the total GVA of the District.
Source: IHS Markit Regional eXplorer version 1946
In terms of the localities, the City of Mbombela Local Municipality is the greatest
contributor to the Ehlanzeni District economy with a share of 67.78% or R 88.5 billion,
increasing from R 39.8 billion in 2009. The locality with the lowest contribution is the
Thaba Chweu Local Municipality with R 12.5 billion, growing from R 6.33 billion in
2009.
4.2. Primary Sector
The primary sector consists of two broad economic sectors namely; the Mining and
the Agricultural sector. The following chart represents the average growth rate in the
GVA for both of these sectors in Ehlanzeni District Municipality from 2009 to 2019.
Gross value added (GVA) by primary sector
Ehlanzeni, 2009-2019
20%
15%
10%
5%
0%
2009 2010 2011 2012 2013 2014 2015 2016 2017 2018 2019
-5%
-10%
-15%
Agriculture Mining
Source: IHS Markit Regional eXplorer version 1946PROFILE: EHLANZENI DISTRICT 25
Between 2009 and 2019, the Agriculture sector experienced the highest positive
growth in 2017 with an average growth rate of 18.3%. It is evident for the mining sector
that the highest positive growth rate also existed in 2017 and it experienced a growth
rate of 10.0% which is lower than that of the agricultural sector. The Agricultural sector
experienced the lowest growth for the period during 2019 at -7.2%, while the mining
sector reaching its lowest point of growth in 2009 at -10.2%. Both the agriculture and
mining sectors are generally characterised by volatility in growth over the period.
GOVERNMENT IS CONDUCTING A FEASIBILITY STUDY FOR THE
ESTABLISHMENT OF AN AGRIHUB IN THE NKOMAZI MUNICIPALITY. A
BUDGET OF 15 MILLION RAND FOR THE 1ST PHASE OF THE AGRIHUB AND
THE CONVERSION TO A PACK-HOUSE OF ANOTHER HAS BEEN SET ASIDE
FOR THIS PURPOSE.
4.3. Secondary Sector
The secondary sector consists of three broad economic sectors namely; the
Manufacturing, Electricity and the Construction Sector. The following chart represents
the average growth rates in the GVA for these sectors in Ehlanzeni District Municipality
from 2009 to 2019.
Gross value added (GVA) by Secondary sector
Ehlanzeni, 2009-2019
10%
8%
6%
4%
2%
0%
-2% 2009 2010 2011 2012 2013 2014 2015 2016 2017 2018 2019
-4%
-6%
-8%
-10%
Manufacturing Electricity Construction
Source: IHS Markit Regional eXplorer version 1946
Source: IHS Markit Regional eXplorer version 1946
Between 2009 and 2019, the Manufacturing sector experienced the highest positive
growth in 2010 with a growth rate of 8.9%. The Construction sector reached its highest
growth in 2009 at 7.8%. The manufacturing sector experienced its lowest growth in
2019 of -9.0%, while construction sector reached its lowest point of growth in 2019 a
with -2.4% growth rate. The electricity sector experienced the highest growth in 2011
at 5.1%, while it recorded the lowest growth of -1.6% in 2015.26
PROFILE: EHLANZENI DISTRICT
4.4. Tertiary Sector
The tertiary sector consists of four broad economic sectors namely the Trade,
Transport, Finance and the Community Services sector. The following chart
represents the average growth rates in the GVA for these sectors in Ehlanzeni District
from 2009 to 2019.
Gross value added (GVA) by tertiary sector
5% Ehlanzeni, 2009-2019
4%
3%
2%
1%
0%
2009 2010 2011 2012 2013 2014 2015 2016 2017 2018 2019
-1%
-2%
Trade Transport Finance Community services
Source: IHS Markit Regional eXplorer version 1946
The Trade sector experienced the highest positive growth in 2010 with a growth rate
of 3.4%. The Transport sector reached its highest point of growth in 2011 at 3.3%. The
finance sector experienced the highest growth rate in 2011 when it grew by 3.8% and
recorded the lowest growth rate in 2013 at 0.6%. The Trade sector had the lowest
growth rate in 2009 at -0.8%. The Community Services sector, which largely consists
of government, experienced its highest positive growth in 2011 with 3.9% and the
lowest growth rate in 2009 with -0.4%.
5. Service Delivery
5.1. Water and Sanitation
In 2018, the Ehlanzeni District had a total number of 135 000 flush toilets (26.70% of
total households), 119 000 Ventilation Improved Pit (VIP) (23.58% of total households)
and 222 000 (43.93% of total households pit toilets).PROFILE: EHLANZENI DISTRICT 27
Households by type of Toilet
100% Ehlanzeni, 2008-2018
No toilet
80%
Bucket system
60%
Pit toilet
40%
Ventilation
Improved Pit (VIP)
20%
Flush toilet
0%
Ehlanzeni Mpumalanga National Total
Source: IHS Markit Regional eXplorer version 1946
The region within Ehlanzeni with the highest number of flush toilets is City of
Mbombela Local Municipality with 75 100 or a share of 55.60% of the flush toilets
within Ehlanzeni. The region with the lowest number of flush toilets is Nkomazi Local
Municipality with a total of 14 600 or a share of 10.82% of the total flush toilets within
Ehlanzeni District Municipality.
With regards to access to water, the Ehlanzeni District had a total number of 110 000
(or 21.73%) households with piped water inside the dwelling, a total of 214 000
(42.22%) households had piped water inside the yard and a total number of 49 500
(9.78%) households had no formal piped water.
Households by level of access to Water
100%
Ehlanzeni, 2008-2018
No formal piped water
90%
80% Communal piped water:
70% more than 200m from
dwelling (Below RDP)
60%
Communal piped water:
50% less than 200m from
dwelling (At RDP-level)
40%
Piped water in yard
30%
20%
Piped water inside
10%
dwelling
0%
Ehlanzeni Mpumalanga National Total
Source: IHS Markit Regional eXplorer version 1946
The localities within Ehlanzeni District with the highest number of households with
piped water inside the dwelling is City of Mbombela Local Municipality with 67 700 or
a share of 61.61% of the households with piped water inside the dwelling. The region
with the lowest number of households with piped water inside the dwelling is Thaba
Chweu Local Municipality with a total of 10 900 or a share of 9.94% of the total
households with piped water inside the dwelling.28
PROFILE: EHLANZENI DISTRICT
5.2. Human Settlements
Within the Ehlanzeni District, the demand for housing in rural areas is increasing. A
majority of people in the rural areas are living in traditional or informal type of houses.
The Mpumalanga Department of Human Settlement has been implementing housing
projects in the municipal area over the years. The mushrooming of informal
settlements also contributes to the rise of housing shortage. The District has a
challenge in developing human settlements in terms of the National Housing Strategy,
which encourages housing people close to their places of employment.
The Ehlanzeni District has co-ordinated all initiatives implemented during the past
years to address the shortage of housing within the district. There is still a huge
backlog on housing provision, which needs to be addressed during the next five years.
The slow pace of delivery and poor quality of the housing constructions has a heavy
impact on the shortage of houses in the District.
In 2018, according to the IHS Markit date, the Ehlanzeni District had a total number of
70 400 (13.92% of total households) very formal dwelling units, a total of 397 000
(78.56% of total households) formal dwelling units and a total number of 15 800
(3.13% of total households) informal dwelling units.
Households by dwelling unit type
Ehlanzeni, Mpumalanga and National Total, 2018
100%
90% Other dwelling
type
80%
70% Traditional
60%
50% Informal
40%
30% Formal
20%
10% Very Formal
0%
Ehlanzeni Mpumalanga National Total
Source: IHS Markit Regional eXplorer version 1946
The region with the highest number of very formal dwelling units is the City of
Mbombela Local Municipality with 48 500 or a share of 68.95% of the total very formal
dwelling units within Ehlanzeni District Municipality. The region with the lowest number
of very formal dwelling units is the Nkomazi Local Municipality with a total of 3 840 or
a share of 5.45% of the total very formal dwelling units within Ehlanzeni District
Municipality.PROFILE: EHLANZENI DISTRICT 29
Looking deeper into the formal dwelling unit backlog (number of households not living
in a formal dwelling) over time, it can be seen that in 2008 the number of households
not living in a formal dwelling was 36 700 within Ehlanzeni District Municipality. From
2008, this number increased annually at the rate of 0.34% to 38 000 in 2018.
5.3. Electricity
The Ehlanzeni District had a total number of 53 400 (10.57%) households with
electricity for lighting only, a total of 424 000 (83.86%) households had electricity for
lighting and other purposes and a total number of 28 100 (5.57%) households did not
use electricity.
Households by electricity usage
Ehlanzeni, 2008-2018
100%
90% Not using
80% electricity
70%
60%
Electricity for
50% lighting and other
40% purposes
30%
20% Electricity for
lighting only
10%
0%
Ehlanzeni Mpumalanga National Total
Source: IHS Markit Regional eXplorer version 1946
The region with the highest number of households with electricity for lighting and other
purposes is City of Mbombela Local Municipality with 193 000 (45.58%) of the
households with electricity for lighting and other purposes within Ehlanzeni District
Municipality. The Region with the lowest number of households with electricity for
lighting and other purposes is Thaba Chweu Local Municipality with a total of 30 900
(7.29%) of the total households with electricity for lighting and other purposes within
District.30
PROFILE: EHLANZENI DISTRICT
Electricity for
Electricity for Not using
lighting and other Total
lighting only electricity
purposes
Thaba Chweu 2,776 30,863 4,171 37,810
Nkomazi 12,328 89,949 6,759 109,035
Bushbuckridge 31,187 109,604 4,480 145,271
City of Mbombela 8,021 192,969 12,551 213,541
Total
54,311 423,385 27,961 505,657
Ehlanzeni
Source: IHS Markit Regional eXplorer version 1946
5.4 Waste Management
Ehlanzeni District had a total number of 115 000 (22.77%) households which had their
refuse removed weekly by the authority, a total of 9 480 (1.87%) households had their
refuse removed less often than weekly by the authority and a total number of 346 000
(68.50%) households which had to remove their refuse personally (own dump).
Households by access to refuse removal
100%
Ehlanzeni, 2008-2018
No refuse removal
90%
80%
Personal removal
70% (own dump)
60%
Removed by
50% community
40% members
Removed less often
30% than weekly by
20% authority
Removed weekly
10% by authority
0%
Ehlanzeni Mpumalanga National Total
Source: IHS Markit Regional eXplorer version 1946
The region with the highest number of households where the refuse is removed weekly
by the authority is City of Mbombela Local Municipality with 65 100 or a share of
56.52% of the households where the refuse is removed weekly by the authority within
Ehlanzeni. The region with the lowest number of households where the refuse is
removed weekly by the authority is Bushbuckridge Local Municipality with a total of 8
690 or a share of 7.55% of the total households where the refuse is removed weekly
by the authority within the district municipality.PROFILE: EHLANZENI DISTRICT 31
Available data further indicates in 2008, the households with no formal refuse removal
in Ehlanzeni District were 310 000, and this has increased annually at 2.09% to
381 000 in 2018.
5.5. Transport
The road network within Ehlanzeni, especially in rural areas, is largely of poor
condition and in most instances not surfaced. Most of the surfaced roads are not well
maintained either. Streets in rural residential areas are not surfaced and make
accessibility difficult during rainy seasons. It must be noted, however, that the District
has surfaced a number of roads in the different municipalities towards ensuring better
infrastructure development and easy movement of communities and goods to various
district nodal points.
The District Roads Master Plan was developed and concluded more than 10 year ago
in May of 2009. This was intended at assisting the integration and coordination of the
planning and implementation process followed by the various parties involved in roads
infrastructure, and to address the links between them. Public transport routes within
the area of jurisdiction that had priority consisted of district roads, bus / taxi routes and
major access roads. The process of identifying roads for assessment were done by
means of highlighting the routes which provide access to schools, clinics, places of
worship, cemeteries, police stations and places of public interest.
A total of approximately 6 245km of roads within the Ehlanzeni area of jurisdiction was
assessed and information pertaining to their locality, road name, ownership, surface
type and condition, road width, adequacy of storm water related structures and an
upgrading/maintenance cost estimate was captured and compiled. On average,
approximately 74% of the gravel roads and 30% of the surfaced roads in the various
Local Municipalities require re-alignment and reconstruction, as well as maintenance
and base failure corrections respectively.
6. GOVERNANCE AND MANAGEMENT
6.1. Municipality Performance
Across the District, the Thaba Chweu Local Municipality is the only municipality whose
audit performance has either remained negative or worsened over the last 6 years
between 2013/14 and 2018/19 Financial Years. During this period, their best
performance has been a “qualified audit opinion, with findings”, and this was in the
most recent audit of 2018/19. Prior to that, the municipality consistently received a
disclaimed audit opinion, with findings.
On the other hand, while the Ehlanzeni DM has been receiving “clean audit” over the
years, the most recent audit opinion was an “unqualified opinion, with matters”,
showing signs of regression with regards to the governance of the municipality.32
PROFILE: EHLANZENI DISTRICT
Bushbuckridge LM has also regressed, while the two municipalities of Nkomazi and
City of Mbombela have remained consistent with “unqualified with findings”.
6.2. Municipal Capacity
The following table illustrates the number of vacant and filled senior management
posts as reported in the non-financial statistics of municipalities for the year ended
June 2018. Across the District, inclusive of the local municipalities, the levels of
vacancies in senior management posts are very low, totalling 10 out of 225 posts in
2017 and 7 out of 226 posts in 2018. These statistics suggest a very well capacitated
District.
Table 1: Managerial positions by municipality according to organogram
Source: StatsSA Non-Financial stats 2018
6.3. Traditional Affairs Governance
In the Ehlanzeni District, traditional leaders participate in municipal councils as per
legislative requirements. The traditional leaders were identified in November 2016 by
notice in the Provincial Gazette as required by section 81(2) of the Municipal
Structures Act, 1998.
Traditional Leaders gazetted to participate in Municipal Councils are as per the list
below:
• Ehlanzeni District Municipal Council: 14 Traditional Leaders participate in the
Municipal Council;
• Bushbuckridge Local Municipality: 8 Traditional Leaders participate in the
Municipal Council
• City of Mbombela Local Municipality: 9 Traditional Leaders participate in the
Municipal Council;
• Nkomazi Local Municipality: 7 Traditional Leaders participate in the Municipal
Council; and
• Thaba Chweu Local Municipality: 2 Traditional Leaders participate in the
Municipal Council.You can also read