Modeling the effects of contact-tracing apps on the spread of the coronavirus disease: mechanisms, conditions, and efficiency - Munich Personal ...
←
→
Page content transcription
If your browser does not render page correctly, please read the page content below
Munich Personal RePEc Archive

Modeling the effects of contact-tracing
apps on the spread of the coronavirus
disease: mechanisms, conditions, and
efficiency

Chiba, Asako

Tokyo Foundation for Policy Research

3 October 2020

Online at https://mpra.ub.uni-muenchen.de/103299/
MPRA Paper No. 103299, posted 13 Oct 2020 21:02 UTC
Modeling the effects of contact-tracing apps on the
  spread of the coronavirus disease: mechanisms,
             conditions, and efficiency∗
                                        Asako Chiba†

                                        October 2020

                                           Abstract

          This study simulates the spread of the coronavirus disease (COVID-19) using a
      detailed agent-based model and the census data of Japan to provide a comprehen-
      sive analysis of the effects of contact-tracing apps. The results reveal some crucial
      characteristics of these apps. First, with regard to contacts of those diagnosed
      with COVID-19, the apps that require them to be quarantined upon receiving an
      alert are successful in achieving containment; however, the apps that require them
      to get tested have a limited curve-flattening effect. Second, the former category
      of apps perform better than the latter because they quarantine those who are
      infected but have not become infectious yet; these are individuals who cannot be
      detected by the current testing technology. Third, if the download rate of the apps
      is extremely high, the apps that require quarantine achieve containment with a
      small number of quarantined people, thereby indicating high efficiency. Finally,
      given a fixed download rate, increasing the number of tests per day enhances
      the effectiveness of the apps, although the degree of improved effectiveness is not
      proportional to the change in the number of tests.

  ∗
     I acknowledge data provision from National Statistics Center and financial support from Tokyo
Foudation for Policy Research.
   †
     Tokyo Foundation for Policy Research: asakochiba01@gmail.com.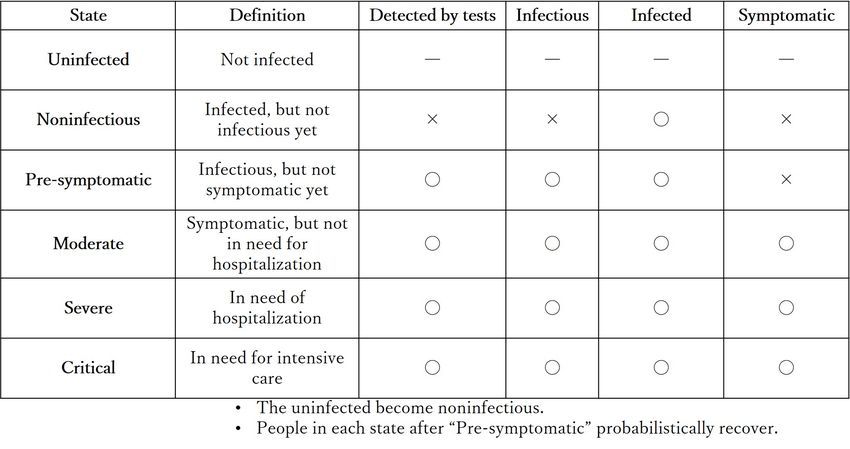
1      Introduction
Contact-tracing apps have gained traction as strong policy tools to prevent the spread
of the coronavirus disease (COVID-19). This is because lockdowns, including social
distancing measures, inevitably force people to cut back on their expenditures and labor
supply, which leads to the long-term contraction of the economy. Although a lockdown
is considered to be effective in impeding the virus spread, many countries are reluctant
to assent to the heavy economic downturn caused by the stagnation in consumption and
production that would materialize if a lockdown were imposed for months. To regain
the level of social activities existing before the COVID-19 pandemic, it is essential that
only those who are assumed to be spreading the virus be isolated from the society.
At this point, testing and tracing strategies offer hope to policy makers, since it helps
in targeting the infected individuals and their contacts. In particular, contact-tracing
apps are expected to work because they shorten the time required to trace the contact
networks (Ferretti et al., 2020) and can be implemented widely and easily due to the
increasing popularity of smartphones.
     Despite their expected effectiveness, little is known about the effects of contact-
tracing apps. However, recent studies have shown that contact-tracing apps have a
significant effect on preventing spread of COVID-19. Hinch et al. [2020] conducted
numerical analyses of the effects of the apps and demonstrated that apps largely reduce
the daily incidents only when more than 56% of the population downloads it. Similarly,
Kucharski et al. [2020] argue that the apps should be downloaded by a sufficiently large
number of people to ensure the effective reproduction number below unity. On the other
hand, Kretzschmar et al. [2020] showed that shortening the delay in getting the test
results and detecting the contacts is crucial. Although these studies provide quantita-
tive support to the view that the apps could successfully flatten the epidemic curve, a
qualitative analysis of the mechanisms behind this finding is absent. In particular, sev-
eral fundamental questions are left unanswered: the reason why these apps drastically
reduce the number of infections, whether their effectiveness can be replicated under
any conditions, and the extent to which these apps are effective compared with the
other policies, such as test-only policy, half-lockdown, and their combinations. Above
all, the trade-offs between the merits and shortcomings involved in adopting these apps
should be discussed, because even if they mitigate the large-scale spread of the virus,
all of the people who come in contact with the diagnosed are required to self-quarantine
regardless of their health status.
     In this context, this study provides a detailed analysis focusing on the effects of the
contact-tracing apps and the mechanisms behind them. These apps notify the individu-
als who have been in contact with those diagnosed and are classified into two categories

                                             1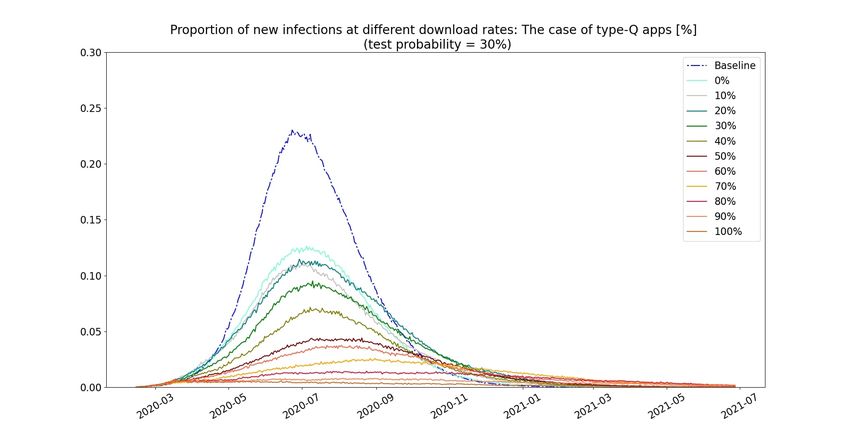
(for details, see Section 2) based on whether they require the notified individual to
quarantine themselves (hereafter referred to as type-Q apps) or to get tested (hereafter,
type-T apps). The existing literature implicitly assumes the apps in their analyses to
belong to the former category. However, this study is new in that type-T apps have
been taken into consideration as well. The analysis employs a detailed agent-based
model, which is largely an extension of the one by Kerr et al. [2020].
    The spread of the virus is simulated by using the individual census data in Japan.
The main findings are as follows:

  1. The apps’ effectiveness depends on their design: With type-Q apps, almost full
     containment can be achieved. The results reveal that type-T apps have a much
     weaker curve-flattening effect than type-Q apps.

  2. The main reason why the type-Q apps perform better than the type-T apps is
     that they quarantine the people who have caught the virus recently but have not
     become infectious yet. Thus, the difference arises not because the tests conducted
     on the notified type-T-app users have 70% sensitivity (which allows 30% of the
     symptomatic to slip through the tests) but rather because the type-Q apps quar-
     antine uninfected people. Since those who have been recently infected cannot be
     detected in the current testing technology, it can be said that type-Q apps rea-
     sonably prevent the expansion of the virus by complementing the limited ability
     of testing.

  3. When type-Q apps are downloaded by a sufficiently large number of people (more
     than 80% of all smartphone-users, which is equivalent to 52% of the total popu-
     lation), it not only drastically reduces the cases but also quarantines only a small
     proportion of people. The reason is as follows: If the download rate is extremely
     low, only a small proportion of those who had contact with the diagnosed re-
     ceive the alert and get quarantined. Although the apps have limited or almost no
     downward pressure on the number of the infected, the low download rate keeps
     the number of quarantined persons small. On the other hand, when the download
     rate is nearly 100%, almost all who had been in contact with the diagnosed are no-
     tified and quarantined. This almost-complete tracing scenario restricts the virus
     spread mainly because the infected are quarantined at the early stage of illness.
     Thus, even if the number of quarantined persons per diagnosed person is large,
     the low number of diagnosed persons eventually leads to only a limited number
     of people being quarantined. In other words, there is a feedback effect between
     the number of the quarantined and that of the infected. If the download rate is
     in the intermediate range, the apps brings only a limited amount of benefits with

                                           2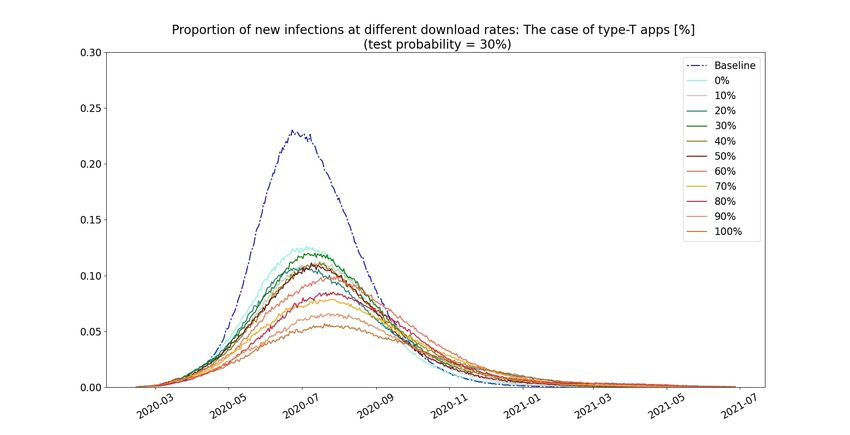
regard to both the prevention of the spread of the virus and the decrease in the
        probability of tracing. As a result, both the number of infected and quarantined
        individuals are kept high.

    4. Given a fixed download rate, increasing the number of daily tests on the symp-
       tomatic persons tends to enhance the effectiveness of the apps, although the degree
       of enhancement is not proportional to the increase in the probability of testing.

This study not only reveals the characteristics of the apps, but also features a qualitative
analysis using an agent-based model. Many studies, including the literature cited above,
present the results of simulations but do not provide sufficiently detailed analysis on
the apps’ mechanisms. The reason is that the models tend to be so complicated that
it is difficult to detect the main factors that generate the results. This is a crucial
shortcoming of the research using an agent-based model, as has been frequently pointed
out (Judd, 2006). The present study overcomes this issue due to the relatively simple
structure of the model: Although many detailed scenarios are introduced, the model,
so far, only deals with epidemics. By conducting counterfactual experiments in various
parameter sets, the analysis reveals the mechanism behind the results, which enables
us to get an intuitive understanding of each scenario.
    The following sections present the model, data, results and analysis, and finally, the
conclusions and perspectives for future research.

2       Model
The analysis employs a detailed agent-based model, which is largely based on the study
by Kerr et al. [2020]. The extension of the model includes the contacts among the
workers in service industries and their customers, the contacts among the elderly living
in the nursing homes and the care workers, super-spreading environments that tend to
arise with a certain probability, 1 people’s jobs as their attributions, people with severe
or critical illnesses automatically being isolated until they recover, and importantly, the
contact-tracing apps with the memory of past contacts.
    The dynamics under no interventions is described in the model as follows: On
the first day, COVID-19 is brought into a hypothetical society and a person becomes
infected. This is followed by the daily transmission of the virus through the contacts,
under the assumption that the community and the service industry contacts are updated
every day. The probability of a susceptible person becoming infected after meeting
with an infectious person depends on the overall infectiousness common to all contacts,
    1
    It is assumed that the transmissibility in randomly selected contacts with probability 20% is 50
times as high as that in the other contacts.(Cave, 2020)

                                                 3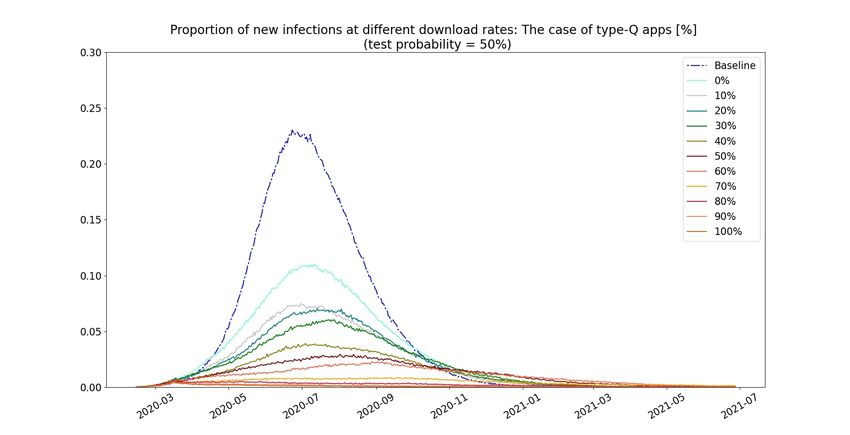
the place where they meet, the relative susceptibility of the former, and the relative
transmissibility of the latter. The place where they meet (referred to as layer) is assumed
to be one of the determinants of the probability of transmission because the frequency
and the time of meeting each other depends on the type of the contact. For instance, if
these two people are linked in the family layer, they spend a longer time together than
in the other types of contacts, such as workplaces and schools. Thus, the probability
that an infected person transmits the virus to their contacts in the family layer is
assumed to be higher than that in the other layers. In addition, the elderly are more
susceptible than the young (see Table 1), and the transmissibility of the virus from the
infected person is higher in the early stage of illness than in the later one.2 The overall
infectiousness of the virus is calibrated by targeting the speed at which the number
of diagnosed persons increased in Japan from January to February, when no specific
policies were in place.3
    Once a person becomes infected, they are initially noninfectious, and therefore,
asymptomatic. Their condition worsens across phases with certain probabilities: They
might become infectious, symptomatic, severely ill, critical, and die, or recover from
each stage (see Table 1 for the definition of each state). The transition probabilities are
computed based on the age-specific data on the infections in Japan with the interval of
10 years, which reveals a higher probability of getting worse for the elderly than for the
young.4 In addition, the number of days it takes for the infected individual to go from
one stage to the next follows a log-normal distribution with the moments exogenously
set, which is also based on the observations (Table 2).5 In reality, people who are
severely ill and critical are hospitalized, or cannot participate in social activities and,
therefore, stay at home. Thus, it is assumed that they have no outside contacts, with
contacts at their homes and nursing homes decreasing by 20% from the levels in normal
times.
    The design of contact-tracing-apps are crucial to determine the performance of the
    2
      The model assumes that the transmissibility of the virus in the early stage of illness is twice as
high as that in the ensuing period. The early stage refers to the first N days after becoming infected,
with N defined as the minimum between the first four days or one-third of the expected duration of
the illness.
    3
      The reported number of diagnosed people was 28 on February 14, and it witnessed a 30-fold
increase in a month.
    4
      The transition probabilities of illness were computed primarily using the number of people in each
stage, as reported on June 10 (Ministry of Health, Labour and Welfare, 2020). The fact that the
reported cases only include the confirmed positive, and that even a small fraction of the symptomatic
could not get tested due to the limited testing capacity, suggests that the true number of the infected
persons should be much higher than the reported cases. According to the report on the antibody-
testing conducted in Tokyo from June 1 to 7, 0.10% of population were antibody positive, whereas the
cumulative number of the confirmed positive as of May 30 accounts for 0.038% (Tokyo Metropolitan
Government, 2020). Thus, the model assumes that the true number of the infected in each age group
is three-fold of the reported cases.
    5
      These parameters are set equal to the default in Kerr et al. [2020].

                                                   4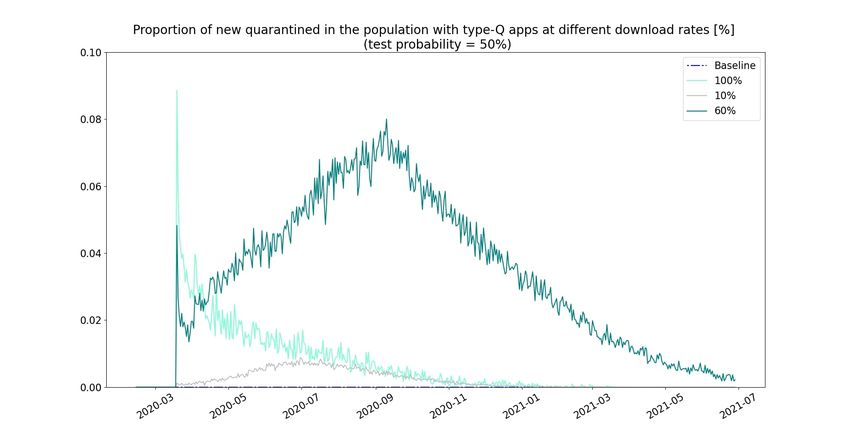
apps. Hinch et al. [2020] assumes that the apps should require those who have contacts
with the symptomatic to stay at home, whereas the apps used in Japan require those
who have contacts with the confirmed positive to get tested. To clarify the relevance of
the configuration of the apps, this analysis compares the difference between the effects
of these two types, calling the one in Hinch et al. [2020] as type-Q and the one applied
in Japan as type-T.
    When testing-and-tracing apps are introduced, a certain fraction of people between
15 and 70 years of age download the apps in the initial period.6 In every period
thereafter, tests are conducted on a daily basis, which implies that randomly selected
symptomatic people are tested, and those who test positive are considered as diagnosed
and, consequently, isolated. It is assumed that it takes a day for the tested persons to
know the results.7 Isolation refers to completely refraining from any type of contact
until recovery, which describes hospitalization in reality. Sensitivity of the tests are set
to 70%, which means that the tests can detect only 70% of the infected people who get
tested. Those who have tested positive and have downloaded the apps register their
diagnosis information as soon as they know the results. The app users are immediately
notified that they had probably been in contact with the diagnosed individual within
the last seven days. The action required to the alerted app users depends on the type
of the apps. In the case where the apps are type-Q, the alerted app users are required
to self-quarantine for 14 days after the notification. People in quarantine reduce their
daily contacts with people outside their homes by 90%, while their contact with their
family members would be as usual; If the apps are type-T, the alerted app users get
tested. If they test positive on the following day, they should commence self-isolation.
    In these scenarios, people are assumed to completely accept the requirement: All of
the app users register the test results if they are diagnosed positive for COVID-19, and
they quarantine themselves on getting the alert in case of the type-Q app. In addition,
the apps in the model are assumed to perceive all the contacts in the past seven days,
without any error. These strong assumptions do not hold in reality. That is, with
regard to people’s behavior, some app users may not register the test results, or may
feel reluctant to self-quarantine. With regard to the technologies, the reports on the
errors in the apps suggest that they may fail to catch a fraction of the contacts, or
   6
     The reported usage rate for smartphones differs across age groups, with a relatively small fraction
of people below 15 and over 70 years of age having one (Ministry of Internal Affairs and Communations
[2018]). For simplicity, the model assumes that only those between the ages 15 and 70, who account
for 65.8% of all population, have smartphones. Moreover, the term download rate denotes the ratio of
the number of app users to the number of smartphone users.
   7
     In reality, it takes about one to three days for the tested individuals to get the results In Japan.
Simulations show that the length of this lag plays an important role in determining the effectiveness of
testing. The lag is set to 1 day in the analysis, since its main scope is how the apps could contribute
to decreasing the cases, rather than the effects of testing.

                                                   5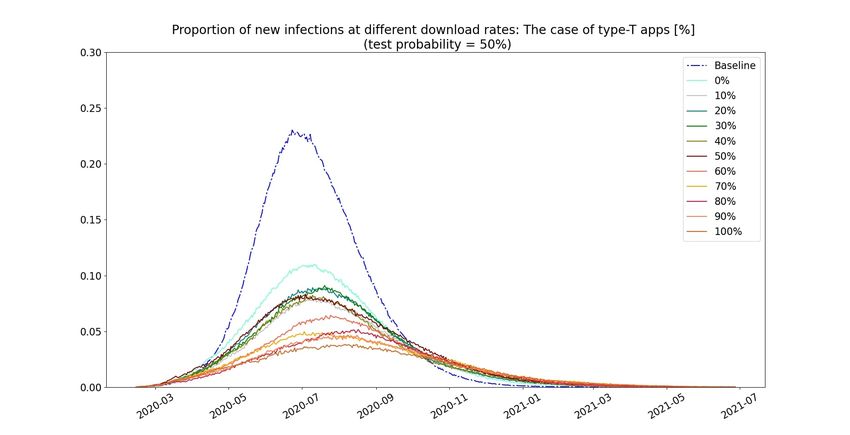
they may count coexistence of two people at a distance with no actual contacts. Such
phenomena are taken into consideration in the simulations, as shown in the section on
robustness check.
    The intra-day events including the interventions as described take place in the fol-
lowing order: First, the community and the service industry contacts are shuffled, and
interventions such as testing, quarantine, and isolation are applied if any. Second, the
susceptibility of the uninfected is computed based on their age and whether they are un-
der the ambit of interventions such as isolation or quarantine during the period; Third,
the transmissibility of the infected is computed based on whether they are in the early
stage of illness and whether they are part of any intervention. Fourth, people come in
contact with each other in each layer. The infected people probabilistically transmit the
virus to those who are uninfected when they meet with the others. Finally, everyone’s
health status is updated reflecting information such as whether they have been infected,
whether their condition has worsened, and whether they have recovered.

                           Table 1: Definition of each state.

                        Figure 1: Age-dependent susceptibility.

                                           6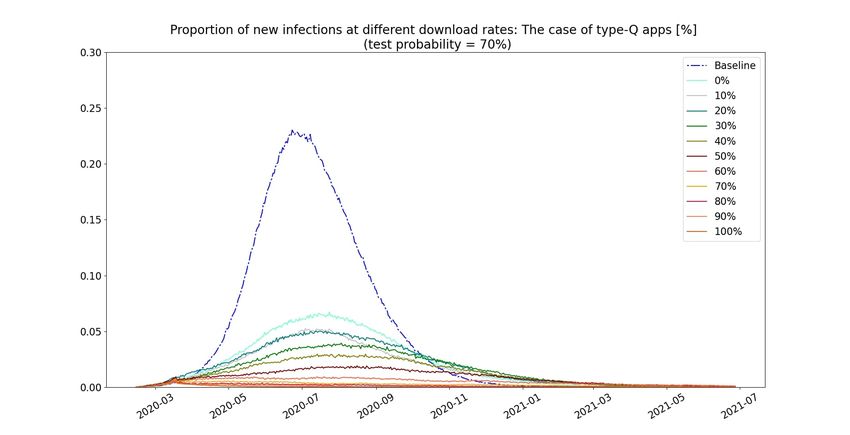
Table 2: Durations and probabilities of state-transition.

3       Data
The analysis uses the individual census data of Japan as of 2015. Data are sampled
as follows: Within 125 million respondents, 25 thousand are randomly selected.8 The
attributes include age, sex, job, employment status, and data on their family members.
Employment status consists of information on whether the respondent is employed,
unemployed, educated, or none of these. Here, education refers to schools only and
does not include kindergartens and nurseries; thus, school-age children are categorized
as ”none of them.” In reality, about 60% of the children below seven years of age go
to kindergartens or nurseries (Cabinet Office, 2019), where the infection could spread.
Therefore, the following analysis, randomly selected 60% of the school-age children are
assumed to go to kindergartens or nurseries. The information on the family members
includes whether the respondents live in their homes or in nursing homes. The analysis
takes into account the community in the nursing homes, since the behavior of the
elderly is thought to be one of the crucial factors that determines the severity of the
virus spread. For each of the employed people, the industry they belong to and the
size of the firm they work for are added as their attributes based on their distributions,
conditional on age and sex as presented in the Economic Census for Business Activities
in 2016.
    8
   The records of those below 15 years and those who answered that they do not go to school are
removed.

                                              7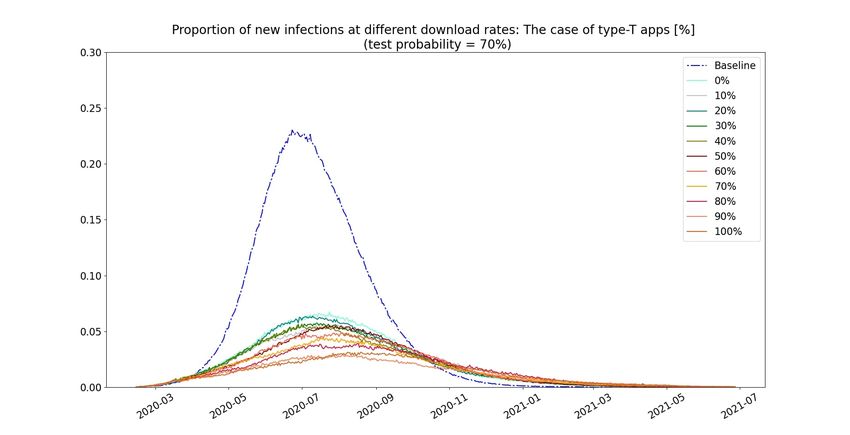
For each of the respondents, a hypothetical family is created based on the informa-
tion on the family members. Each family member’s attributes are assigned following
their distributions, conditional on age and sex, which in turn is obtained from the census
data. This handling, which creates approximately 50 thousand additional hypothetical
people, increases the number of middle-aged and the young individuals who live with
their families. This creates a distortion in the age distribution in population, that is,
the proportion of the elderly so far is estimated to be smaller than that in reality. To
adjust this bias, the number of the elderly who live alone is doubled. In total, the
hypothetical society is populated by 75,614 people.
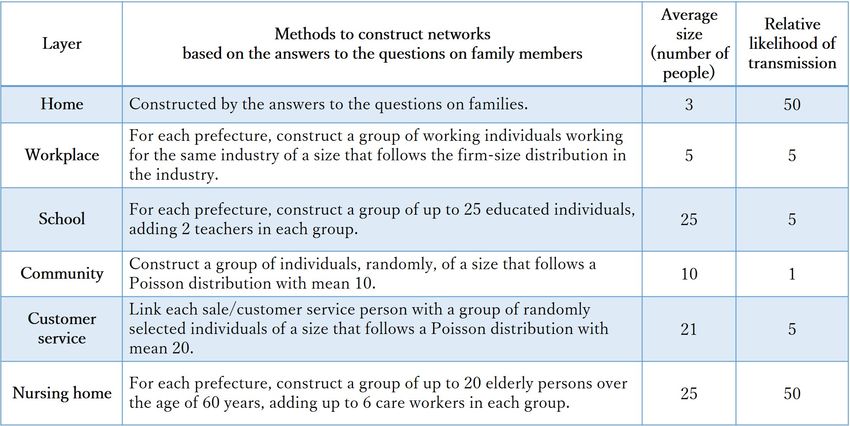
People in the society are assumed to have contacts through the networks in six places
(see Table 3): Family networks are automatically formed when family members are
created. Workplaces are the group of working people who are in the same industry and
the same prefecture, and who work for the same size of firms. Schools comprise a group
of up to 25 children and at most 2 teachers in each prefecture.9 Community contacts
are the networks that link people randomly with an expected size of 10. Similarly,
service industry contacts are the link between service workers and randomly selected
20 people (expected size) for each service worker. The networks in nursing homes are
constructed by grouping up to 20 people over 64 years of age, who live in care facilities,
and adding up to 6 care workers, for each prefecture.10
Table 3: Methods used to create the networks for each layer.
9
The ratio of the number of teachers to students in elementary and junior high schools was about
7% (Ministry of Education, Culture, Sports, Science and Technology, 2008).
10
The guidelines issued by the Ministry of Health, Labour and Welfare set the standard for the
number of care workers in each nursing home to be one-third of the number of the residents.
84 Results
This section presents the simulation results. Each plot shows the average value of the
results obtained in the simulations conducted 100 times. Each scenario assumes that a
randomly selected person gets infected on February 14, when the actual first positive
individual was confirmed in Japan. When comparing the cumulative number of those
who are infected and those who are quarantined, it is necessary that the number of days
simulated is set sufficiently large, such that the peak is attained and the virus outbreak
ends long before the final day of the simulation in each scenario. In this analysis, it is
set to 500 days. Introduction of tests and apps are assumed to take place 33 days after
the initial day and are assumed to be in place until the final day in the simulations.
4.1 Type-T apps
Figures 2a, 2b, and 2c show the simulated timeseries data of the proportion of newly
infected people in the population, under the conditions that daily tests are conducted on
randomly selected 30%, 50%, and 70% of the symptomatic persons, respectively. The
blue dotted line shows the result in the baseline case, where no interventions including
tests and apps are introduced. The other solid lines show the results in the scenarios
where 0% to 100% of the people, of ages between 15 and 70 years, download the type-T
apps: Tests are conducted on a daily basis, the diagnosed register their test results,
and the alerted app users get tested. In any test probability, the number of infections
decreases as the download rate increases: in the extreme case where the download rate
is 100%, the peak value is about one-third of that in the baseline scenario, and the
peak is delayed by one to two months. Although these figures show that type-T apps
flatten the curve, they also indicate the limitation of this type of apps. Even if 70% of
the symptomatic individuals get tested and all the people in the target age group have
downloaded the apps, no less than 0.03% of the population get newly infected at the
peak. This would cause heavy social losses, such as overwhelming hospitals, substantial
increase in subsidies, and stagnations. Thus, it can be said that type-T apps have
limitations in preventing the spread of the virus.
9(a) The case where test probability is 30%.
(b) The case where test probability is 50%.
(c) The case where test probability is 70%.
Figure 2: Proportion of new infections in the population under conditions of daily tests
on randomly selected symptomatic persons: The case of type-T apps.
104.2 Type-Q apps
Similarly, Figures 3a, 3b, and 3c show the simulated timeseries data of the proportion
of newly infected people in the population, under the condition that daily tests are
conducted on randomly selected 30%, 50%, and 70% of the symptomatic, respectively.
The result is compared for the baseline scenario and when type-Q apps are introduced
with the download rates varying from 0% to 100%. Compared with the type-T apps,
type-Q apps have significant effects on flattening the curve: If the probability of daily
tests is 70% and the download rate is 90%, the maximum number of newly infected
individuals after the introduction of the apps is 2 in 75 thousand. In fact, even in
the case where the download rate is 60% with the same probability of tests, or the
download rate is 90% and the probability of tests decreases to 30%, the curve is almost
flat. Although these extremely flattened curves appear only if the download rate is
sufficiently high, these figures indicate the remarkable effectiveness of type-Q apps.
11(a) The case where test probability is 30%.
(b) The case where test probability is 50%.
(c) The case where test probability is 70%.
Figure 3: Proportion of new infections in the population under conditions of daily tests
on randomly selected symptomatic persons: The case of type-Q apps
12A natural question arises as to what drives the difference between the curve-flattening
effects of type-T and type-Q apps. There are three possible factors: Test sensitivity
effect, test target effect, and lockdown effect. The first and the second are related to
the limitations of tests. 70% sensitivity means that 30% of symptomatic people slip
through the tests and possibly spread the virus. In addition, tests can detect only
those who are symptomatic (Sethuraman et al., 2020). Thus, the noninfectious, who
have caught the virus recently and do not have infectiousness yet, cannot be detected.
These factors may lead to the relative inferiority of type-T apps, which requires tests,
to type-Q apps, which requires quarantine instead. Finally, lockdown effect, refers to
the fact that type-Q apps do not distinguish the app users’ health status: The apps
require that all the users who had contacts with the diagnosed should self-quarantine,
including those who are uninfected. For the alerted app users who are uninfected, a
quarantine has a similar effect as a lockdown.
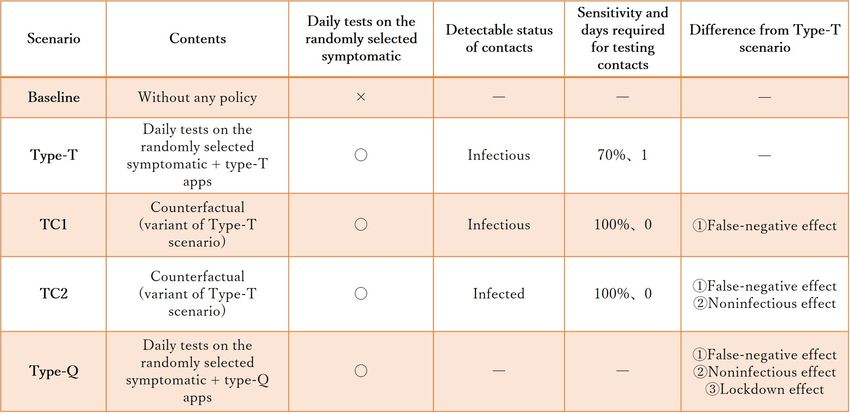
To identify the main driver, counterfactual experiments were conducted, assuming
that there are two hypothetical scenarios (Table 4). In one scenario, TC1, 100% sensi-
tivity of the tests conducted for the alerted app users is assumed. In another scenario,
TC2, these tests can detect not only the symptomatic but also the noninfectious. By
comparing the results in TC1 and those with type-T apps, one can estimate the test
sensitivity effect. Similarly, the difference between the results in TC2 and TC1 mea-
sures the magnitude of test target effect, and the difference between the results with
type-Q apps and TC2 measures the magnitude of the lockdown effect.
Figures 4a, 4b, and 4c show the proportion of the cumulative number of newly
infected people in the population, under the condition that daily tests are conducted
on randomly selected 30%, 50%, and 70% of the symptomatic, and compares the result
in the different scenarios—type-T apps, TC1, TC2, and type-Q apps. The download
rate is varied from 0% to 100%. One can observe that the cumulative infections in
TC1 is fewer than that with type-T apps. However, the difference is not significantly
large to account for the large gap in the results with the type-T and type-Q apps.
Rather, the TC2 results are similar to those of type-Q apps. This observation leads
to the identification of the main factor of the curve-flattening effect of type-Q apps:
they prevent virus outbreak because they quarantine the noninfectious. The result
is consistent with the literature that reports that the silent transmission of the virus
from pre-symptomatic or asymptomatic persons might be the main source of outbreaks
(Moghadas et al., 2020; for a literature review, see Furukawa et al., 2020). From a
practical point of view, the result also suggests the relative effectiveness of semi-targeted
quarantine over testing. In reality, tests cannot detect those who are in the early stage
of illness, although their behavior is the key to determine the speed and the degree of
the transmission of the virus. Thus, type-Q apps complement the limitation of testing
13by quarantining all the app users who had been in contact with the diagnosed, including
those who have just caught the virus.
Table 4: Scenarios to identify the main driver of the effectiveness that type-Q apps
have.
14(a) The case where test probability is 30%.
(b) The case where test probability is 50%.
(c) The case where test probability is 70%.
Figure 4: Proportion of cumulative number of infections in the population under dif-
ferent scenarios.
154.3 Effectiveness of the type-Q apps
So far, the apps have been evaluated by the curve-flattening effect, that is, how many
people have been able to maintain their health. However, the main aim of the policy
debate is to prevent the spread of the virus at low social costs. Thus, efficiency mat-
ters. Since the model does not contain any economic parameters, first, the number of
quarantined individuals and the number of infections were compared. Hereafter, only
type-Q apps are analyzed.
In three plots in Figure 5, the proportion of cumulative number of quarantined
persons in the population is shown on the x-axis; and the proportion of cumulative
number of infections in the population, on the y-axis. The scatter plots depict the
results as the download rate of type-Q apps is varied between 0% and 100%. For
comparison, the result in the baseline scenario is also plotted. Figures 5a, 5b, and 5c
show the results under the condition that daily tests are conducted on randomly selected
30%, 50%, and 70% of the symptomatic, respectivly. The apps are more effective if the
point is located at the bottom-left, because it means that the apps prevent the spread
of the virus with a small fraction of people getting quarantined. The plots illustrate the
case where the symptomatic persons are tested with probability 30%, 50%, and 70%.
Regardless of the probability of testing the symptomatic persons, the apps quarantine
a relatively large number of people if the download rate is around 40% or 50%. The
reason is as follows: If the download rate is extremely low, only a small fraction of those
who had contacts with the diagnosed receive the alert and get quarantined. Although
the apps have limited or almost no downward pressure on the number of the infected,
the low download rate keeps the number of quarantined persons small. On the other
hand, when the download rate is nearly 100%, almost all people who had contacts with
the diagnosed are notified and quarantined. This almost-complete tracing impeded the
virus transmission mainly because the infected are quarantined at an early stage of
their illness, as shown in the previous section. Thus, even if the number of quarantined
per diagnosed person is large, the low number of diagnosed people eventually leads to
the result that only a limited number of people are quarantined. In other words, there
is a feedback effect between the number of the quarantined and that of the infected.
In this context, what happens if the download rate is in the intermediate range? The
apps would neither prevent the spread of the virus nor decrease the probability of
tracing. As a result, both the number of infected and quarantined persons are kept
high. This mechanism can be also observed in the timeseries data. Figure 6 shows
the proportion of newly quarantined people in the population when the daily tests on
symptomatic persons are conducted with a probability of 30%, and the download rate
of the apps is 10%, 60%, or 100%. With the introduction of the apps, if the download
16rate is 100%, the fraction of quarantined people spikes to 0.7% of the total population,
which is nevertheless followed by a decreasing trend. When the download rate is 60%,
the initial spike is lower than in the case of a perfect download rate. However, the
subsequent increase in the numbers shadows the spread of the virus. This leads to a
substantially large fraction of people self- quarantining through the periods.
To analyze the efficiency more deeply, a simple method to estimate the social costs
is applied: compare the product of the number of quarantined people and the duration
of quarantine, and the product of the number of infected people and the duration of
the inactive time.11 Approximating social cost using this method is rationalized by
the fact that people who are in quarantine or isolation cannot participate in economic
activities. Thus, the social costs should increase as the number of isolated/quarantined
people increases, and the duration of isolation/quarantine becomes longer. The dotted
line in each plot in Figure 5 shows at which download rate the apps perform better
than the testing-only scenario: Its intercept is located at the plot in the case where the
download-rate is 0%, and its slope is the ratio of the expected duration of quarantine
(14 days), and that of isolation, conditional on being infected. If a plot is located
beyond this frontier, the apps create a relatively large amount of inactive labor force
and consumption, compared to what is realized under a policy wherein only daily tests
are conducted, and no apps are introduced. If the tests are conducted on 30% of the
symptomatic, apps perform better than the test-only policy, only if they are downloaded
by more than 90% of the people between the ages 15 and 70 years. As the probability
that the symptomatic get tested increases, the apps tend to mitigate the spread of the
virus with a smaller number of people being quarantined. Although the increase in
the test probabilities shifts the frontier downward, the effects are amplified if apps are
introduced, thus the degree of each dot’s shift to the bottom-left is larger than that
of the frontier.12 Overall, the apps perform better than test-only policy regardless of
the probability of testing the symptomatic and the download rate. As the download
rate increases, the efficiency frontier shifts downward: The line that is parallel to the
dotted line and, across the plots, corresponding to each download rate. Although, the
degree of shift is limited if the plot moves to bottom-right. Once the download rate
reaches to the turning point where the plot starts to move to bottom-left, the frontier
moves downward in a larger degree. These results emphasize that the apps, from the
viewpoint of efficiency, should be downloaded by a sufficiently large number of people;
11
See Appendix for the computation of the duration of the inactive time.
12
The increase in the probability of testing the symptomatic not only shifts the frontier downward,
but also moderates its slope. This is because the expected duration of isolation that the infected people
undergo becomes longer as the probability of their being detected positive increases. This leads to the
cost of quarantine being relatively mild compared to that of isolation, which eases the frontier and
widens the effective region. However, this effect is minor compared to the parallel shift of the frontier.
Therefore, the increase in the test probability makes the effective region smaller.
17otherwise, they only have a limited amount of efficiency gain which appears as the
downward shift of the intercept of the frontier. In addition, the results imply that, with
a fixed download rate, increasing the number of daily tests of the symptomatic tends
to enhance the effectiveness of the apps; however, the degree of enhancement is not
proportional to the increase in the probability of testing. For instance, if the download
rate is 90%, the effectiveness gain when the test probability increases from 50% to 70%
is much smaller than that when the test probability increases from 30% to 50%. It is
said that the efficiency of apps may be improved by a limited amount even if the test
probability increases, which holds even more ground, considering that conducting tests
are costly in reality.
18(a) The case where test probability is 30%.
(b) The case where test probability is 50%.
(c) The case where test probability is 70%.
Figure 5: Quarantine and infection when the download rate of type-Q apps are varied.
19Figure 6: Timeseries of the number of quarantined at different download rates.
5 Robustness
As mentioned in section 2, people and apps do not behave as they are expected to:
Some app users may feel reluctant to register the positive test results, and others may
not accept the requirement of self-quarantine even if they receive the alert of having
been in contact with the confirmed positive. With regard to the apps, several errors
are reported.13 Thus, the assumption in the main analysis that all app users will
register the test results and quarantine themselves when they receive the alert, can
be considered as optimistic. Figures 7a, 7b, and 7c depict the relationship between
the cumulative numbers of quarantined and infected individuals, under the assumption
that the probability of registration, apps’ perception rate14 , and probability of self-
quarantining upon receiving the alert are varied between 0% to 100%, respectively.
The daily tests are conducted on the symptomatic randomly selected with probability
of 50%, and the download rate is set to 90%. The first and the last plot exhibit the
same pattern; if these rates decrease to 30%, the number of infections increases, and
as a result, the number of quarantined persons increases, thereby implying that the
apps’ performance has worsened. The results are different when the perception rates
are imperfect, as shown in the second plot. Except for the case where the perception
rate is 10%, the apps’ effects on the number of infected and quarantined persons do
not depend on the perception rate. This is because the apps fail to catch a certain
proportion of the contacts that are randomly selected from all the contacts in the past
seven days. Those who are linked at the layer of homes, nursing homes, schools, and
workplaces meet with each other every day, whereas the contacts in the other layers
13
See, for example, Sugiyama [2020].
14
Perception rate is defined as the probability that the apps detect the contacts
20are shuffled every day. Thus, even if the apps’ perception rate is low, such as 30%, the
transmissions on the layers where contacts are fixed are likely to be traced. Moreover,
in these layers, people tend to stay in close proximity for a long time, which is reflected
in the high likelihood of virus transmission (Table 3). To summarize, the number of the
infected, and accordingly, the number of quarantined individuals, are rarely affected by
the apps’ perception rate, because the key contacts are detected regardless of the apps’
ability.
21(a) The case where the probability of registration is varied.
(b) The case where the perception rate is varied.
(c) The case where the probability of quarantine is varied.
Figure 7: Cases under imperfect registration of test results, perception of contacts, and
quarantine.
226 Conclusion and future research implications
This study, by simulating the spread of the virus using a detailed agent-based model
and census data in Japan, provides a numerical analysis and intuitions on the effects
of contact-tracing apps. Results show some crucial characteristics of the apps. First,
apps’ effectiveness depends on their design: The apps that require the people who had
contacts with the diagnosed to get quarantined upon receiving a notification, are suc-
cessful in achieving containment, whereas the apps that require them to get tested have
limited curve-flattening effect. Second, the main factor due to which the former type
of apps perform better than the latter type is that they quarantine the noninfectious
people who cannot be detected in the current testing technology. Third, if download
rate is extremely high, the former type of apps not only drastically reduce cases, but
also achieve containment at a small number of quarantined people. Finally, given the
download rate of the apps, increasing the number of testing per day enhances the ef-
fectiveness of the apps, although the degree of enhancement is not proportional to the
changes in the number of testing.
There are three possible directions for future research: First, the model can be
extended to incorporate economic parameters. The evaluation of effectiveness here is
quite simple, and hence, leaves room for its development as a tool for economic analysis.
If, for instance, social activities such as consumption and production are linked to the
interaction of people, one would be able to compute how much losses arise from isolation
or quarantine. Second, another important issue, namely the effectiveness of restricting
inter-prefecture migration, or movements across locations within a country, should be
introduced. Finally, the parameters regarding people’s contacts could be more refined.
For example, if there are data such as the attributes of people with whom a person of
a certain age tend to meet with, the contacts in the model can be closer to those in
reality.
Appendix
A. Computation of the duration of the inactive time
The expected duration of being inactive conditional on getting infected is derived by
the following equation:
!
1 X X X
Duration = pas das + paD daD̄ ,
N a∈A s∈S,s6=D a∈A
23where pas denotes the probability with which an infected person belonging to the age
group a in all age groups A recovers at the stage s in all stages S except for death,
and das denotes the duration of their inactive time, and N denotes the total popula-
tion. Similarly, paD and daD̄ denote the probability and the duration of inactive time
, respectively, for those who ultimately die. pas is computed using the figures in Table
2. As for das , an infected person becomes inactive when they get hospitalized or be-
come severely ill. If an infected person is confirmed positive, they are hospitalized and
all of their contact networks become inactive until they recover. Even if the infected
person is unable to get tested, they commence self-quarantine and subsequently pro-
ceed to the severely ill stage. This self-quarantine has almost the same social effect as
hospitalization—because it deactivates all contacts outside their home or the nursing
home (in case of the elderly) until recovery—except that it decreases their community
contacts by 90%. The inactive period ends when they recover. To summarize, das is
derived by the following equation:
!
X X
das = pasMi ((dM − i) + dasS ) + 1− pasMi dasS ,
0of the symptomatic persons, respectively.
B. Model validation
As noted in Section 2, the parameters that characterize the COVID-19 infected cases
are calibrated by the number of people in each stage in each age group, the results
of antibody tests, and the growth rate of cases. Ideally, a model should be validated
by checking whether the result explains the data. A challenge is how to extract the
contribution of target phenomenon from the data. Specifically, people’s behavior, the
main determinant of the cases, is driven by many factors, including announcements and
implementation of interventions, self-protection (such as wearing masks), and people’s
psychology (such as anxiety and fear for the unknown threats of the new virus). The
present analysis abstracts away such issues regarding rigorous model validation. A
backward compatible method would be to compare the results with those in another
model which features similar settings. If the results between these two different but
similar models are consistent, the present model can be said to have validity.
The result that the type-Q apps significantly reduce cases is consistent with the
findings in Hinch et al. [2020], as noted in Section 4.2. To check the validity of the model
from another aspect, this section presents the effects of the lockdown and checks the
consistency with literature. Figure 8a shows the proportion of cases in the population
under lockdown that requires people in all age groups to decrease contacts by 30%,
50%, and 70% (horizontal lockdown). The results indicate that partial lockdown can
substantially flatten the curve only when no less than 70% of contacts are avoided,
which can hardly be maintained for 500 days in reality. In Figure 8b, the lockdown
targets particular age groups and requires them to decrease contacts by 70% (vertical
lockdown): The targets are people of over 60 years, those below 60 years, and people
of all age groups. A lockdown focused on the elderly shows little improvement in cases,
whereas a lockdown only of the younger population shows almost the same transition
of the cases as a full lockdown. The reason is that the elderly account for only a small
proportion of the population and they have lesser contacts than those in the younger
age groups in normal times. The results in the second plot is quite similar to what is
reported by Silva et al. [2020] and Duczmal et al. [2020].
25(a) Horizontal lockdown.
(b) Vertical lockdown.
Figure 8: Cases under horizontal and vertical lockdown.
C. Relation to SIR models
This section provides a perspective to understand how agent-based models are differ-
ent from the susceptible-infected-removed (SIR) models. An obvious difference is that
agent-based models take a bottom-up approach, meaning that the smallest unit in their
structure is an individual, which enables the analyses on inter-relationships among peo-
ple. Fundamentally, this can be interpreted as high-dimensional heterogeneity. That is,
in the agent-based models, each individual is characterized by a variety of attributes and
contacts. In other words, an agent-based model without this diversity is substantially
the same as an SIR model. Based on this view, cases are compared under the scenarios
with different degree of heterogeneity (Table 5). In the baseline scenario, attributes
of individuals, such as residence, age, industry, and job are varied. The layers where
26they form contact networks are distinguished, because the networks are constructed in
accordance with their attributes. The assumption of super-spreader is also taken into
account. In the scenario labelled “Age_Layer_SS Het.”, residence is omitted from the
set of attributes, and thus, contact networks in all the layers link people in the society.
Similarly, the other scenarios partially omit the attributes in the baseline environment.
In each scenario, parameters are set so that their population-averaged value is iden-
tical across scenarios. The results shown in Figure 9 suggest that a scenario with a
high degree of heterogeneity tends to generate smaller estimates of cases than a sce-
nario closer to perfect homogeneity. Specifically, the peak cases under the baseline in
the main analysis with full heterogeneity is less than 10% of those under the scenario
with perfect homogeneity, which can be regarded as a simple SIR model realized in the
present structure. In addition, the peak arrives more than two months later than in the
scenario with homogeneity. Thus, it can be said that multi-dimensional heterogeneity
strongly affects the estimation of cases, and accordingly, the simulated effects of various
policy interventions on virus outbreak.
Table 5: Scenarios with different degree of heterogeneity.
Figure 9: Cases and degree of heterogeneity.
27References
Cabinet Office. Shoshika shakai taisaku hakusho, 2019. URL https://www8.cao.go.jp/
shoushi/shoushika/whitepaper/measures/w-2019/r01pdfhonpen/pdf/s2-2-
2.pdf. [Online; accessed September 1, 2020].
Emma Cave. Covid-19 super-spreaders: Definitional quandaries and implications. Asian
Bioethics Review, page 1, 2020.
Luiz Henrique Duczmal, Alexandre Celestino Leite Almeida, Denise Bulgarelli Duczmal,
Claudia Regina Lindgren Alves, Flávia Costa Oliveira Magalhães, Max Sousa de
Lima, Ivair Ramos Silva, and Ricardo Hiroshi Caldeira Takahashi. Vertical social
distancing policy is ineffective to contain the covid-19 pandemic. Cadernos de Saúde
Pública, 36:e00084420, 2020.
Luca Ferretti, Chris Wymant, Michelle Kendall, Lele Zhao, Anel Nurtay, Lucie Abeler-
Dörner, Michael Parker, David Bonsall, and Christophe Fraser. Quantifying sars-
cov-2 transmission suggests epidemic control with digital contact tracing. Science,
368(6491), 2020.
Nathan W Furukawa, John T Brooks, and Jeremy Sobel. Evidence supporting trans-
mission of severe acute respiratory syndrome coronavirus 2 while presymptomatic or
asymptomatic. Emerging infectious diseases, 26(7), 2020.
Robert Hinch, W Probert, A Nurtay, M Kendall, C Wymant, Matthew Hall, and
C Fraser. Effective configurations of a digital contact tracing app: A report to nhsx.
en. In:(Apr. 2020). Available here. url: https://github. com/BDI-pathogens/covid-
19_instant_tracing/blob/master/Report, 2020.
Kenneth L Judd. Computationally intensive analyses in economics. Handbook of com-
putational economics, 2:881–893, 2006.
Cliff C Kerr, Robyn M Stuart, Dina Mistry, Romesh G Abeysuriya, Gregory Hart,
Katherine Rosenfeld, Prashanth Selvaraj, Rafael C Nunez, Brittany Hagedorn, Lau-
ren George, et al. Covasim: an agent-based model of covid-19 dynamics and inter-
ventions. medRxiv, 2020.
Mirjam E Kretzschmar, Ganna Rozhnova, Martin CJ Bootsma, Michiel van Boven,
Janneke HHM van de Wijgert, and Marc JM Bonten. Impact of delays on effectiveness
of contact tracing strategies for covid-19: a modelling study. The Lancet Public
Health, 2020.
28Adam J Kucharski, Petra Klepac, Andrew Conlan, Stephen M Kissler, Maria Tang,
Hannah Fry, Julia Gog, John Edmunds, CMMID COVID-19 Working Group, et al.
Effectiveness of isolation, testing, contact tracing and physical distancing on reducing
transmission of sars-cov-2 in different settings. medRxiv, 2020.
Ministry of Education, Culture, Sports, Science and Technology. Kyoiku shihyo no kou-
sai hikaku, 2008. URL https://www.mext.go.jp/b_menu/toukei/001/08030520/
010.htm. [Online; accessed September 1, 2020].
Ministry of Health, Labour and Welfare. Shingata-corona uirus kansensho no
kokunai hassei doko, 2020. URL https://www.mhlw.go.jp/content/10906000/
000639025.pdf. [Online; accessed September 1, 2020].
Ministry of Internal Affairs and Communations. Information
and communications in japan, white paper 2018. available at
https://www.soumu.go.jp/johotsusintokei/whitepaper/eng/WP2018/2018-
index.html, page 42, 2018.
Seyed M Moghadas, Meagan C Fitzpatrick, Pratha Sah, Abhishek Pandey, Affan
Shoukat, Burton H Singer, and Alison P Galvani. The implications of silent trans-
mission for the control of covid-19 outbreaks. Proceedings of the National Academy
of Sciences, 117(30):17513–17515, 2020.
Nandini Sethuraman, Sundararaj Stanleyraj Jeremiah, and Akihide Ryo. Interpreting
diagnostic tests for sars-cov-2. Jama, 2020.
Petrônio CL Silva, Paulo VC Batista, Hélder S Lima, Marcos A Alves, Frederico G
Guimarães, and Rodrigo CP Silva. Covid-abs: An agent-based model of covid-19
epidemic to simulate health and economic effects of social distancing interventions.
Chaos, Solitons & Fractals, page 110088, 2020.
Satoshi Sugiyama. Japan’s contact-tracing app suspended again to fix input glitch
preventing alerts, 2020. URL https://www.japantimes.co.jp/news/2020/07/11/
national/japans-contact-tracing-app-glitch/. [Online; accessed September 1,
2020].
Tokyo Metropolitan Government. Kotai hoyu chosa kekka, 2020. URL https:
//www.mhlw.go.jp/content/10906000/000640184.pdf. [Online; accessed September
1, 2020].
29You can also read