Technical Assistance Document for the Reporting of Daily Air Quality - the Air Quality Index (AQI)
←
→
Page content transcription
If your browser does not render page correctly, please read the page content below
Technical Assistance Document
for the Reporting of Daily Air Quality –
       the Air Quality Index (AQI)
EPA-454/B-13-001
December 2013
Technical Assistance Document
for the Reporting of Daily Air Quality –
the Air Quality Index (AQI)
Contact:
David Mintz
U.S. Environmental Protection Agency
Research Triangle Park, North Carolina
U.S. Environmental Protection Agency
Office of Air Quality Planning and Standards
Research Triangle Park, North Carolina 27711TABLE OF CONTENTS Reporting Guidance………………………………………………………… 1 Table 1: Pollutant-Specific Groups…………………………………………2 Pollutant-Specific Health Effects Statements ……..…………………….. 8 Pollutant-Specific Sub-indices and Cautionary Statements …….……………………………………………….10 Table 2: Breakpoints for the AQI .……………………………………….....14 Table 3: Metropolitan Statistical Areas...………………………………… 20 Frequently Asked Questions……………..……………………………….. 23
This guidance is designed to aid local agencies in reporting the air quality using the Air Quality Index
(AQI) as required in Part 58.50 of 40 CFR and according to Appendix G to Part 58 of 40 CFR.

Do I have to report the AQI?

Part 58.50 states that Metropolitan Statistical Areas (MSAs) with a population of more than 350,000
are required to report the AQI daily to the general public. Table A-1 in the Appendix lists all
metropolitan areas with a population of more than 350,000.

How often do I report the AQI?

Appendix G states that MSAs must report the AQI on a daily basis. The appendix further defines daily
as at least five times each week. This definition allows for days when personnel are not available to
provide the AQI report or for equipment failures.

How do I provide the AQI report to the general public?

You may distribute the report to the local media (newspapers, radio, television), provide a recorded
telephone message, or publish the report on a publicly accessible Internet site. Other efforts,
including real-time data reporting and community action programs (e.g., ozone action day programs)
that provide timely air quality information to the public, may be used to meet reporting requirements.

What is in my AQI report?

Your AQI report must contain:

           •   The reporting area(s),
           •   The reporting period,
           •   The critical pollutant,
           •   The AQI,
           •   The category descriptor and, if reported in a color format, the associated color. 1 Use
               only the following names and colors for the six AQI categories:

               For this AQI....                         use this descriptor...        and this color
               0 to 50          .............................................. “Good”       Green
               51 to 100        ....................................... “Moderate”         Yellow
               101 to 150       ...... “Unhealthy for Sensitive Groups”                     Orange
               151 to 200       ....................................... “Unhealthy”         Red
               201 to 300       .............................. “Very Unhealthy”             Purple
               301 and above ....................................“Hazardous”               Maroon
           •   Statements cautioning sensitive groups for all pollutants with an index value over 100.
               Use Table 1 on page on the following page to caution sensitive groups. Statements
               may be combined so that each group is mentioned only once.

       1
                Although a recorded phone message or a radio broadcast can’t show colors, it can name a
               color in the report (e.g. this is a “red” air quality day).

                                                                                                           1
Table 1: Pollutant Specific Sensitive Groups
When this pollutant has an index above 100… Report these Sensitive Groups
Ozone People with lung disease, children, older adults, and
people who are active outdoors are the groups most
at risk
PM2.5 People with heart or lung disease, older adults,
children, and people of lower socioeconomic status
(SES) are the groups most at risk
PM10 People with heart or lung disease, older adults,
children, and people of lower socioeconomic status
are the groups most at risk
CO People with heart disease are the group most at risk
NO2 People with asthma, children, and older adults are
the groups most at risk
SO2 People with asthma, children, and older adults are
the groups most at risk
An AQI report may also contain, but does not require:
• The name and index value for other pollutants, particularly those with an index value
greater than 100,
• The index for sub-areas of the reporting area,
• Actual pollutant concentrations,
• Causes for unusual AQI values,
• Health effects and cautionary language,
• Statements that “blend” health effects and cautionary information for more than one
pollutant, if there is more than one pollutant with an index value greater than 100.
It is important to inform the public when the AQI is above 100. This is why EPA strengthened the
reporting provisions in section 6 of Appendix G in 1999. In particular, whenever the AQI exceeds 100,
reporting agencies should expand reporting to all major news media, and at a minimum, should
include notification to the media with the largest market coverage for the area in question.
2What does an AQI report look like?
NEWSPAPER
Example 1. Newspaper short form in color
Air Quality for Raleigh, N.C.
Air Quality Index
Yesterday’s report: 66
Main pollutant: Particulate Matter
▼
0-50 51-100 101-150 151-200 201-300
Good Moderate Unhealthy, Unhealthy Very
Sensitive unhealthy
groups
▲
Today’s ozone forecast : 38
Example 2. Newspaper short form in black and white
Chicago Tribune
AIR QUALITY
Illinois EPA’s air quality index (AQI):
0-50 is good; 51-100 moderate; 101-150 unhealthy
for sensitive groups; 151-200 unhealthy; 200+
very unhealthy
Tuesday’s reading na
Wednesday’s forecast Good
Critical pollutant Particulate Matter
Example 3. Newspaper longer form
The Air Quality in Baltimore Yesterday
The AIR QUALITY yesterday in Northeast GOOD
Baltimore was Unhealthy for Sensitive
Groups due to ozone. Groups likely to be
sensitive to ozone include active children MODERATE
and adults, and people with respiratory
disease such as asthma. The Air Quality
►
Index was 109 resulting from an ozone UNHEALTHY for SENSITIVE
concentration of 0.079 ppm. Elsewhere in GROUPS
Baltimore, the air quality index was 87 or
Moderate. Since today’s air quality is UNHEALTHY
expected to be much the same, sensitive
groups should consider limiting prolonged
VERY UNHEALTHY
or heavy outdoor exertion.
HAZARDOUS
3TELEVISION
The following is a short script that could be used for a television evening news/weather report. The
graphics used in the report could be much the same as the graphics used in newspaper reports. The
weathercaster must use the descriptors and, if a color format is used, colors for the categories that
are listed above.
Example 4. A short form for television (morning)
“Yesterday the air quality was unhealthy due to ozone, and we expect similar air quality today – in the
red range or around an index of 160, which is unhealthy. Active adults and children and people with
asthma or other respiratory diseases should avoid prolonged physical exertion outside today. In fact,
everyone should consider limiting the time they spend on outdoor exercise or those outside jobs...”
Example 5. A short form for television (evening)
“The air quality index today was 156, a red air quality day. The air stagnation caused a buildup of
ozone to unhealthy levels.”
Example 6. Two long forms for television (evening)
“Air quality today was unhealthy due to ozone, with an index value of 156. The cool front we expected
to come through here tomorrow and blow all this ozone away isn’t going to make it, so the stagnant air
will still be here, making air quality unhealthy. Active children and adults and people with asthma or
other respiratory diseases should avoid prolonged exertion outside tomorrow. In fact, everyone
should consider limiting the time they spend on outdoor exercise or those outside jobs...”
“Tomorrow will be a code red air quality day for Center City. The cold winter air, morning traffic, and
wood smoke are expected to cause particle pollution to rise to unhealthy levels. People with heart or
lung disease, older adults, and children should avoid strenuous activities.”
TELEPHONE
Recorded telephone messages can be used to give more up-to-date information on the air quality. For
example, the following script has been used:
Example 7. A script for telephone
“As of 10:00 a.m., the air quality index is 45 which is a good or “green” air quality day. The
responsible pollutant is ozone.”
INTERNET
Most State and local agencies report the AQI on their public Web sites. The data available on the
Web site are typically up to the most recent hour. Links to these sites can be found in the “Where I
Live” section of the AirNow Web site, at www.airnow.gov.
Example 8. A short form for a Web page
4Air Quality Index for St. Louis, MO
Time of this report: 1:00PM AQI: 110 Code: Orange
Responsible pollutant: Ozone Category: Unhealthy for Sensitive Groups
Example 9. A long form for a Web page- ozone
Air Quality Index for Chicago, IL for August 2
Report as of: 2:00PM AQI: 162 Responsible pollutant: Ozone
Code: Red Category: Unhealthy
Sensitive groups: Active children and adults, and people with lung disease, such as asthma,
should reduce prolonged or heavy outdoor exertion.
Health effects: Greater likelihood of respiratory symptoms and breathing difficulty in
sensitive groups, possible respiratory effects in the general population.
HEALTH Children and adults who are active outdoors, and people with lung
ADVISORY disease, such as asthma should avoid moderate exertion outdoors,
everyone else (especially children) should limit prolonged or heavy
outdoor exertion.
Air Quality in South Chicago - Gary, IL AQI: 122 (Unhealthy for Sensitive Groups)
Tomorrow’s air quality in Chicago is Unhealthy for Sensitive Code: Orange
predicted to be: Groups
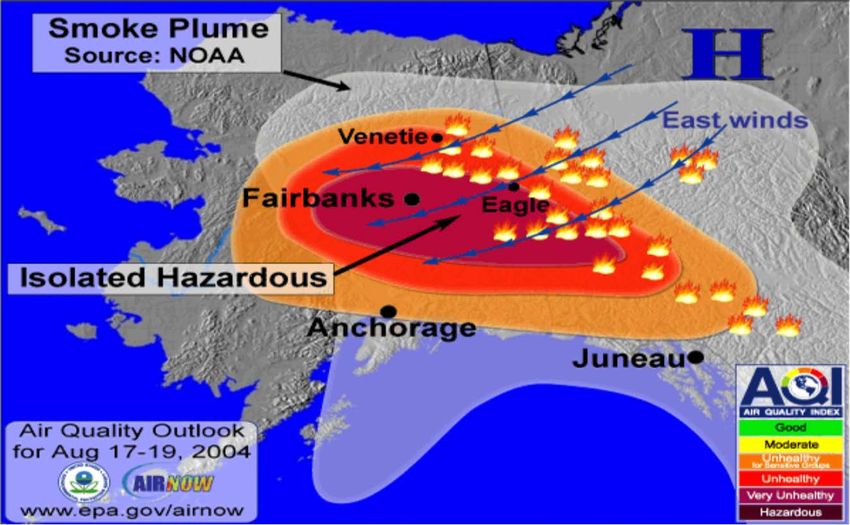
5Example 10. A long form for a Web page- particulate matter
Anchorage, Alaska
Alaska Department of Environmental Conservation (DEC) Issues Statewide Air Quality
Advisory-
The AQI levels have been steadily increasing from Moderate to Unhealthy. Dense smoke advisory
has been issued by the National Weather Service for the Fairbanks area for today and tonight. Poor
air quality conditions are expected to persist for the next several days as a high pressure system to
the northeast drives easterly winds and smoke to the Fairbanks area.
Health Tip: Everyone should avoid any outdoor exertion; people with respiratory or heart disease, the
elderly, and children should remain indoors.
Source: Alaska Department of Environmental Conservation and United States Environmental
Protection Agency.
6What colors do I use in my AQI report?
If you report the Air Quality Index in a color format, the appropriate colors are specified in Appendix G
as the following:
For this category ... ... use this color
Good Green
Moderate Yellow
Unhealthy for Sensitive Groups Orange
Unhealthy Red
Very Unhealthy Purple
Hazardous Maroon
Specific colors are defined in the table below for red, green, blue (RGB) and cyan, magenta, yellow,
and black (CMYK) color formulas:
Color R G B C M Y K
Green 0 228 0 40 0 100 0
Yellow 255 255 0 0 0 100 0
Orange 255 126 0 0 52 100 0
Red 255 0 0 0 100 100 0
Purple 143 63 151 51 89 0 0
Maroon 126 0 35 30 100 100 30
Notes: The RGB model is traditionally used for screen colors, while CMYK is traditionally used for printing
processes. The color models are based on a 0 - 255 scale (e.g. 50% is 126).
What health effects and cautionary statements should I use in my report?
The most recent health effect information used with the AQI is pollutant-specific. The following table
lists the different health effects messages, sensitive groups, and cautionary statements for each
pollutant in the AQI.
7Pollutant-Specific Sub-indices and Health Effects Statements
for Guidance on the Air Quality Index (AQI)
Carbon Monoxide (ppm) Sulfur Dioxide Nitrogen Dioxide
AQI Ozone (ppm) Particulate Matter (μg/m3)
[8-hour] (ppb) (ppb)
Categories: [8-hour] [1-hour] PM [24-hour] [24-hour] [1-hour] [1-hour]
Index Values 2.5 PM10
Good 0 - 0.059 - 0 – 12.0 0 – 54 0 – 4.4 0 - 35 0 - 53
(Up to 50) None None None None None None
Moderate 0.060 - 0.075 - 12.1 – 35.4 55 – 154 4.4 – 9.4 36 - 75 54 - 100
(51 - 100) None None None
Unusually sensitive
Respiratory symptoms possible in unusually
individuals may
sensitive individuals, possible aggravation of heart
experience respiratory
or lung disease in people with cardiopulmonary
symptoms.
disease and older adults.
Unhealthy for 0.076 - 0.095 0.125 - 0.164 35.5 – 55.4 155 – 254 9.5 – 12.4 76 - 185 101 - 360
Sensitive Groups Increasing likelihood of Increasing likelihood of Increasing likelihood of
(101 - 150) Increasing likelihood of respiratory symptoms Increasing likelihood of respiratory symptoms in reduced exercise respiratory symptoms, respiratory symptoms,
and breathing discomfort in people with lung sensitive individuals, aggravation of heart or lung tolerance due to increased such as chest tightness such as chest tightness
disease, such as asthma, children, older adults disease and premature mortality in people with cardiovascular symptoms, and breathing discomfort, and breathing discomfort,
and outdoor workers. cardiopulmonary disease, older adults, and people such as chest pain, in in people with asthma. in people with asthma.
of lower SES. people with heart disease.
Unhealthy 0.096 - 0.115 0.165 - 0.204 55.5 – 150.4 254 – 354 12.5 – 15.4 186 - 304 361 - 649
(151 - 200) Reduced exercise Increased respiratory Increased respiratory
Greater likelihood of respiratory symptoms and Increased aggravation of heart or lung disease and
tolerance due to increased symptoms, such as chest symptoms, such as chest
breathing difficulty in people with lung disease, premature mortality in people with cardiopulmonary
cardiovascular symptoms, tightness and wheezing in tightness and wheezing in
such as asthma, children, older adults, and disease, older adults, and people of lower SES;
such as chest pain, in people with asthma; people with asthma;
outdoor workers; possible respiratory effects in increased respiratory effects in general population.
people with heart disease. possible aggravation of possible aggravation of
general population.
other lung diseases. other lung diseases.
8Very Unhealthy 0.116 - 0.374 0.205 - 0.404 150.5 – 250.4 355 – 424 15.5 – 30.4 305 – 604 [24-hour] 650 - 1249
(201 - 300) Significant aggravation of Significant increase in Significant increase in
Increasingly severe symptoms and impaired Significant aggravation of heart or lung disease and cardiovascular symptoms, respiratory symptoms, respiratory symptoms,
breathing likely in people with lung disease, premature mortality in people with cardiopulmonary such as chest pain, in such as wheezing and such as wheezing and
such as asthma, children, older adults, and disease, older adults, and people of lower SES; people with heart disease. shortness of breath, in shortness of breath, in
outdoor workers; increasing likelihood of significant increase in respiratory effects in general people with asthma; people with asthma;
respiratory effects in general population. population. aggravation of other lung aggravation of other lung
diseases. diseases.
Hazardous - 0.405 - 0.604 250.5 – 500.4 425 – 604 30.5 – 50.4 605 – 1004 [24-hour] 1249 - 2049
(301 - 500) Serious aggravation of Severe respiratory Severe respiratory
Severe respiratory effects and impaired Serious aggravation of heart or lung disease and cardiovascular symptoms, symptoms, such as symptoms, such as
breathing likely in people with lung disease, premature mortality in people with cardiopulmonary such as chest pain, in wheezing and shortness of wheezing and shortness of
such as asthma, children, older adults and disease, older adults, and people of lower SES; people with heart disease; breath, in people with breath, in people with
outdoor workers; increasingly severe serious risk of respiratory effects in general impairment of strenuous asthma; increased asthma; increased
respiratory effects likely in general population. population. activities in general aggravation of other lung aggravation of other lung
population. diseases; possible diseases; possible
respiratory effects in respiratory effects in
general population. general population.
9Pollutant-Specific Sub-indices and Cautionary Statements
for Guidance on the Air Quality Index (AQI)
AQI Ozone (ppm) Particulate Matter (μg/m3) Carbon Monoxide Sulfur Dioxide Nitrogen Dioxide
(ppm) (ppb) (ppb)
Categories [8-hour] [1-hour] PM [24-hour] [24-hour] [8-hour] [1-hour] [1-hour]
(Index 2.5 PM10
Values)
Good 0 - 0.059 0 – 12.0 0 - 54 0 – 4.4 0 - 35 0 - 53
(Up to 50) None None None None None None
Moderate 0.060 - 0.075 12.1 – 35.4 55 – 154 4.5 – 9.4 36 - 75 54 - 100
(51 - 100) None None Unusually sensitive
Unusually sensitive Unusually sensitive people should consider
individuals should
people should reducing prolonged or heavy exertion.
consider limiting
consider reducing
prolonged exertion
prolonged or heavy
especially near busy
outdoor exertion.
roads.
Unhealthy for 0.076 - 0.095 0.125 - 0.164 35.5 – 55.4 155 – 254 9.5 – 12.4 76 - 185 101 - 360
Sensitive Groups People with heart disease, People with asthma People with asthma,
(101 - 150) People with lung disease, such as asthma, People with heart or lung disease, older adults, such as angina, should should consider limiting children and older adults
children, older adults, and outdoor workers children, and people of lower SES should reduce limit heavy exertion and outdoor exertion. should limit prolonged
should reduce prolonged or heavy outdoor prolonged or heavy exertion. avoid sources of CO, such exertion especially near
exertion. as heavy traffic. busy roads.
10Unhealthy 0.096 - 0.115 0.165 - 0.204 55.5 – 150.4 255 – 354 12.5 – 15.4 186 – 304 361 - 649
(151 - 200)
People with lung disease, such as asthma, People with heart or lung disease, older adults, People with heart disease, Children, people with People with asthma,
children, older adults, and outdoor workers children, and people of lower SES should avoid such as angina, should asthma, or other lung children and older adults
should avoid prolonged or heavy outdoor prolonged or heavy exertion; everyone else should limit moderate exertion diseases, should limit should avoid prolonged
exertion; everyone else should reduce reduce prolonged or heavy exertion. and avoid sources of CO, outdoor exertion. exertion near roadways;
prolonged or heavy outdoor exertion. such as heavy traffic. everyone else should
limit prolonged exertion
especially near busy
roads.
Very Unhealthy 0.116 - 0.374 0.205 - 0.404 150.5 – 250.4 355 – 424 15.5 – 30.4 305 – 604 [24-hour] 650 - 1249
(201 - 300) People with heart disease, Children, people with People with asthma,
such as angina, should asthma, or other lung children and older adults
People with lung disease, such as asthma, People with heart or lung disease, older adults, avoid exertion and diseases should avoid should avoid all outdoor
children, older adults, and outdoor workers children, and people of lower SES should avoid all sources of CO, such as outdoor exertion; everyone exertion; everyone else
should avoid all outdoor exertion; everyone physical activity outdoors. Everyone else should heavy traffic. else should reduce should avoid prolonged
else should reduce outdoor exertion. avoid prolonged or heavy exertion. outdoor exertion. exertion especially near
busy roads.
Hazardous
- 0.405 - 0.604 250.5 – 500.4 425 – 604 30.5 – 50.4 604 – 1004 [24-hour] 1250 - 2049
(301 - 500) People with heart disease, Children, people with People with asthma,
such as angina, should asthma, or other lung children and older adults
Everyone should avoid all outdoor exertion. Everyone should avoid all physical activity outdoors;
avoid exertion and diseases, should remain should remain indoors;
people with heart or lung disease, older adults,
sources of CO, such as indoors; everyone else everyone else should
children, and people of lower SES should remain
heavy traffic; everyone should avoid outdoor avoid all outdoor
indoors and keep activity levels low.
else should limit heavy exertion. exertion.
exertion.
11Classifications and cautionary statements in Spanish:
Use estas tarjetas para entender los efectos de la contaminación del aire cuando escuche las noticias
del Indice de la Calidad del Aire.
Valores del
Clasificación Precauciones para Protegerse del Ozono
Índice
0 a 50 Buena Ninguna.
Las personas extraordinariamente sensitivas deben
51 a 100 Moderada considerar limitar los esfuerzos prolongados al aire
libre.
Los niños y adultos activos, y las personas con
101 a 150 Dañina a la Salud de
enfermedades respiratorias, tales como el asthma,
los Grupos
deben limitar los esfuerzos prolongados al aire libre.
Sensitivos
Los niños y adultos activos, y las personas con
enfermedades respiratorias, tales como el asthma,
151 a 200 Dañina a la Salud deben evitar el esfuerzo prolongado al aire libre; todos
los demás, especialmente los niños, deben limitar el
esfuerzo prolongado al aire libre.
Los niños y adultos activos, y las personas con
enfermedades respiratorias tales como el asthma,
Muy Dañina a la
201 a 300 deben evitar cualquier esfuerzo al aire libre; todos los
Salud
demás, especialmente los niños, deben limitar los
esfuerzos al aire libre.
Se ha asignado un color específico a cada categoría de AQI. Por ejemplo, el rojo significa
condiciones “dañinas a la salud” y el púrpura significa condiciones “muy dañinas a la salud”. Este
esquema de colores puede ayudarle a determinar rápidamente si los contaminantes del aire están
alcanzando niveles muy dañinos a la salud en su zona.
12How do I calculate the AQI from pollutant concentration data?
The AQI is the highest value calculated for each pollutant as follows:
a. Identify the highest concentration among all of the monitors within each reporting area and truncate
as follows:
Ozone – truncate to 3 decimal places
PM2.5 – truncate to 1 decimal place
PM10 – truncate to integer
CO – truncate to 1 decimal place
SO2 – truncate to integer
NO2 – truncate to integer
b. Using Table 2, find the two breakpoints that contain the concentration.
c. Using Equation 1, calculate the index.
d. Round the index to the nearest integer.
Equation 1:
I Hi − I Lo
Ip = (C − BPLo ) + I Lo .
BPHI − BPLo p
Where Ip = the index for pollutant p
Cp = the rounded concentration of pollutant p
BPHi = the breakpoint that is greater than or equal to Cp
BPLo = the breakpoint that is less than or equal to Cp
BPHi = the breakpoint that is greater than or equal to Cp
IHi = the AQI value corresponding to BPHi
ILo = the AQI value corresponding to BPLo
13Table 2: Breakpoints for the AQI
These Breakpoints... ...equal …and this
this AQI category
O3 O3 PM10 PM2.5 CO SO2 NO2 AQI
(μg/m )
3 3
(ppm) (ppm) (μg/m ) (ppm) (ppb) (ppb)
1 24-hour
8-hour 1-hour 24-hour 8-hour 1-hour 1-hour
0.000 - - 0 - 54 0.0 – 0.0 - 4.4 0 - 35 0 - 53 0 - 50 Good
0.059 12.0
0.060 - - 55 - 154 12.1 - 4.5 - 9.4 36 - 75 54 - 100 51 - 100 Moderate
0.075 35.4
0.076 - 0.125 - 155 - 35.5 - 9.5 - 76 - 185 101 - 101 - 150 Unhealthy for
0.095 0.164 254 55.4 12.4 360 Sensitive Groups
0.096 - 0.165 - 255 - (55.5 - 12.5 - (186 - 361 - 151 - 200 Unhealthy
0.115 0.204 354 150.4)3 15.4 304)4 649
0.116 - 0.205 - 355 - (150.5 - 15.5 - (305 - 650 - 201 - 300 Very unhealthy
0.374 0.404 424 (250.4)3 30.4 604)4 1249
(2) 0.405 - 425 - (250.5 - 30.5 - (605 - 1250 - 301 - 400
Hazardous
0.504 504 (350.4)3 40.4 804)4 1649
(2) 0.505 - 505 - (350.5 - 40.5 - (805 - 1650 - 401 - 500
Hazardous
0.604 604 500.4)3 50.4 1004)4 2049
1
Areas are generally required to report the AQI based on 8-hour ozone values. However, there are a small
number of areas where an AQI based on 1-hour ozone values would be more precautionary. In these cases, in
addition to calculating the 8-hour ozone index value, the 1-hour ozone value may be calculated, and the
maximum of the two values reported.
2
8-hour O3 values do not define higher AQI values (≥ 301). AQI values of 301 or higher are calculated with 1-
hour O3 concentrations.
3
If a different SHL for PM2.5 is promulgated, these numbers will change accordingly.
4
1-hour SO2 values do not define higher AQI values (≥ 200). AQI values of 200 or greater are calculated with
24-hour SO2 concentrations.
14How do I use the table and the equation and my concentration data to calculate the AQI?
Suppose you have an 8-hour ozone value of 0.08753333. First, round off the value to 0.087. Then
refer to the 8-hour ozone in table 2 for the values that fall above and below your value (0.076-0.095).
In this case, the 0.087 value falls within the index values of 101 to 150. Now you have all the
numbers needed to use the equation.
(150 − 101) 49
(.087 −.076) + 101 = .011 + 101 = 129.368 = 129
(.095 −.076) .019
So an 8-hour value of 0.08753333 corresponds to an index value of 129.
What if I have values for more pollutants?
Suppose you have an 8-hour ozone value of 0.077 ppm, a PM2.5 value of 35.9 μg/m3, and a CO value
of 8.4 ppm. You apply the equation 3-times:
(150 − 101 )
O3: (.077 −.076 ) + 101 = 104
(.095 −.076 )
(150 − 101 )
PM : (35.9 − 35 .5) + 101 =102
( 55.4 − 35 .5)
(100 − 51 )
CO: ( 8.4 − 4.5) + 51 = 90
( 9.4 − 4.5)
The AQI is 104, with ozone as the responsible pollutant.
How do I use both ozone 1-hour and 8-hour values?
You must calculate the 8-hour values, and you may also calculate the 1-hour values. If you calculate
both, you must report the higher AQI value.
Suppose you had a 1-hour value of 0.162ppm and an 8-hour value of 0.141 ppm. Then you apply the
equation twice:
(300 − 201)
1 − hr: (.162−.155) + 201 = 204
(.404−.155)
(300 − 201)
8 − hr: (.141−.116) + 201 = 211
(.374−.116)
In this case, the index is 211 (the maximum of 204 and 211) and the responsible pollutant is ozone.
15How do I calculate AQI values for SO2?
EPA strengthened the primary standard for SO2 in 2010. Because there was not enough health
information to inform changing the upper end of the AQI for SO2, the upper end continues to use the
24-hour average SO2 concentration. The lower end of the AQI uses the new daily max 1-hour SO2
concentration.
If you have a daily max 1-hour SO2 concentration below 305 ppb, then use the breakpoints in Table 2
to calculate the AQI value.
If you have a 24-hour average SO2 concentration greater than or equal to 305 ppb, then use the
breakpoints in Table 2 to calculate the AQI value. If you have a 24-hour value in this range, it will
always result in a higher AQI value than a 1-hour value would.
On rare occasions, you could have a day where the daily max 1-hour concentration is at or above 305
ppb but when you try to use the 24-hour average to calculate the AQI value, you find that the 24-hour
concentration is not above 305 ppb. If this happens, use 200 for the lower and upper AQI breakpoints
(ILo and IHi) in Equation 1 to calculate the AQI value based on the daily max 1-hour value. This
effectively fixes the AQI value at 200 exactly, which ensures that you get the highest possible AQI
value associated with your 1-hour concentration on such days.
What do I do with concentrations for pollutants that have blank places in the table for
Breakpoints for the AQI?
Disregard those numbers. Suppose you had a 1-hour ozone value of 0.104ppm and an 8-hour ozone
value of 0.087ppm. First you disregard the 1-hour ozone value because it is less than 0.125ppm.
Then you calculate the index for the 8-hour ozone value as before:
(150 − 101)
(.087−.076) + 101 = 129.368
(.095−.076)
This value rounds to 129.
Are there exceptions to these reporting requirements?
Yes. When you have low index values that meet the following criteria, you do not have to meet all the
requirements. If the index for a specific pollutant remains below 50 for an extended period of time (for
example, for that particular season), then you are not required to include this pollutant in the
calculation of the AQI.
The final rule allows agencies to discontinue reporting for any pollutant if index values for that
pollutant have been below 50 for an entire season or a year. However, this does not hold if in
subsequent years’ pollutant levels rise so that index values for that pollutant would be above 50 and
the criteria for an exemption are no longer met. In these cases, section 8 of appendix G now requires
that the responsible agency must again report the AQI.
16Do I have to forecast pollutant concentrations for the AQI report?
Although not required, you are encouraged to forecast values at least 24 hours in advance. The AQI
is designed to inform members of sensitive groups and the general population so that they may
choose to reduce or avoid exposure to certain levels and types of air pollution. If the information is
not timely, the public cannot make this choice. However, good forecasts may require data,
computational resources and expertise that may be unavailable to you. The EPA provides guidance if
you are interested in starting a forecasting program for AQI reporting in your Metropolitan Statistical
Area (MSA).
Since ozone is a dominant pollutant in AQI reporting and the form of the ozone standard is an 8-hour
average, the timing of how the public is informed is an important issue, even if you have decided not
to forecast 24 hours in advance. In order for potentially affected people to take advantage of this
information, it is necessary to consider at least a short term forecast or prediction of 8-hour ozone
levels for the purposes of reporting the AQI. You can do this with very little additional resources; the
method you can use relies on the high correlation between daily maximum of 8-hour ozone and 1-
hour ozone values. A simple linear regression can be calculated on daily max data at any site. From
this regression, you can predict that the 8-hour ozone maximum for a day will be at least the
corresponding maximum 8-hour value, given the present 1-hour value. From this information, you can
estimate the AQI without having to wait for the full 8-hour maximum to be observed.
What if the correlation at my site is low- can I still forecast the AQI?
The lowest observed correlation at any site reporting to AIRS data was 0.86, which is adequate to
predict the maximum 8-hour values from the maximum 1-hour for reporting the AQI. However, if you
feel uncomfortable from either a public health or cost viewpoint, you may want to use a confidence
interval for the decision you make based on the predicted 8-hour maximum. For example, if your
ozone action day is declared when you reach the unhealthy category and you predict an unhealthy
day but are unsure whether or not you should call an “ozone action day” based on this prediction, you
can use the confidence interval of the predicted value to trigger your decision. If you are concerned
about public health, you might consider calling an “ozone action day” as soon as the upper bound of
the confidence interval is greater than the AQI cut-point for the unhealthy category. If you are
concerned with the cost of calling an “ozone action day” unnecessarily, then you might consider
calling an ozone action day only when the lower bound of the confidence interval is above the cut-
point for the unhealthy category.
Is there anything else I should know about reporting the AQI?
For further information, go to www.epa.gov/airnow. Under “Publications,” there are several
informative documents to help you report the AQI, including the ones listed:
• AQI brochure • Pamphlets:
• AQI calculator program -Ozone Pollution and your Health
• Forecasting guidance -Particle Pollution and your Health
• Air quality guides for: -Smog: Who does it Hurt?
-Ozone • Medical poster
-Particle pollution • Ozone web course for health care
providers
17How do I calculate the upper and lower bounds of the confidence interval for the predicted
maximum 8-hour ozone value?
Most computer regression programs include the error variance, or the residual variance, or the
variance of “Y given X” as part of the output. Call this Se2. Then you calculate the upper and lower
bounds of the predicted value as:
1 ( x ' − x )2
upper: Y + t1−α / 2 , n −2 S e 1 + +
2
n ( n − 1 ) S x2
1 ( x ' − x )2
lower: Y − t1−α / 2 , n −2 S e 1 + +
2
n ( n − 1 ) S x2
Where:
Y is the predicted 8-hour ozone maximum,
t1-α/2,n-2 is a tabulated Student’s-T value corresponding to a two sided (1- α)100% confidence
interval with n-2 degrees of freedom,
Se2 is the error variance described above,
x! is the 1-hour value used to predict the 8-hour value,
x is the average of the 1-hour values, and
2
Sx is the variance of the 1-hour values.
The value α is arbitrary, but conventionally it is set to 0.05 corresponding to a 95% confidence
interval.
18APPENDIX
19Table 3: Metropolitan Statistical Areas with over 350,000 population (2010 Census)
CBSA code Geographic Area 2010 Census
10420 Akron, OH 703,200
10580 Albany-Schenectady-Troy, NY 870,716
10740 Albuquerque, NM 887,077
10900 Allentown-Bethlehem-Easton, PA-NJ 821,173
11260 Anchorage, AK 380,821
11700 Asheville, NC 424,858
12060 Atlanta-Sandy Springs-Marietta, GA 5,268,860
12260 Augusta-Richmond County, GA-SC 556,877
12420 Austin-Round Rock-San Marcos, TX 1,716,289
12540 Bakersfield-Delano, CA 839,631
12580 Baltimore-Towson, MD 2,710,489
12940 Baton Rouge, LA 802,484
13140 Beaumont-Port Arthur, TX 388,745
13820 Birmingham-Hoover, AL 1,128,047
14260 Boise City-Nampa, ID 616,561
14460 Boston-Cambridge-Quincy, MA-NH 4,552,402
14860 Bridgeport-Stamford-Norwalk, CT 916,829
15180 Brownsville-Harlingen, TX 406,220
15380 Buffalo-Niagara Falls, NY 1,135,509
15940 Canton-Massillon, OH 404,422
15980 Cape Coral-Fort Myers, FL 618,754
16700 Charleston-North Charleston-Summerville, SC 664,607
16740 Charlotte-Gastonia-Rock Hill, NC-SC 1,758,038
16860 Chattanooga, TN-GA 528,143
16980 Chicago-Joliet-Naperville, IL-IN-WI 9,461,105
17140 Cincinnati-Middletown, OH-KY-IN 2,130,151
17460 Cleveland-Elyria-Mentor, OH 2,077,240
17820 Colorado Springs, CO 645,613
17900 Columbia, SC 767,598
18140 Columbus, OH 1,836,536
18580 Corpus Christi, TX 428,185
19100 Dallas-Fort Worth-Arlington, TX 6,371,773
19340 Davenport-Moline-Rock Island, IA-IL 379,690
19380 Dayton, OH 841,502
19660 Deltona-Daytona Beach-Ormond Beach, FL 494,593
19740 Denver-Aurora-Broomfield, CO 2,543,482
19780 Des Moines-West Des Moines, IA 569,633
19820 Detroit-Warren-Livonia, MI 4,296,250
20500 Durham-Chapel Hill, NC 504,357
21340 El Paso, TX 800,647
21660 Eugene-Springfield, OR 351,715
21780 Evansville, IN-KY 358,676
22180 Fayetteville, NC 366,383
22220 Fayetteville-Springdale-Rogers, AR-MO 463,204
22420 Flint, MI 425,790
23060 Fort Wayne, IN 416,257
23420 Fresno, CA 930,450
24340 Grand Rapids-Wyoming, MI 774,160
2024660 Greensboro-High Point, NC 723,801
24860 Greenville-Mauldin-Easley, SC 636,986
25420 Harrisburg-Carlisle, PA 549,475
25540 Hartford-West Hartford-East Hartford, CT 1,212,381
25860 Hickory-Lenoir-Morganton, NC 365,497
26180 Honolulu, HI 953,207
26420 Houston-Sugar Land-Baytown, TX 5,946,800
26620 Huntsville, AL 417,593
26900 Indianapolis-Carmel, IN 1,756,241
27140 Jackson, MS 539,057
27260 Jacksonville, FL 1,345,596
28140 Kansas City, MO-KS 2,035,334
28660 Killeen-Temple-Fort Hood, TX 405,300
28940 Knoxville, TN 698,030
29460 Lakeland-Winter Haven, FL 602,095
29540 Lancaster, PA 519,445
29620 Lansing-East Lansing, MI 464,036
29820 Las Vegas-Paradise, NV 1,951,269
30460 Lexington-Fayette, KY 472,099
30780 Little Rock-North Little Rock-Conway, AR 699,757
31100 Los Angeles-Long Beach-Santa Ana, CA 12,828,837
31140 Louisville/Jefferson County, KY-IN 1,283,566
31540 Madison, WI 568,593
31700 Manchester-Nashua, NH 400,721
32580 McAllen-Edinburg-Mission, TX 774,769
32820 Memphis, TN-MS-AR 1,316,100
33100 Miami-Fort Lauderdale-Pompano Beach, FL 5,564,635
33340 Milwaukee-Waukesha-West Allis, WI 1,555,908
33460 Minneapolis-St. Paul-Bloomington, MN-WI 3,279,833
33660 Mobile, AL 412,992
33700 Modesto, CA 514,453
33860 Montgomery, AL 374,536
34980 Nashville-Davidson--Murfreesboro--Franklin, TN 1,589,934
35300 New Haven-Milford, CT 862,477
35380 New Orleans-Metairie-Kenner, LA 1,167,764
New York-Northern New Jersey-Long Island, NY-NJ-
35620 PA 18,897,109
35840 North Port-Bradenton-Sarasota, FL 702,281
36260 Ogden-Clearfield, UT 547,184
36420 Oklahoma City, OK 1,252,987
36540 Omaha-Council Bluffs, NE-IA 865,350
36740 Orlando-Kissimmee-Sanford, FL 2,134,411
37100 Oxnard-Thousand Oaks-Ventura, CA 823,318
37340 Palm Bay-Melbourne-Titusville, FL 543,376
37860 Pensacola-Ferry Pass-Brent, FL 448,991
37900 Peoria, IL 379,186
37980 Philadelphia-Camden-Wilmington, PA-NJ-DE-MD 5,965,343
38060 Phoenix-Mesa-Glendale, AZ 4,192,887
38300 Pittsburgh, PA 2,356,285
38860 Portland-South Portland-Biddeford, ME 514,098
38900 Portland-Vancouver-Hillsboro, OR-WA 2,226,009
2138940 Port St. Lucie, FL 424,107
39100 Poughkeepsie-Newburgh-Middletown, NY 670,301
39300 Providence-New Bedford-Fall River, RI-MA 1,600,852
39340 Provo-Orem, UT 526,810
39580 Raleigh-Cary, NC 1,130,490
39740 Reading, PA 411,442
39900 Reno-Sparks, NV 425,417
40060 Richmond, VA 1,258,251
40140 Riverside-San Bernardino-Ontario, CA 4,224,851
40380 Rochester, NY 1,054,323
40900 Sacramento--Arden-Arcade--Roseville, CA 2,149,127
41180 St. Louis, MO-IL 2,812,896
41420 Salem, OR 390,738
41500 Salinas, CA 415,057
41620 Salt Lake City, UT 1,124,197
41700 San Antonio-New Braunfels, TX 2,142,508
41740 San Diego-Carlsbad-San Marcos, CA 3,095,313
41860 San Francisco-Oakland-Fremont, CA 4,335,391
41940 San Jose-Sunnyvale-Santa Clara, CA 1,836,911
42060 Santa Barbara-Santa Maria-Goleta, CA 423,895
42220 Santa Rosa-Petaluma, CA 483,878
42340 Savannah, GA 347,611
42540 Scranton--Wilkes-Barre, PA 563,631
42660 Seattle-Tacoma-Bellevue, WA 3,439,809
43340 Shreveport-Bossier City, LA 398,604
44060 Spokane, WA 471,221
44140 Springfield, MA 692,942
44180 Springfield, MO 436,712
44700 Stockton, CA 685,306
45060 Syracuse, NY 662,577
45220 Tallahassee, FL 367,413
45300 Tampa-St. Petersburg-Clearwater, FL 2,783,243
45780 Toledo, OH 651,429
45940 Trenton-Ewing, NJ 366,513
46060 Tucson, AZ 980,263
46140 Tulsa, OK 937,478
46700 Vallejo-Fairfield, CA 413,344
47260 Virginia Beach-Norfolk-Newport News, VA-NC 1,671,683
47300 Visalia-Porterville, CA 442,179
47900 Washington-Arlington-Alexandria, DC-VA-MD-WV 5,582,170
48620 Wichita, KS 623,061
48900 Wilmington, NC 362,315
49180 Winston-Salem, NC 477,717
49340 Worcester, MA 798,552
49620 York-Hanover, PA 434,972
49660 Youngstown-Warren-Boardman, OH-PA 565,773
Source: U.S. Census Bureau, Population Division, Annual Estimates of the Population of Metropolitan and
Micropolitan Statistical Areas: April 1, 2010 to July 1, 2011 (CBSA-EST2011-01), Release Date: April 2012,
http://www.census.gov/popest/data/metro/totals/2011/
22FREQUENTLY ASKED QUESTIONS
I want to buy an air purifier. Are the purifiers that produce ozone helpful to my indoor air
quality?
Some air cleaning devices, such as ozone generators and ionic air purifiers, can generate significant
levels of ozone. Even at low levels, ozone triggers a variety of health problems, including aggravated
asthma and increased susceptibility to respiratory illnesses. Additional information on the assessment
of the effectiveness and health consequences of ozone generators that are sold as air cleaners can
be found at http://www.epa.gov/iaq/pubs/ozonegen.html, and also at the California Air Resources
Board Web site at http://www.arb.ca.gov/research/indoor/ozone_gen_fact_sheet-a.pdf.
If you’re having issues with mold and moisture, solutions and preventative tips are offered at
http://www.epa.gov/mold/index.html. For additional questions about indoor air quality, please use
the EPA Office of Indoor Air Quality hotline at 1-800-438-4318.
Why is my area not covered in the Air Quality Index?
Towns and cities with 350,000 or fewer inhabitants are not required to report the AQI. Also, AirNow is
a voluntary program based upon state and local air quality monitoring networks. Some networks don't
submit their data, or don’t have any monitors in the area.
The other day, the air quality in my area was reported as green, or good air quality. However,
it was pretty hazy outside. Why didn’t the AQI report this accurately?
There are a couple of reasons why this may have occurred, depending on what was “reported.” If this
was an AQI forecast, there are still some parts of the United States that only forecast for ozone and
not particle pollution. It is possible that the forecast ozone AQI was “GOOD” and the hazy conditions
experienced were due to particle pollution. In this instance, the “reported” AQI forecast may have only
represented ozone. As more and more areas begin forecasting for PM2.5 and ozone together, this
discrepancy should diminish.
In the case of real-time data, the AirNow program provides separate maps for ozone and PM2.5 AQI.
It is possible that the ozone AQI maps were showing “GOOD” conditions and the PM2.5 maps
showing “MODERATE” or above conditions. It is important to check both maps for a specific
geographical area to cover both primary pollutants. In the future, AirNow plans to have combined AQI
maps of both ozone and PM2.5 that will eliminate this problem, but will continue to provide the
separate pollutant AQI maps to allow for people to identify the pollutant of concern.
Finally, it should be noted that there are occasions where hazy conditions may be due primarily to
high humidity and not pollution. On these days, it is still good to check the AQI maps and forecasts to
make sure that pollution is not the primary cause of the haze.
How do I get my newspaper to publish the AQI?
Most newspaper weather pages and graphics are developed and produced by private weather service
providers. We recommend that you direct your initial approach to the newspaper editors, since they
are the customers of the weather provider company. In general, newspapers want to provide more
health-based information to their readers. However, it may take some effort to educate decision
makers about the importance of providing air quality information to the public. When you meet with
the newspaper staff, bring along this guidance document or several examples showing how other
23newspapers publish the AQI. In addition, most weather service providers already have access to the
air quality data through AirNow, which makes it easier for them to acquire and publish the information.
Space on weather pages is limited, so a small, compact graphic might be a better choice for a
crowded weather page.
If the AQI reported in the newspaper is incorrect, what should I do?
Common problems with AQI reporting in newspapers include either reporting data values that are
wrong or reporting pollutant concentrations instead of the AQI. Another frequent mistake is to report
inconsistent AQI colors or terminology, as well as incorrect pollutant names. Establishing a good
working relationship with the newspaper and educating them about how misleading or erroneous AQI
information can impact their readers could help minimize potential problems. We recommend that
you first notify the newspaper directly about any error so they can relay discrepancies to their weather
service provider as a paying customer. If you have difficulty getting the newspaper to correct the
issue, you could team with other health and nongovernmental organizations to approach the
newspaper editor with a united message and request.
Should I report yesterday’s observed value, today’s forecast, or tomorrow’s forecast to the
newspaper?
Let's assume that today is Monday, and you are submitting data for Tuesday morning's paper. Let's
also assume that the paper is willing to carry both the observed AQI and the forecast. In such a case:
• Send the paper the most recent observed AQI. If it's midnight to midnight, that means
Sunday's data.
• Send the Tuesday forecast so there is a "day-of" forecast in the Tuesday paper.
• If you have the Wednesday forecast and they're willing to carry that, include it too.
My local newspaper has a deadline of 2 pm for the next day’s paper. Should I report the AQI
value through 1 pm, or report the forecast?
Again, since the true AQI is a midnight to midnight calculation, we recommend that you report
tomorrow's forecast. If this is not possible, then report the AQI value through a certain time, but make
sure the newspaper includes the reporting period to avoid confusion.
How do I get my local TV station to show the AQI?
Similar to the newspaper industry, television reporting reflects the culture of the local community and
what competing stations show. Television stations use weather service providers to provide graphics
and data support for their weathercasts. All of the weather service companies have access to the air
quality data through AirNow, which makes it easy for them to acquire and provide these data to their
television station customers. There are several questions that need to be addressed: Does the
station want to show air quality information? Do other stations in your market show air quality
information? Is the station news director on board with providing this information? Does the station
have the proper software to access the air quality data?
For stations that have never shown these data on the air, you will need to establish a relationship and
educate them about the benefits of providing air quality information to their viewers. Air quality is
weather, news and health all in one. Once a station in your market begins to provide air quality
information, chances are good that other stations will follow suit. However, even if the weathercasters
want to provide this information in their weathercasts, the station news director controls the content of
24what goes on the air. In addition, if the station wants to show the AQI on the air, they need to have
the proper software version of weather graphics products to access and display the AQI. Keep in
mind that air quality information could be displayed only during periods of high pollution levels, when it
is considered more "newsworthy."
Can we still use the Pollutant Standards Index?
No. The Air Quality Index is required by law.
Does providing our data and forecasts to AirNow meet the AQI reporting requirements?
No. Even though the air quality information that you provide to AirNow is distributed on a national
basis to the media and weather service provider companies, there is no guarantee that this
information ends up within the media (newspaper, radio, or web site) in your local community as
required.
Why doesn't the AQI cover toxic air pollutants or air toxics?
While the AQI is an excellent indicator of the air quality resulting from ozone and particulate matter, it
does not directly include health implications from air pollutants such as air toxics. Adverse health
effects from air toxics are generally not believed to be episodic in nature like ozone and particulate
matter, and are usually evaluated on a longer term, or chronic, basis. For information on
concentrations of air toxics, refer to EPA’s National Air Toxics Assessment (NATA) Website at:
http://www.epa.gov/ttn/atw/nata/.
Why does EPA issue AQI forecasts only for ozone and particle pollution?
AQI reporting is required for all criteria pollutants when they have an index value of 50 or above. Most
cities forecast for ozone and particle pollution as these pollutants are the major sources of unhealthy
air quality around 99% of the time. However, several cities forecast for all five pollutants- ground-level
ozone, particle pollution, carbon monoxide, sulfur dioxide, and nitrogen dioxide.
Should I use particulate matter or particle pollution when speaking with the public?
Based on focus group testing by EPA, people better understand and prefer the term “particle
pollution” than "particulate matter."
25United States Office of Air Quality Planning and Publication No. EPA-
Environmental Protection Standards 454/B-13-001
Agency Research Triangle Park, NC 27711 December 2013
26You can also read