Do new bike lanes impact air pollution exposure for cyclists?-a case study from Berlin - IASS Potsdam
←
→
Page content transcription
If your browser does not render page correctly, please read the page content below
LETTER • OPEN ACCESS

Do new bike lanes impact air pollution exposure for cyclists?—a case
study from Berlin
To cite this article: Seán Schmitz et al 2021 Environ. Res. Lett. 16 084031

View the article online for updates and enhancements.

                              This content was downloaded from IP address 195.37.210.253 on 17/08/2021 at 14:48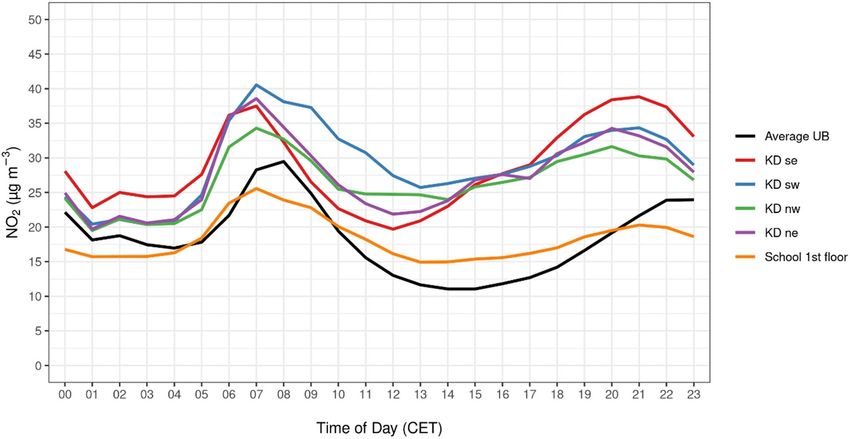
Environ. Res. Lett. 16 (2021) 084031 https://doi.org/10.1088/1748-9326/ac1379
LETTER
Do new bike lanes impact air pollution exposure for cyclists?—a
OPEN ACCESS
case study from Berlin
RECEIVED
31 May 2021 Seán Schmitz1, Alexandre Caseiro1, Andreas Kerschbaumer2 and Erika von Schneidemesser1
REVISED 1
5 July 2021
Institute for Advanced Sustainability Studies e V (IASS), Berliner Strasse 130, 14467 Potsdam, Germany
2
Senate Department for the Environment, Transport and Climate Protection, Am Köllnischen Park 3, 10179 Berlin, Germany
ACCEPTED FOR PUBLICATION
12 July 2021 E-mail: done.evs@iass-potsdam.de
PUBLISHED
Keywords: air pollution exposure, low-cost sensors, sustainable mobility, transport policy, science-policy
28 July 2021
Original content from
this work may be used Abstract
under the terms of the
Creative Commons Cities in the 21st century are dynamically changing in response to environmental and societal
Attribution 4.0 licence. pressures, not least among which are climate change and air pollution. In some of these metropoles,
Any further distribution
of this work must
such as Berlin, a transformation of mobility systems has already begun. Along a mid-sized street in
maintain attribution to Berlin, a measurement campaign was conducted in 2020 to accompany the construction of a bike
the author(s) and the title
of the work, journal lane and the implementation of a community space along one of the side-streets. Using the new
citation and DOI.
technology of low-cost sensors, higher resolution measurements of local air quality were enabled.
Stationary and mobile measurements were taken using EarthSense Zephyr sensor systems before
and after the construction of the bike lane and during the timeframe when the community space
was in place. It was found that the implementation of the bike lane led to a reduction in NO2
exposure for cyclists. During periods when the community space was in place, a reduction in NO2
concentrations was also measured. This study highlights not only the utility of low-cost sensors for
the measurement of urban air quality, but also their value in a science-policy context. Measuring
local air quality changes in response to traffic interventions will enhance understanding of the
associated health benefits, especially in connection with measures promoting more sustainable
modes of active travel. More research of this nature is needed to gain a clear understanding of the
impacts of traffic interventions on local air quality for better protection of human health.
1. Introduction and transportation infrastructure, time spent com-
muting, and climate and meteorology. In Europe,
Ambient air pollution was estimated to contribute car-drivers are exposed to the largest amount of air
to around 4.2 million deaths globally in 2015 [1]. pollution, followed by cyclists and public transport-
Other studies using updated hazard risk ratios [2] and ation users, with pedestrians typically exposed to the
alternative risk and exposure assumptions [3, 4] sug- least amount [6–8]. A systematic review found that
gest that this number might be twofold larger. The commuters using motorized transport had increased
health effects of ambient air pollution are significant exposure to air pollution due to their proximity to
in Europe, with 74% and 99% of its urban popula- traffic and high air interchange whereas the increased
tion exposed to particulate matter less than 2.5 µm inhalation rates and commuting time of active com-
in diameter (PM2.5 ) and ozone (O3 ) concentrations, muters caused them to have a higher inhaled dose [9].
respectively, above WHO recommended limit-values The calculation of exposure varies across these stud-
in 2018 [5]. ies, but an intercomparison of these methods reveals
Urban air pollution is a major human health that there is no single best method, many are appro-
problem with substantial emissions from the trans- priate, and they should be selected based on the size
port sector. Consequently, participants in urban and objectives of the study [10].
transportation (car-drivers, cyclists, pedestrians, etc) The direct health impacts of this air pollution
are exposed to high levels of air pollution. The exposure have been studied extensively, though most
level of exposure is driven by many factors, includ- studies use PM and black carbon (BC) as proxies for
ing, but not limited to, transport emissions, city all air pollutants, with less assessing the impact of
© 2021 The Author(s). Published by IOP Publishing Ltd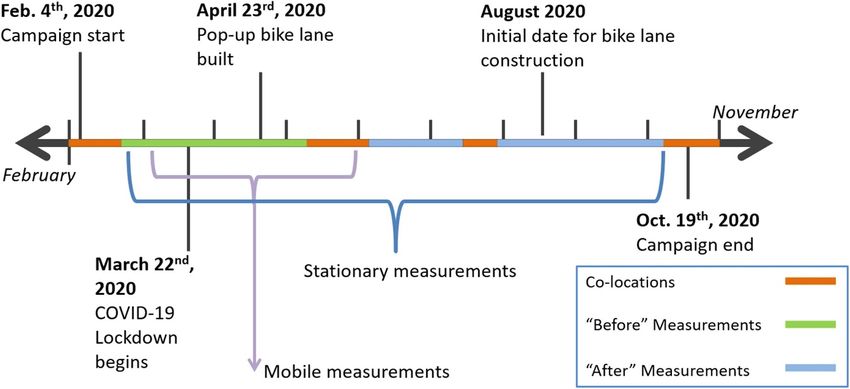
Environ. Res. Lett. 16 (2021) 084031                                                                   S Schmitz et al

exposure to high levels of nitrogen dioxide (NO2 ).         goals by reducing emissions of greenhouse gases and
One study found a significant relationship between          reducing the health impacts of air pollution, while
exposure to NO2 and heart rate variability in healthy       others are focused on making these modes safer and
adults [11], whereas previous studies identified this       more attractive for their citizens. To achieve these
relationship only in elderly populations or subjects        goals, many of these cities need to enact policies to
with pre-existing cardiovascular disease. A cohort          encourage greater uptake of cycling [41, 42], among
study found similar results, with long-term exposure        other sustainable transport options. In cities like
to NO2 pollution associated with higher risk of heart       London, Barcelona, and Berlin, the shift towards
failure [12]. Moreover, systematic reviews of stud-         more active transport has already begun [43–45].
ies assessing NO2 exposure and mortality have con-          Berlin became the first federal state in Germany
sistently found evidence of NO2 exposure associated         to enact a Mobility Act in 2018, which was driven
with a higher risk of all-cause, cardiovascular, and        largely by a citizen-led bicycle referendum called the
respiratory mortality that might be independent of          ‘Volksentscheid Fahrrad,’ [43]. As a result, new cyc-
other common air pollutants [13–16]. This connec-           ling infrastructure, such as protected bike lanes, has
tion between NO2 and health effects was also made by        been built in the city, with more planned in the com-
participants in a study across seven European cities, in    ing years. On one street, Kottbusser Damm (KD) in
which levels of pollution at their home addresses was       the district of Friedrichshain-Kreuzberg, a protected
significantly linked to their concern over the health       bike lane was initially planned to be built in the late
effects of air pollution [17].                              summer of 2020. With the onset of the COVID-19
     While studies show that the benefits of active         pandemic, plans for this were accelerated and it was
travel outweigh the negative health effects of air pollu-   built as a temporary pop-up bike lane to provide
tion exposure [9, 18, 19], further reductions in expos-     safer infrastructure for citizens seeking to switch away
ure by choosing low-traffic routes can additionally         from public transport and towards cycling. A separ-
reduce associated health effects [20, 21]. Research         ate measure that was planned and executed according
from Montréal and Bogotá revealed that cyclists’           to plan involved the transformation of a portion of
exposure to PM and BC was reduced when riding               a side-street (Böckhstrasse) that is directly linked to
on separated, protected bike lanes as opposed to in-        KD into a Spielstrasse or ‘community space’, for which
street facilities [22, 23]. In addition to the reduction    the street was closed to through-traffic, allowing for
in air pollution exposure gained from implementing          greater outdoor space for public use. In this study, we
dedicated cycling infrastructure in cities, the primary     conducted a measurement campaign using low-cost
increase in health benefits at city-scale comes from the    sensors to assess changes in air quality on KD and on
consequent increase in physical activity as more cit-       the Böckhstrasse in connection with the bike lane and
izens switch to active transport [24].                      the community space, respectively.
     Personal exposure measurements are limited, and
regulatory monitoring stations are sparsely distrib-        2. Methods
uted throughout cities. This means that exposure to
microenvironments, such as the transport environ-           2.1. Small air quality sensors
ment, are poorly understood in the context of overall       This data used in this study were collected with small
daily exposure. While urban background (UB) mon-            air quality sensors housed in the EarthSense Zephyr
itoring locations are often used in population expos-       sensor system. Included in this sensor system are: (a)
ure assessment, studies have shown poor agreement           electrochemical (EC) sensors that provide a measure
between measurements at these monitoring stations           of NO2 and O3 ; (b) micro-optical sensors that count
and personal exposure in transport environments             particles to provide a measure of PM; (c) a global pos-
[25–28]. To overcome these issues, new technologies         itioning system (GPS) unit; (d) internal temperature
such as low-cost sensors are being used to increase the     and relative humidity monitors; (e) an internal fan
spatial resolution of monitoring networks [29–33], to       for air intake and expulsion; (f) a lithium-ion bat-
assess personal exposure [32, 34, 35], and in mobile        tery; and (g) a Global System for Mobile Commu-
monitoring [36–40]. While they are less accurate            nications unit for sending logged data to an external
than reference-grade instruments, their low-cost and        database [46]. These sensor systems are part of a new
relatively small size make them more suitable for           generation of air quality measurement devices that
these applications. Furthermore, they can serve to          are lower-cost, smaller, and easier to use in compar-
increase our understanding of air pollution in urban        ison to standard reference instrumentation. As a res-
environments, especially with regards to human              ult, they are easily deployed for both stationary and
health and exposure, providing valuable informa-            mobile measurements with a potential for high spatial
tion not only for scientists, but also for citizens and     and temporal resolution in various environments.
policymakers.                                                   The EC sensors housed within the Zephyrs react
     For various reasons, European cities are start-        in the presence of atmospheric gas-phase pollut-
ing to shift towards sustainable modes of transport.        ants such as NO2 and O3 , as the molecules chemic-
Some are focused on the win-win of achieving climate        ally interacting with the measurement nodes of the

                                               2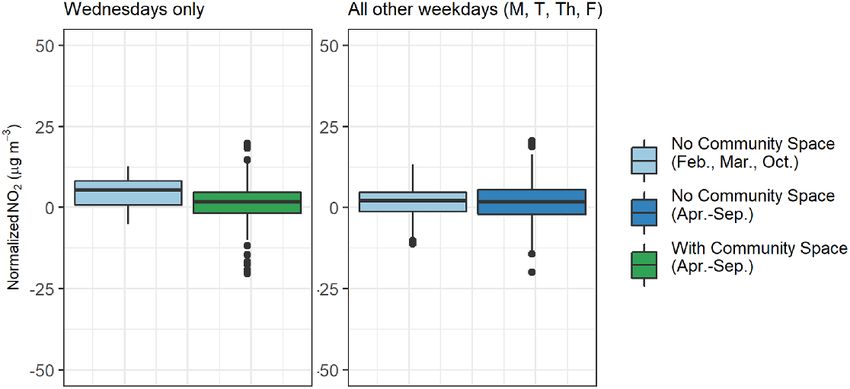
Environ. Res. Lett. 16 (2021) 084031                                                                                 S Schmitz et al

   Figure 1. The locations of the five Zephyrs (blue squares), the routes for the mobile measurements, the location of the
   Nansenstrasse BLUME station (red square), and the location of the temporary community space. The new bike lane was
   implemented along the entire length of KD between Urbanstrasse and Kottbusser Tor. Labeled along the primary route are the
   individual street segments.

sensor. To transform this raw voltage signal into con-             2.3. Sampling site and sampling strategies
centrations of each pollutant, the sensor system must              As can be seen in figure 1, four Zephyrs were deployed
be co-located and calibrated with reference-grade air              on lampposts on KD and one was deployed on the
quality sensors. Co-location in this context refers to             1st floor façade of a primary school on the side-
physically installing the sensor systems at a location             street Böckhstrasse. The latter location was selected as
where they will receive samples from the same parcel               the school lies along the stretch of Böckhstrasse that
of air as the reference instruments.                               was converted to a community space. For the mobile
                                                                   measurements, two separate routes were designed to
2.2. Co-locations and reference instrumentation                    capture various changes in air pollution associated
To co-locate the Zephyrs, measurement stations of the              with the new bike-lane; the primary route covered the
Berlin Air Quality Measurement Network (BLUME)                     length of KD, whereas the second route covered side-
were used. When co-locating small sensors, it is cru-              streets, including along Böckhstrasse. A timeline of
cial that the calibration site experience environmental            the measurement campaign can be seen in figure 2.
conditions (i.e. pollution levels, meteorological con-             In total, 9 sets and 11 sets of mobile measurements
ditions) as similar to those of the experimental site              were conducted before and after the implementation
as possible [47]. In this case, the Zephyrs that were              of the bike lane, respectively, and were composed of
installed on lampposts along KD in Neukölln, Berlin                three continuous loops along each route. These meas-
were co-located at a roadside-traffic station, MC117               urements were conducted during the morning, after-
in Steglitz, Berlin. While it is situated several kilomet-         noon, and evening to capture the range of intra-day
ers away from the experimental site in a different part            variability in NO2 concentrations.
of the city, the shape of the street canyon and traffic
levels are comparable to those of KD. The Zephyr that              2.4. Statistical calibration and transformation
was installed on the 1st floor of the primary school               To calibrate the Zephyrs, data from the reference
on the Böckhstrasse was co-located at a UB station,                instruments was used to train statistical models that
MC042 in Neukölln, Berlin. This station is only a few              included as independent variables the raw sensor sig-
blocks away from KD and since the side streets do                  nal and meteorological conditions, such as temper-
not experience heavy traffic, it was selected as a more            ature and relative humidity. To this end, the seven-
appropriate co-location site than MC117.                           step method was used to clean and flag the raw

                                                     3
Environ. Res. Lett. 16 (2021) 084031 S Schmitz et al
Figure 2. Timeline of the measurement campaign depicting the temporal coverage of the mobile and stationary measurements, as
well as key events. ‘Before’ refers to the measurements captured prior to bike lane construction and ‘after’ refers to those following
its implementation. Each tick represents the beginning of a new month, starting in February, 2020.
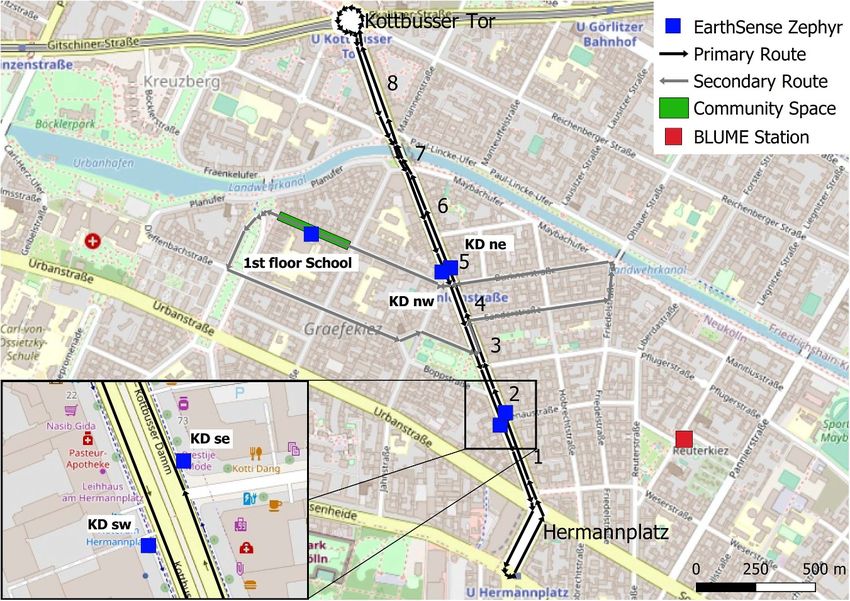
data; build, train, and optimize the parameters of a primary school agrees more closely with the average
multiple linear regression (MLR) model; and predict UB NO2 across four stations. In all cases, the morn-
the final concentrations with an associated measure ing and evening peaks in NO2 align, with the KD
of uncertainty for each measurement [48]. A ran- Zephyrs showing higher concentrations and a lower
dom forest model was also built, but this was determ- mid-day dip as a result of higher local emissions from
ined to have no significant increase in accuracy over the street. Using a Mann-Whitney U-test, the dis-
the MLR model and had more limitations. Further tributions of all stationary Zephyrs were compared
details on the seven-step methodology can be found (table 1). All KD Zephyrs were found to have signific-
in Schmitz et al [48]. The seven-step methodology has antly different distributions than the primary school
been developed and applied to gas-phase concentra- Zephyr. Among the lamppost Zephyrs, the north-
tions only at this point. For this reason, as well as the ern and southern Zephyrs form two distinct groups.
predominance of traffic emissions to total NOx emis- Given these results, it was concluded that normalizing
sions in urban areas in Europe and Berlin, the analysis the mobile measurements along the primary route to
presented here is limited to NO2 . the nearest pair of sensors was appropriate. For meas-
To account for changes in meteorological condi- urements along segments between the two pairs, a
tions, traffic patterns, and other external forces such weighted average was used. However, using the simple
as the COVID-19 lockdowns that may have influ- average of all four Zephyrs produced similar results.
enced variations in NO2 concentrations on KD, all Analysis was conducted to assess the relative
calibrated concentrations were normalized. In this impact of the bike lane on the stationary measure-
case, hourly averaged concentrations from the five ments, which reflect the local air pollution conditions
stationary Zephyrs along KD and on the side-streets on KD. However, due to the significant impact of
were normalized to the hourly average of four UB the COVID-19 pandemic and subsequent stringent
stations by subtracting the UB hourly averaged con- measures in Berlin, potential effects from the bike lane
centrations from the Zephyr hourly averaged concen- on NO2 concentrations for the general KD area, as
trations. Similarly, the mobile measurements along represented by the stationary measurements on KD,
KD and the side-streets were normalized to the 5 min could not be isolated. More data would be needed to
averages of the four lamppost Zephyrs on KD and the establish this connection.
Nansenstrasse UB station, respectively. This higher
resolution was necessary as each set of mobile meas- 3.2. Mobile measurements
urements took roughly ∼40 min for each route. To assess the impact of the bike lane on cyclists’
personal exposure, NO2 concentrations from the
3. Results primary and secondary route from before and after
its construction were compared. Figure 4 shows these
3.1. Stationary measurements data in box-and-whisker plots, grouped according
As can be seen in figure 3, the stationary measure- to the presence of the bike lane. As each meas-
ments along KD exhibit a similar diurnal pattern urement contained an associated uncertainty, error
with good agreement. The side-street Zephyr on the was propagated when comparing the before and
4Environ. Res. Lett. 16 (2021) 084031 S Schmitz et al
Figure 3. NO2 diurnal pattern of all stationary Zephyrs as well as the urban background (UB) average for the duration of the
campaign. The KD Zephyr locations correspond to cardinal directions related to their position on the street, e.g. se = southeast.
Table 1. Wilcoxon-Mann-Whitney U-tests of the difference in means between each of the stationary Zephyrs across the entire
experiment. Reported in the table are p-values. Italicized and bolded are values below the Bonferroni-corrected p-value of 0.01, which
indicate acceptance of the alternative hypothesis, that the distributions of the two sensors are NOT equal. Extremely low p-values are
represented here as 0.
KD SW KD SE KD NW KD NE School 1st floor
KD SW
KD SE 0.48
KD NW 0 0
KD NE 0.0058 0.0003 0.053
School 1st floor 0 0 0 0
after samples3 . For the primary route, a decrease in even though no changes to cycling infrastructure were
the median normalized NO2 of 8.4 ± 7.4 µg m−3 implemented at these sites. The same analysis for the
was measured whereas for the secondary route secondary route was inconclusive, as only three of
the decrease in the median normalized NO2 was the twelve segments were statistically significant, with
2.5 ± 7.4 µg m−3 . In both cases, tests with the some segments showing no decrease or even a slight
Mann-Whitney U-test were significant at a p-value increase in NO2 concentrations.
of 0.05, indicating the distributions of the data from
before and after the implementation of the bike 3.3. Community space measurements
lane are different. At the 95th percentile, the reduc- Figure 5 shows box-and-whisker plots for the Zephyr
tion in normalized NO2 for the primary route was located at the primary school, grouped according to
14 ± 7.4 µg m−3 , whereas for the secondary route an whether the community space was in place or not.
increase of 2.4 ± 7.4 µg m−3 was found. On Wednesdays between 14:00 and 18:00, when the
To more closely inspect these results, the data community space was in place (April–September),
from each route were broken down into smaller seg- the median normalized NO2 was 3.7 ± 11.2 µg m−3
ments. For the primary route, the trend of decreas- less than when there was no community space in place
ing concentrations was found in every segment and (February, March, and October). A Mann-Whitney
all were statistically significant. Two of the segments U-test indicated that these distributions are statist-
along the route, at Hermannplatz and Kottbusser Tor, ically different (p = 0.012). To confirm that the dif-
showed the same trend in decreasing concentrations ference seen in figure 5(a) (the comparison of Wed-
nesdays with and without the community space) was
3 Propagation of error for differences between medians and
indeed owing to the community space, a parallel com-
the
parison for all other weekdays was also carried out
√ 95th percentile were calculated using the formula Q =
(figure 5(b)). This difference in median normalized
(e1 )2 + (e2 )2 , where Q is the propagated error and e1 and e2
are the individual uncertainties of the two measurements being NO2 from 14:00 to 18:00 was 0.42 ± 11.2 µg m−3
compared. under the same conditions and was not statistically
5Environ. Res. Lett. 16 (2021) 084031 S Schmitz et al
Figure 4. (Left) Box-and-whisker plots of mobile measurements along KD normalized to the 5 min average NO2 of the four
lamppost Zephyrs, with and without the presence of a bike lane, not including measurements from Kottbusser Tor or
Hermannplatz; (right) box-and-whisker plots of mobile measurements along the side-streets of KD normalized to 5 min average
NO2 of the Nansenstrasse urban background station, with and without the presence of a bike lane.
Figure 5. Box-and-whisker plots of measurements from the Zephyr located at the primary school, normalized to the hourly
average of four urban background stations, grouped by time periods where the community space was or was not in place on
(a) Wednesdays only and (b) all weekdays excluding Wednesdays.
significant (p = 0.61). With this analysis, it was measurements, these low-cost sensors have proven
assured that the changes measured on Wednesdays their value in assessing small-scale spatial changes in
could be associated with the community space, as all air quality in cities, which has implications for future
other weekdays during the same time window did research aimed at understanding local changes in air
not exhibit any significant changes. A comparison to quality, including before-after measurements in con-
weekend concentrations was not made, as weekend nection with transport measures. In the context of
NO2 concentrations were significantly different than the mobility transition in Germany, these sensors can
on weekdays and were not related to the street clos- provide valuable information to policymakers with
ures. Finally, an analysis to control for holiday days regards to the effect on air quality for the various
that fell on weekdays was done and showed that the measures they may implement.
effect was negligible. Here, a reduction in exposure to NO2 for cyc-
lists following the implementation of the bike lane,
4. Discussion after normalization to local conditions, was meas-
ured. Furthermore, the reduction in exposure along
This study has successfully shown that low-cost KD was higher at the 95th percentile, which sug-
sensors can be deployed to assess changes in air qual- gests that cyclists were exposed to fewer extreme
ity in connection with local transport measures. In peaks in concentrations associated with proximity to
general, the Zephyrs accurately captured the expec- tailpipe emissions from motor vehicles. These reduc-
ted diurnal trends of NO2 on KD as well as on tions were not seen along the side-streets, indicating
the Böckhstrasse, demonstrating their utility for such that the effect is local in nature and can be associated
work. Despite the higher level of uncertainty in the with the construction of the bike lane. The exposure
6Environ. Res. Lett. 16 (2021) 084031 S Schmitz et al
to peak concentrations can be quite important; Dons pollution, which would require larger-scale changes
et al found that only 5.5% of participants’ daily expos- in emissions sources to change.
ure was attributed to peak concentrations, but these
contributed to 21% of their total exposure [49]. As
4.1. Limitations
such, cyclists along KD appear to have profited from
This study and its findings are subject to several key
this measure, not only from the increased safety of a
limitations. Primarily, the COVID-19 pandemic dis-
protected bike lane, but also from the reduction in
rupted the plans for this measurement campaign.
exposure to both overall and peak NO2 concentra-
Due to restrictive lockdowns implemented in Ber-
tions. An effect of the bike lane on overall air qual-
lin in response to the pandemic, traffic patterns and
ity on KD could not be determined due to a lack of
behaviors were substantially altered during the cam-
data representative of local conditions following the
paign. Furthermore, the bike lane was implemented
implementation of the bike lane that are free of effects
as temporary cycling infrastructure months earlier
from restrictive COVID-19 health measures. While
than anticipated. These circumstances led to a sub-
no other studies exist in the literature that are directly
stantial reduction in the amount of data collected
comparable, related studies have shown that cycling
before and after the bike lane was in place. In addi-
infrastructure influences the particle number concen-
tion, this study would have benefited from additional
tration cyclists are exposed to [39, 50], whereas oth-
measurements that quantitatively assessed traffic pat-
ers quantify the role of urban infrastructure on air
terns, composition, and behavior along KD and its
pollution, such as green walls or low emission zones
side-streets. This data would allow for a more detailed
[51, 52], but these do not assess changes to cyclists’
analysis of the impact of the bike lane on local traffic,
exposure to air pollution. Other studies that explicitly
individual transport decisions, and the concomit-
measured cyclists’ exposure to air pollution did not
ant influences on air quality. For this study, such
explicitly connect their mobile measurements to spe-
data were unavailable. In addition, no tests on sensor
cific transport measures [53]. Therefore, this study is
performance pertaining to mobile deployment were
one of the first to measure changes in cyclists’ expos-
conducted and therefore the potential influences of
ure to NO2 in direct connection with changes in cyc-
mobile use on the sensors (i.e. vibration) in this study
ling infrastructure.
are unknown. However, as the analysis focuses on gas-
While quantifying the health benefits associated
phase species (not PM) isokinetic sampling is a non-
with this reduction is beyond the scope of this study,
issue, and previous mobile deployments of measure-
a reduction in NO2 exposure is a positive influence
ment devices have not shown vibration to cause any
on cyclists’ health, given the established connections
interference. As there are few studies assessing low-
between NO2 exposure and mortality [12–16]. In
cost sensor performance in mobile conditions, more
addition, recent research has shown that pop-up bike
research is needed to identify potential interferences
lanes increased cycling across European cities [54].
on measurement quality. Last, it should be noted
That study estimated that the associated health bene-
that the deployment of the sensors in this study did
fits in terms of kilometers of new bike lanes per square
not follow regulatory guidelines for site selection, nor
kilometer were estimated to be worth between $1 and
did the sensor go through any certification process
$7 billion annually, or $1.2–$3.5 in terms of kilo-
for assessing their performance relative to regulatory
meters per capita, if the uptake in cycling is main-
standards. As such, the data should not be used to
tained [54]. This is in line with other research estimat-
assess exceedances of air quality limit values. How-
ing the health benefits across 167 European cities, in
ever, the results of this study still have a high relev-
which the expansion of cycling networks could lead
ance for human health in urban areas, and data are
to the avoidance of 10 000 premature deaths annu-
presented with associated uncertainties.
ally [55]. These findings indicate that a measured
increase in cycling uptake along KD confers addi-
tional health benefits to Berlin cyclists alongside the 5. Conclusions
reduction in NO2 exposure associated with new bike
lane infrastructure. This study has demonstrated the utility of small
The implementation of the community space sensors for both stationary and mobile measurements
also led to a measured reduction in NO2 concen- in an urban environment to measure small scale spa-
trations. On other weekdays where the community tial changes in air quality. This is one of the first stud-
space was not in place, there was no discernible differ- ies to implement such small sensors to accompany
ence in NO2 concentrations. While this reduction was the implementation of a mobility policy to quantify
smaller than that on KD, it highlights the relation- the effect on air pollution, including exposure. Results
ship between NO2 and vehicle traffic. Böckhstrasse showed that the implementation of a (pop-up) bike
is already traffic-calmed, but if cars are no longer lane, in which cyclists went from cycling in the street
allowed to traverse the street, there will be further with traffic, to a dedicated bike lane largely protected
local reductions in NO2 concentrations. The overall from motor vehicle traffic by a lane of parked cars,
decrease, however, is constrained by UB levels of NO2 resulted in a reduction of 8.4 ± 7.4 µg m−3 in NO2 or
7Environ. Res. Lett. 16 (2021) 084031 S Schmitz et al
22% ± 19% that they were exposed to. This under- [5] EEA 2020 Air quality in Europe—2020 report (European
lines the importance of infrastructure for the pro- Environment Agency)
[6] De Nazelle A, Bode O and Orjuela J P 2017 Comparison of
tection of human health in urban areas. Additional
air pollution exposures in active vs. passive travel modes in
studies are needed to understand how representat- European cities: a quantitative review Environ. Int. 99 151–60
ive and transferrable these results are. As the mobil- [7] Rank J, Folke J and Jespersen P H 2001 Differences in cyclists
ity transition in Berlin and across Europe proceeds, and car drivers exposure to air pollution from traffic in the
city of Copenhagen Sci. Total Environ. 279 131–6
these types of measurements will prove invaluable for
[8] Raza W et al 2018 Air pollution as a risk factor in health
decision makers. impact assessments of a travel mode shift towards cycling
Glob. Health Action 11 1429081
Data availability statement [9] Cepeda M et al 2017 Levels of ambient air pollution
according to mode of transport: a systematic review Lancet
Public Health 2 e23–e34
The data that support the findings of this study are [10] Dons E et al 2017 Wearable sensors for personal monitoring
available upon reasonable request from the authors. and estimation of inhaled traffic-related air pollution:
evaluation of methods Environ. Sci. Technol. 51 1859–67
[11] Weichenthal S et al 2011 Traffic-related air pollution and
Acknowledgments acute changes in heart rate variability and respiratory
function in urban cyclists Environ. Health Perspect.
119 1373–8
The authors would like to thank Katja Grunow, [12] Sorensen M et al 2017 Long-term exposure to road traffic
Philipp Tödter, and Marcel Krysiak (Berlin Senate noise and nitrogen dioxide and risk of heart failure: a cohort
Department for the Environment, Transport, and study Environ. Health Perspect. 125 097021
Climate Protection), Felix Weisbrich (Roads and [13] Huangfu P and Atkinson R 2020 Long-term exposure to
NO2 and O3 and all-cause and respiratory mortality: a
Green Spaces Department, District Friedrichshain- systematic review and meta-analysis Environ. Int.
Kreuzberg), Ms. Albert and Mr. Weinandt (Lemgo 144 105998
primary school), Tarik Mustafa and Martin Wit- [14] Faustini A, Rapp R and Forastiere F 2014 Nitrogen dioxide
tau (Bundesvereinigung Nachhaltigkeit e.V.), and the and mortality: review and meta-analysis of long-term studies
Eur. Respir. J. 44 744–53
entire EarthSense team for their support of this work. [15] Atkinson R W et al 2018 Long-term concentrations of
We would also like to thank Sophia Becker, Dirk von nitrogen dioxide and mortality: a meta-analysis of cohort
Schneidemesser, and Katharina Götting (IASS) for studies Epidemiology 29 460–72
their collaboration on this work and as part of the [16] Huang S et al 2021 Long-term exposure to nitrogen dioxide
and mortality: a systematic review and meta-analysis Sci.
LuftMODE interdisciplinary research group. Total Environ. 776 145968
[17] Dons E et al 2018 Concern over health effects of air pollution
is associated to NO2 in seven European cities Air Qual.
Funding Atmos. Health 11 591–9
[18] Giallouros G et al 2020 The long-term impact of restricting
The research of EvS, SS, and AC is supported by IASS cycling and walking during high air pollution days on
Potsdam, with financial support provided by the Fed- all-cause mortality: health impact assessment study Environ.
Int. 140 105679
eral Ministry of Education and Research of Germany [19] Tainio M et al 2021 Air pollution, physical activity and
(BMBF) and the Ministry for Science, Research and health: a mapping review of the evidence Environ. Int.
Culture of the State of Brandenburg (MWFK). 147 105954
[20] Jarjour S, Jerrett M, Westerdahl D, De Nazelle A, Hanning C,
Daly L, Lipsitt J and Balmes J 2013 Cyclist route choice,
ORCID iDs traffic-related air pollution, and lung function: a scripted
exposure study Environ Health 12 14
Seán Schmitz https://orcid.org/0000-0002-8860- [21] Shrestha A et al 2020 Exposure to air pollutants among
441X cyclists: a comparison of different cycling routes
in Perth, Western Australia Air Qual. Atmos. Health
Alexandre Caseiro https://orcid.org/0000-0003- 13 1023–34
3188-3371 [22] Farrell W J et al 2015 Evaluating air pollution exposures
Erika von Schneidemesser https://orcid.org/0000- across cycling infrastructure types: implications for facility
0003-1386-285X design J. Transp. Land Use 8 131–49
[23] Hernández M A et al 2021 Urban cycling and air quality:
characterizing cyclist exposure to particulate-related
References pollution Urban Clim. 36 100767
[24] Schepers P et al 2015 The mortality impact of bicycle paths
[1] Landrigan P J et al 2018 The Lancet Commission on and lanes related to physical activity, air pollution exposure,
pollution and health Lancet 391 462–512 and road safety J. Transp. Health 2 460–73
[2] Lelieveld J et al 2019 Cardiovascular disease burden from [25] Xu J et al 2017 Mobile monitoring of personal nox exposures
ambient air pollution in Europe reassessed using novel during scripted daily activities in Chicago, IL Aerosol Air
hazard ratio functions Eur. Heart J. 40 1590–6 Qual. Res. 17 1999–2009
[3] Burnett R et al 2018 Global estimates of mortality associated [26] De Nazelle A et al 2012 A travel mode comparison of
with long-term exposure to outdoor fine particulate matter commuters’ exposures to air pollutants in Barcelona Atmos.
Proc. Natl Acad. Sci. USA 115 9592–7 Environ. 59 151–9
[4] Vohra K et al 2021 Global mortality from outdoor fine [27] Gulliver J and Briggs D J 2004 Personal exposure to
particle pollution generated by fossil fuel combustion: results particulate air pollution in transport microenvironments
from GEOS-Chem Environ. Res. 195 110754 Atmos. Environ. 38 1–8
8Environ. Res. Lett. 16 (2021) 084031 S Schmitz et al
[28] Ragettli M S et al 2013 Commuter exposure to ultrafine [42] Nieuwenhuijsen M J 2020 Urban and transport planning
particles in different urban locations, transportation modes pathways to carbon neutral, liveable and healthy cities; a
and routes Atmos. Environ. 77 376–84 review of the current evidence Environ. Int. 140 105661
[29] Barcelo-Ordinas J M et al 2019 Distributed multi-scale [43] von Schneidemesser D, Herberg J and Stasiak D 2020
calibration of low-cost ozone sensors in wireless sensor Re-claiming the responsivity gap: the co-creation of cycling
networks Sensors 19 2503 policies in Berlin’s mobility law Transp. Res. Interdiscip.
[30] Kumar P et al 2015 The rise of low-cost sensing for Perspect. 8 100270
managing air pollution in cities Environ. Int. 75 199–205 [44] Aldred R and Goodman A 2020 Low traffic neighbourhoods,
[31] Mead M I et al 2013 The use of electrochemical sensors for car use, and active travel: evidence from the people and
monitoring urban air quality in low-cost, high-density places survey of outer london active travel interventions
networks Atmos. Environ. 70 186–203 (https://doi.org/10.32866/001c.17128)
[32] Morawska L et al 2018 Applications of low-cost sensing [45] López I, Ortega J and Pardo M 2020 Mobility infrastructures
technologies for air quality monitoring and exposure in cities and climate change: an analysis through the
assessment: how far have they gone? Environ. Int. superblocks in Barcelona Atmosphere 11 410
116 286–99 [46] EarthSense 2021 Zephyr® Air Quality Monitor (available at:
[33] Popoola O A M et al 2018 Use of networks of low cost air www.earthsense.co.uk/Zephyr) (Accessed 28 April 2021)
quality sensors to quantify air quality in urban settings [47] Peltier R et al 2020 An Update on Low-cost Sensors for the
Atmos. Environ. 194 58–70 Measurement of Atmospheric Composition WMO-No. 1215
[34] Mahajan S and Kumar P 2020 Evaluation of low-cost sensors WMO
for quantitative personal exposure monitoring Sustain. Cities [48] Schmitz S et al 2021 Unraveling a black box: an open-source
Soc. 57 102076 methodology for the field calibration of small air quality
[35] Piedrahita R et al 2014 The next generation of low-cost sensors Atmos. Meas. Tech. Discuss. 2021 1–34
personal air quality sensors for quantitative exposure [49] Dons E et al 2019 Transport most likely to cause air pollution
monitoring Atmos. Meas. Tech. 7 3325–36 peak exposures in everyday life: evidence from over 2000
[36] Lim C C et al 2019 Mapping urban air quality using mobile days of personal monitoring Atmos. Environ. 213 424–32
sampling with low-cost sensors and machine learning in [50] Boogaard H et al 2009 Exposure to ultrafine and fine
Seoul, South Korea Environ. Int. 131 105022 particles and noise during cycling and driving in 11 Dutch
[37] Gao Y et al 2016 Mosaic: a low-cost mobile sensing system cities Atmos. Environ. 43 4234–42
for urban air quality monitoring Int. Conf. on Computer [51] Boogaard H et al 2012 Impact of low emission zones and
Communications IEEE local traffic policies on ambient air pollution concentrations
[38] Genikomsakis K N et al 2018 Development and on-field Sci. Total Environ. 435–436 132–40
testing of low-cost portable system for monitoring PM2.5 [52] Paull N J et al 2020 Can green walls reduce outdoor ambient
concentrations Sensors 18 1056 particulate matter, noise pollution and temperature? Int.
[39] von Schneidemesser E et al 2019 Air pollution at human J. Environ. Res. Public Health 17 5084
scales in an urban environment: impact of local environment [53] Samad A and Vogt U 2021 Mobile air quality measurements
and vehicles on particle number concentrations Sci. Total using bicycle to obtain spatial distribution and high
Environ. 688 691–700 temporal resolution in and around the city center of
[40] Lin C et al 2017 Practical field calibration of portable Stuttgart Atmos. Environ. 244 117915
monitors for mobile measurements of multiple air pollutants [54] Kraus S and Koch N 2021 Provisional COVID-19
Atmosphere 8 231 infrastructure induces large, rapid increases in cycling Proc.
[41] Brand C et al 2021 The climate change mitigation impacts of Natl Acad. Sci. USA 118 e2024399118
active travel: evidence from a longitudinal panel study in [55] Mueller N et al 2018 Health impact assessment of cycling
seven European cities Glob. Environ. Change 67 102224 network expansions in European cities Prev. Med. 109 62–70
9You can also read