AQVx-An Interactive Visual Display System for Air Pollution and Public Health
←
→
Page content transcription
If your browser does not render page correctly, please read the page content below
TECHNOLOGY AND CODE
                                                                                                                                         published: 24 March 2020
                                                                                                                                   doi: 10.3389/fpubh.2020.00085

                                              AQVx—An Interactive Visual Display
                                              System for Air Pollution and Public
                                              Health
                                              Grant J. Williamson* and Christopher Lucani
                                              School of Natural Sciences, University of Tasmania, Hobart, TAS, Australia

                                              Fine particulate matter emissions (PM2.5 ) from landscape biomass fires, both prescribed
                                              and wild, pose a significant public health risk, with smoke exposure seasonally impacting
                                              human populations through both highly concentrated local plumes, and more dispersed
                                              regional haze. A range of technologies now exist for mapping and modeling atmospheric
                                              particulate concentration, including low-cost mobile monitors, dispersion and chemical
                                              transport modeling, multi-spectral earth observation satellites, weather radar, as well as
                                              publicly available real-time data feeds from agencies providing information about fire
                                              activity on the ground. Ubiquitous smart phone availability also allows instant public
                                              reporting of both health symptoms and smoke exposure. We describe a web-based
                                              visual display interface, Air Quality Visualization (AQVx), developed to allow the overlaying,
                                              synchronization and comparison of a range of maps and data layers, in order to both
                                              assess the potential public health impact of landscape fire smoke plumes, and the
                          Edited by:
                  Gayle S. W. Hagler,         accuracy of dispersion models. The system was trialed in the state of Victoria, in south-
         United States Environmental          eastern Australia, within the domain of the AQFx chemical transport model, where
     Protection Agency, United States
                                              large-scale annual prescribed burning operations (∼11,000 km2 yr) are carried out, and
                      Reviewed by:
                                              where extreme wildfires frequently occur during the summer months. AQVx, coupled
                   Mary Clare Hano,
         United States Environmental          with the ARSmoke smart phone application, allowed managers to rapidly validate
    Protection Agency, United States          modeled smoke transport against satellite imagery, and identify potential exposure risks
                         Molini Patel,
   United States Department of State,         to populated areas.
                       United States
                                              Keywords: smoke, wildfire, prescribed, visualization, transport, radar, exposure
                    *Correspondence:
                     Grant J. Williamson
         grant.williamson@utas.edu.au
                                              1. INTRODUCTION
                    Specialty section:        Smoke emissions from landscape fires are primarily composed of fine particulate matter (PM), with
          This article was submitted to       the fraction with an aerodynamic diameter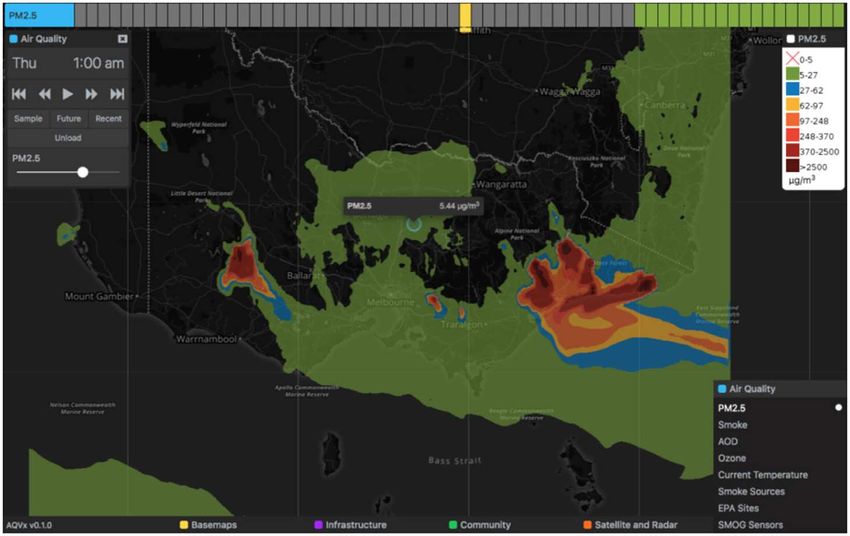
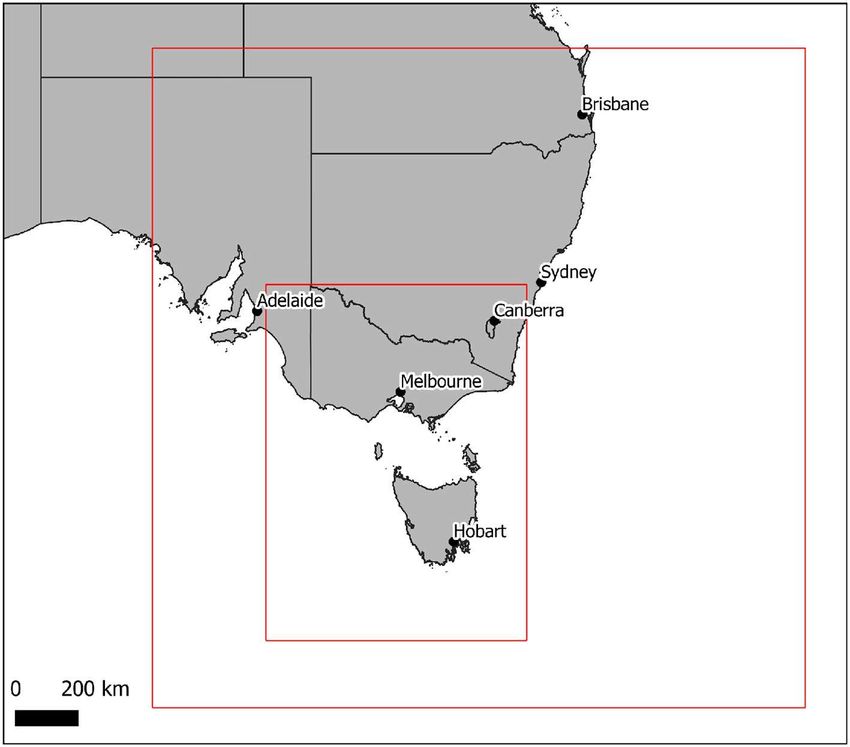
Williamson and Lucani                                                                                        AQVx Smoke Pollution Display System

   In the state of Victoria, in south-eastern Australia, community        Space Agency’s Sentinel-2 satellites provide high-resolution (10–
and fire management focus has been placed on prescribed                   30 m ground pixel) coverage approximately every 5 days,
burning programs to reduce wildfire risk. Following the                   providing detailed imagery of fire burnt areas. These satellite
devastating “Black Saturday” fires in February 2009, which                observations provide a range of measurements and imagery
resulted in 173 fatalities and burned over 450,000 ha (11), the           useful for validating both dispersion and transport model inputs,
2009 Victorian Bushfires Royal Commission (12) recommended                such as fire location and intensity, and model outputs, such as
an annual rolling 5% statewide prescribed burning target in order         plume location, dispersion direction, and PM concentration. A
to manage forest fuel mass and reduce wildfire risk. In 2015,             visual interface that allows integrated access and overlaying of
this policy was reviewed (13) and a shift toward targeted risk            the latest satellite imagery and model output, over multiple time
reduction was implemented, with the recognition that a flat 5%            steps, can enable a qualitative and quantitative comparison of
area target was not achievable or sustainable, and could result           model output with measurements and observations.
in excessive prescribed burning application in areas that would
make little improvement to public risk or ecological values. The          2. METHODS AND DATA
approach that has been adopted implements fire spread and
scenario modeling in order to determine optimal areas to be               AQVx (Air Quality Visualization) is a web-based interactive
burnt in order to minimize residual wildfire risk (14). This has          visual analysis system that integrates chemical transport
resulted in a significant reduction in total annual area burnt            dispersion modeling (19) of PM2.5 , ozone, and levoglucosan
by prescribed fire, from a peak of 281,950 ha in the 2012–                with on-the-ground air quality sensors, crowd-sourced reports of
2013 season to just 75,857 ha in the 2017–2018 season (15),               smoke and health symptoms, satellite imagery, radar, fire-related
but given the burn program is targeted toward reducing risk to            incidents and planned burns and infrastructure (Figure 1).
communities and assets, fires and the resulting smoke plumes              Trialed during the 2019 annual prescribed burning operations
are likely to more frequently impact populated areas due to               in Victoria, the AQVx system allowed fire managers from
their proximity.                                                          the Department of Environment, Land, Water and Planning
   In order to assist in prescribed burn planning and                     (DELWP) to query and validate modeled air quality, and identify
identification of potential smoke plume impacts on populated              potential exposure risks to populated areas.
areas, a chemical transport and dispersion model is run daily to
project smoke transport from wild and prescribed fires, and the           2.1. Data Sources
interaction of smoke with other emissions sources. Atmospheric            The AQVx system ingests, processes and displays a range of
dispersion models (16) can provide high resolution forecasts              model, satellite data sources, listed in Table 1. Data are acquired
of plume location, transport, and PM concentrations, but                  from these sources automatically at appropriate intervals, for
require accurate meteorological and emissions parameterization,           example CSIRO Chemical Transport Model output is transferred
and there is a need to validate them against observations to              once every 24 h when modeling is complete, while Himawari-8
ensure their accuracy and utility (17). On-ground PM monitors             satellite data is transferred every 10 min. System administrators
provide the best means of validation, as they provide accurate            are notified if data acquisition and ingestion failed for any reason
measurements at precise point locations with an observation               so end users can be notified, and missing time steps for layers are
frequency compatible with that of dispersion model output.                not displayed on the interactive timeline.
However, historically PM monitors have primarily been
established to monitor urban, traffic and industrial pollutants           2.1.1. CSIRO Chemical Transport Model
in major population centers, and have poor coverage in rural,             The CSIRO Chemical Transport Model (19) (CTM) was
sparsely-populated areas where landscape fires generally occur            implemented to be run daily in nested domains, with an outer
(18). Therefore, there is scope to utilize other means of detecting       domain covering the Australian region at 30 km resolution, a
smoke plumes and measuring PM concentrations in validating                domain over south-eastern Australia with a 9 km resolution, and
atmospheric dispersion model output.                                      an inner domain covering the states of Victoria and Tasmania
   Earth observation satellite platforms that provide detections          at a 3km resolution (Figure 2). This implementation of the
of smoke, fire and aerosol/PM concentration are becoming                  transport model is termed AQFx (Air Quality Forecast), and
increasingly available. Geostationary satellites, such as the Japan       is forced with meteorology from the Australian Bureau of
Meteorological Agency’s Himawari-8, deliver extremely frequent            Meteorology’s ACCESS numerical forecast model (ACCESS-
imagery in a range of spectral bands, and can provide valuable            R for outer domains, ACCESS-VT for inner domains), and
insight into fire location and smoke transport in close to real           incorporates emission inventories from urban, traffic, industrial,
time. Sun-synchronous satellites, such as NASA’s Aqua and                 biogenic and sea-salt production. Landscape fire emissions
Terra satellites, which carry the Moderate Resolution Imaging             for Victoria are generated from Phoneix fire behavior model
Spectroradiometer instrument (MODIS) and the Suomi NPP                    simulations (20) using fire area polygons provided by DELWP,
satellite with the Visible Infrared Imaging Radiometer Suite              and outside Victoria satellite fire hotspots are provided by
(VIIRS) provide coverage multiple times a day, and allow                  Geoscience Australia’s Sentinel service (21), which incorporates
detection of active fire hotspots in near real-time, as well              hotspot detections by the MODIS and VIIRS instruments. Outer-
as estimations of aerosol optical depth (AOD), a proxy for                domain generic particle concentrations are generated from
atmospheric column particulate concentration. The European                GLOMAP simulations (22). Model output is available at 10:00

Frontiers in Public Health | www.frontiersin.org                      2                                          March 2020 | Volume 8 | Article 85
Williamson and Lucani AQVx Smoke Pollution Display System
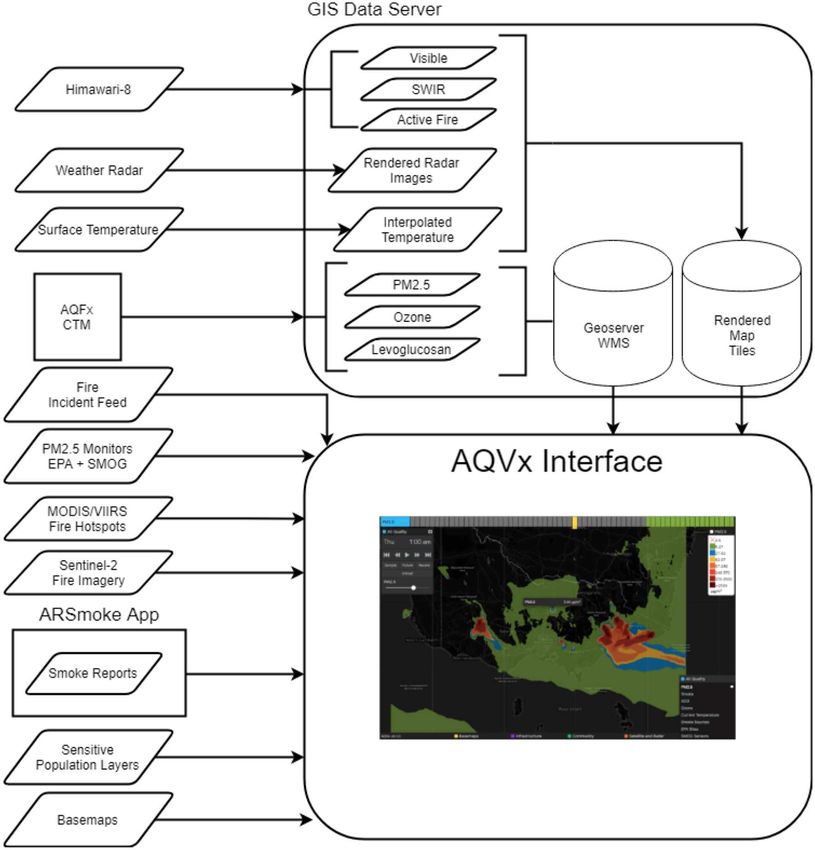
FIGURE 1 | The AQVx system integrates chemical transport modeling with on-the-ground air quality sensors, satellite imagery, radar, crowd-sourced reports of
smoke and health symptoms, fire-related incidents and planned burns and community infrastructure.
AEST each day, and is automatically downloaded to the AQVx of 10 min, or 2.5 min for defined target areas. Every 10 min, a
mapping server. Model output NetCDF files are processed using set of Himawari-8 bands are downloaded automatically from the
GDAL v2.2.2 (23) and R v3.4.4 (24), integrated into a 7-days Australian Bureau of Meteorology, comprising visible red (0.64
archive, and transferred to GeoServer v2.12.1 (25) for rendering µm), green (0.51 µm), and blue (0.47 µm), near infrared (0.86,
and display though a standard web map service (WMS). 1.61, 2.26 µm), and thermal infrared (3.89 µm). Red, green,
and blue channels are combined to form a true-color visible
2.1.2. Satellite Imagery image, the 0.86 µm band provides an monochromatic image
The Himawari-8 satellite (26) launched by the Japan for night-time. Static map tiles of satellite imagery are rendered
Meteorological Agency became operational in July 2015, in using GDAL v2.2.2 (23) and served by a web server.
a geostationary orbit at 140.7◦ east, that provides coverage of Short-wave infrared composite based on bands 21.9,
Australia. The Advanced Himawari Imager (AHI) instrument 0.865, and 0.665 µm from the European Space Agency’s
onboard Himawari-8 returns imagery in 18 bands, with a ground Sentinel-2 multispectral satellite (27) were integrated from
resolution ranging from 0.5 to 2 km, and a temporal resolution Sentinel Hub’s public WMS server and integrated directly
Frontiers in Public Health | www.frontiersin.org 3 March 2020 | Volume 8 | Article 85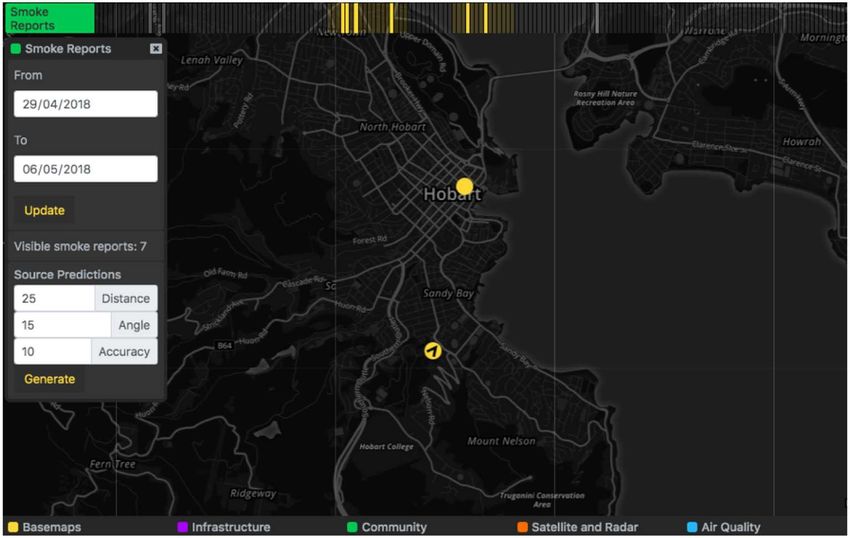
Williamson and Lucani                                                                                                              AQVx Smoke Pollution Display System

TABLE 1 | Air quality, satellite, and radar data sources included in AQVx.

Layer type            Layer                        Description                    Total time period           Time segment   Spatial resolution      Source*

Air Quality           PM2.5                        CSIRO CTM PM2.5                144 h past, 24 h forecast   1h             3 km smoothed           CSIRO, BoM
                      Smoke                        CSIRO CTM levoglucosan         144 h past, 24 h forecast   1h             3 km smoothed           CSIRO, BoM
                                                   scaled to PM2.5
                      Ozone                        CSIRO CTM ozone                144 h past, 24 h forecast   1h             3 km smoothed           CSIRO, BoM
                      Current temperature          Interpolated temperature       Current                     n/a            1 km smoothed           AirRater/BoM
                      Smoke sources                Planned burns and              24 h                        1h             n/a                     EMV
                                                   smoke-related incidents
                      EPA sites                    Daily and hourly PM2.5 for     24 h                        1h             n/a                     EPA
                                                   available EPA sites/stations
                      SMOG sensors                 Daily and hourly PM2.5         24 h                        1h             n/a                     CSIRO
                                                   recorded from SMOG
                                                   sensors
Satellite and radar   Radar Melbourne              128 km Melbourne radar         2h                          6 min          Variable                BoM
                      Radar Yarrawonga             128 km Yarrawonga radar        1.5 h                       30 min         Variable                BoM
                      Himawari IR                  Himawari 0.86 µm band          18 h                        10 min         1 km                    BoM, JMA
                      Himawari active fires        Thermal infrared detections    18 h                        10 min         1 km                    CSIRO, BoM, JMA
                                                   of active fires
                      Himawari Vis.                Himawari true-color visible    18 h                        10 min         500 m                   BoM, JMA
                                                   spectrum
                      Sentinel-2 SWIR              Short-wave infrared            4 weeks                     Daily          20 m                    S-HUB, ESA
                                                   composite based on bands
                                                   21.9, 0.865, 0.665
                      Geoscience hotspots          Recent detections of active    72 h                        –              –                       GEO-AU
                                                   fire hotspot locations from
                                                   MODIS and VIIRS
                                                   platforms

into the AQVx interface without pre-processing on the                                         2.1.6. Air Quality
AQVx server.                                                                                  Twenty-four and 1-h PM2.5 averages from low-cost particulate
                                                                                              sensors deployed in regional Victoria, and 8- and 1-h PM2.5 and
2.1.3. Radar                                                                                  air quality index (AQI) from EPA monitors via EPA’s Air Quality
Radar files in PPI format were downloaded every 6–30 min,                                     API web service, were incorporated into the database for display
depending on radar temporal resolution, from the Bureau of                                    at point locations.
Meteorology for the Melbourne and Yarrawonga (northern
Victoria) weather radar sites. While typically used to visualize                              2.1.7. Infrastructure and Population
precipitation, weather radar can detect returns from ash particles                            A list of government and non-government primary and
in smoke plumes from large fires, providing an additional                                     secondary schools for Victoria was sourced from the Victorian
source of plume verification. Radar files were interpreted in R                               Department of Education and Training, as well as aged care
v3.4.4 (24), converted to projected cartesian coordinates, and                                facilities derived from a Department of Health list of aged
rendered to map tiles for display.                                                            care services subsidized by the Australian Government under
                                                                                              the Aged Care Act 1997. Point locations of these facilities
2.1.4. Active Fire Hotspots                                                                   were displayed in the AQVx system to help identify sensitive
Active fire hotspots were provided by Geoscience Australia’s                                  populations in the path of modeled smoke plumes. To enable
Sentinel service (Geoscience Australia 2019), which incorporates                              visualization of broader population exposure, AQVx integrated
hotspot detections by the MODIS and VIIRS instruments.                                        Geoscience Australia’s National Exposure Information System
Real-time active fire visualization based on thermal infrared                                 (NEXIS) population density product, providing the number of
wavelengths was generated using a combination of the 1.61, 2.26,                              people per 10 km2 .
and 3.89 µm bands from Himawari-8 combined according to
a method developed by Naomi Benger (Australian Bureau of                                      2.1.8. Community
Meteorology, personal communication).                                                         The smartphone app, AirRater Smoke, was developed alongside
                                                                                              AQVx to crowd-source smoke and symptoms reports from
2.1.5. Smoke Sources                                                                          users. The Airrater Smoke application does not show the
Every 10 min the AQVx server processed the VicEmergency feed                                  same information as the AQVx interface, but instead provides
of alerts and prescribed burns and filters for smoke-related alerts                           a simpler map of monitor-derived particulate concentrations
and burns.                                                                                    and other meteorological data, as well as providing an

Frontiers in Public Health | www.frontiersin.org                                          4                                           March 2020 | Volume 8 | Article 85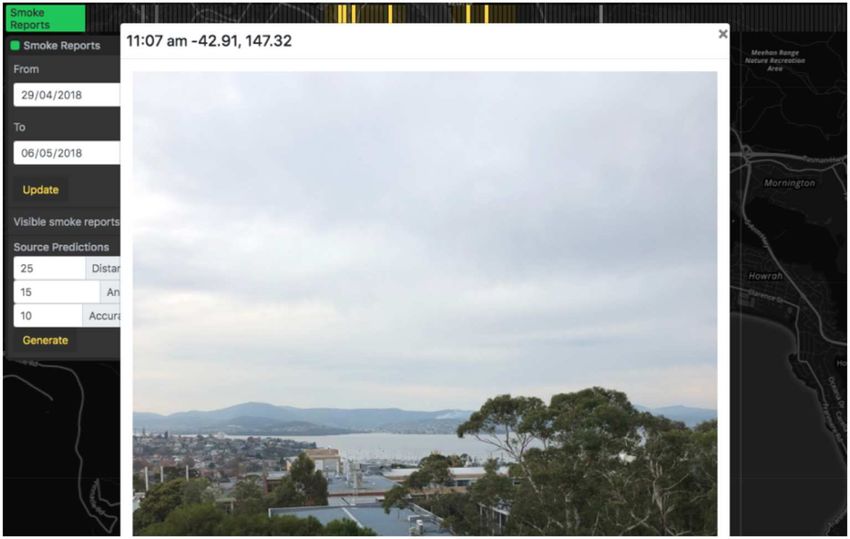
Williamson and Lucani                                                                                                               AQVx Smoke Pollution Display System

interface for submitting symptom and smoke reports. Users                               symptom data is not intended for epidemiological analysis, as
submitted symptom reports when experiencing symptoms, such                              user submission of symptoms may be biased, with users more
as shortness of breath or eye irritation. The collection of                             likely to use the app and submit symptoms when smoke is visible

 FIGURE 2 | Two domains of the AQFx chemical transport model, with the south-eastern Australia domain run at a 9 km resolution, and the inner Victoria-Tasmania
 domain run at a 3 km resolution.

 FIGURE 3 | The AQVx interface showing four key elements: (1) a time track for each layer that has time series data available; (2) layer controls provide layer-specific
 options and controls; themed menus (3) provide access to map layers; a legend is displayed for relevant layers (4).

Frontiers in Public Health | www.frontiersin.org                                    5                                                   March 2020 | Volume 8 | Article 85
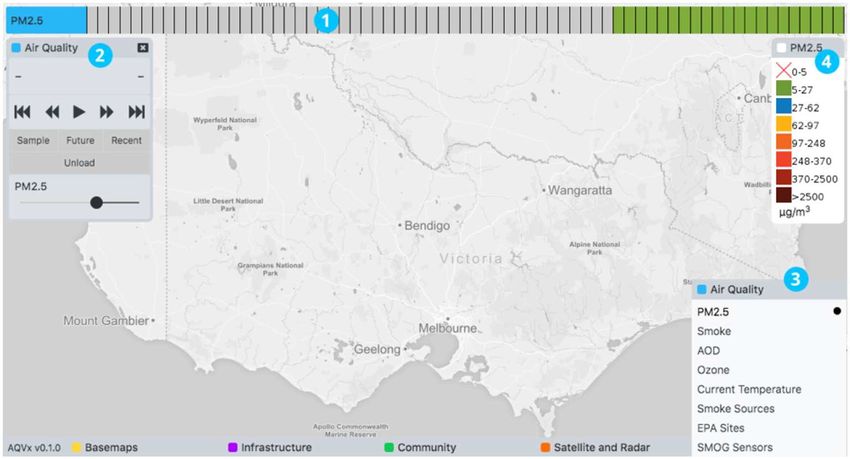
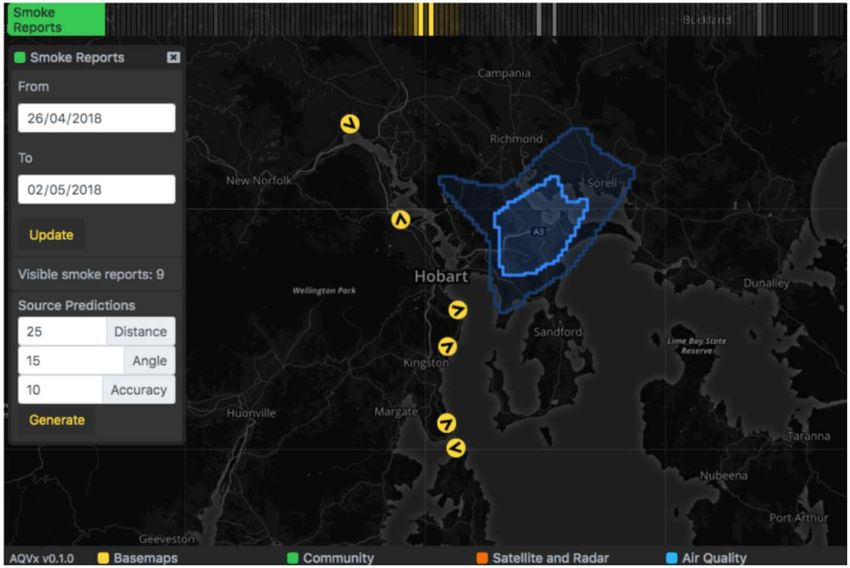
Williamson and Lucani                                                                                                               AQVx Smoke Pollution Display System

and present. Rather, it is intended as a rapid health surveillance                       2.2. AQVx Interface
tool, so operators can immediately identify locations where                              The AQVx interface was developed as a web-based tool to
smoke-related symptoms are being reported, and determine                                 maximize accessibility to operators and to facilitate immediate
whether particulate concentrations, according to ether model or                          deployment of fixes and updates. The tool was made available
monitor data, are elevated where symptoms are being reported.                            through a password-protected web address.
This provides an additional validation of model output.                                      Figure 3 provides an overview of the AQVx interface features.
   Users also submitted smoke reports when they could see                                The tool is map-centric, with data visually represented as
and/or smell smoke in the distance or at their current location.                         map layers of map tiles or map markers. Map layers were
If the smoke was in the distance the user was asked to take                              accessed through menus available at the bottom of the tool,
a photograph with their phone, and this image was stored on                              grouped in four broad themes: Air Quality, Satellite and Radar,
the AQVx server along with the orientation of the device in                              Community, and Infrastructure. Layer controls provide layer-
order enable triangulation of the plume location from multiple                           specific functionality and settings, such as layer opacity. A legend
reports. Plume triangulation was performed by generating a                               is displayed for all relevant map layers. Raw PM2.5 concentrations
raster image over the area of interest, with each cell’s value                           as µg m−3 are provided for the monitor and model layers,
calculated as the sum of a function of the distance of the cell to the                   rather than a unitless Air Quality Index (AQI), because
estimated “focal location” of each selected smoke report, based                          the Australian Ambient Air Quality National Environment
on camera orientation. Cells >15◦ in angular distance from the                           Protection Measure (NEPM) monitors regulatory exceedences
camera orientation vector, or further than 20 km from the camera                         in these units. In addition, the AQVx system is intended
location, are given a value of zero, and cell values increase as                         specifically for monitoring pollution relevant to landscape
they approach the orientation vector and camera location. Cells                          fire, and neither the AQFx model, nor individual monitoring
with higher total values represent areas where a smoke plume was                         stations, measure the complete suite of pollutants that comprise
more likely to be present.                                                               the AQI.

 FIGURE 4 | The time track provides a simple and intuitive mechanism for synchronizing and displaying time-series data from different sources while maintaining a
 simple representation of the data available. The entire time track represents the total duration available with each block representing a single time step. Hovering over
 a time step displays the time and blocks in other time tracks with coincident times are highlighted.

 FIGURE 5 | Map markers indicate smoke reports submitted via the AirRater Smoke app. The time track groups reports by the hour.

Frontiers in Public Health | www.frontiersin.org                                     6                                                   March 2020 | Volume 8 | Article 85
Williamson and Lucani                                                                                                          AQVx Smoke Pollution Display System

   Where time series data is available for a map layer it is                         6-min time steps, while CTM output provides hourly time steps
made available through an innovative “time track” feature that                       for a total of 144 h.
appeared at the top of the tool. Time tracks provide flexibility                        Within a time track, time series are divided into blocks that
in providing access to time series data from feeds that may                          represent individual time steps (Figure 4). Hovering the mouse
have significantly different total time periods and time steps. For                  pointer over a block displays the time the block represents. When
example, radar may be available for a total time period of 2 h with                  multiple layers and time tracks are loaded, hovering over a block

 FIGURE 6 | User-submitted photos of smoke are accessible through the AQVx interface.

 FIGURE 7 | Where multiple smoke reports and orientations are available, a “Source Predictions” function can be used to generate the likely region of smoke source
 based on the reports visible. The estimated source region is rendered on the map as a blue polygon.

Frontiers in Public Health | www.frontiersin.org                                 7                                                 March 2020 | Volume 8 | Article 85
Williamson and Lucani                                                                                                  AQVx Smoke Pollution Display System

 FIGURE 8 | Point values are available for CTM layers by clicking on the map.

in one time track automatically highlights blocks in other time                     pollutant plume location and direction of travel. AQVx integrates
tracks with coincident time. This provides a simple and intuitive                   two sources of on-the-ground air quality sensor data: data from
mechanism for synchronizing and displaying data from different                      low-cost SMOG sensors, and EPA monitors. An operator first
sources while maintaining a simple representation of the data                       activates the CTM PM2.5 data layer and selects the relevant time
available. For a dynamic perspective, time series data can be                       period from the time track at the top of the app. The “EPA Sites”
animated using layer animation controls.                                            map layer can then be overlaid, as well as the SMOG sensor map
   Symptoms and smoke reports are plotted on the map as                             layer, and the operator can hover the mouse pointer over the
markers and grouped in hour-long blocks on the relevant time                        target time period in any of the tracks to find the corresponding
track, and activating one block will display all reports that                       time in the other layers before selecting them for display. Visually
occurred within that hour on the map (Figure 5. Both types of                       the operator would compare the CTM output with the marker
reports appear as map markers that can be clicked to provide a                      colors for the EPA sites and SMOG sensors, or click on the map
summary of the report. If available, the photo taken of smoke                       to view a popup with the local CTM concentration. The marker
in the distance can be viewed from the smoke report summary                         colors for SMOG sensors and EPA sites are coordinated with the
(Figure 6). Markers for smoke reported in the distance display                      CTM PM2.5 layer scale allowing for an easy visual comparison. A
the orientation logged by the device at the time of capture. A                      video demonstration of this process is available online at: https://
“Source Prediction” function displays the likely region of smoke                    vimeo.com/333484388.
where the orientation and position of multiple smoke reports
were available, based on the plume triangulation calculation                        3.2. Cross-Referencing CTM PM2.5 With
(Figure 7). The source prediction region appeared as a polygon
on the map, surrounding regions where plume triangulation cell
                                                                                    Fires and Smoke Sources
                                                                                    Where a discrepancy is present between CTM output and other
values are greater than the median value and indicating likely
                                                                                    intelligence (e.g., on the-ground sensors or satellite imagery) it
smoke plume presence.
                                                                                    is useful to cross-reference current fires and smoke sources (fire
   Point location pollution concentrations are available for CTM
                                                                                    incidents and planned burns) as possible sources of inaccuracy
map layers by clicking a point on the map (Figure 8).
                                                                                    in the model, for example fires that may or may not have
                                                                                    been included in model generation, due to lack of detection of
3. USE CASES                                                                        fire at the time of the model run, or fires that are flagged as
                                                                                    continuing after they have been extinguished on the ground.
3.1. Cross-Referencing CTM PM2.5 With                                               Having loaded the CTM PM2.5 layer, the operator is able to
Observations                                                                        overlay the “Himawari Active Fires” and “Geoscience Hotspots”
A typical task for an AQVx operator would be to validate                            layers, synchronize time series data using the time tracks, and
the CTM output by cross-referencing with on-the-ground air                          visually compare detected fire presence with the model output,
quality sensors, to confirm similar pollutant concentrations                        and identify false-positive or negative smoke plume inclusion. A
between model and observation, either quantitatively in terms                       video demonstration of this process is available online at: https://
of concentration values at a point, or qualitatively in terms of                    vimeo.com/333485993.

Frontiers in Public Health | www.frontiersin.org                                8                                          March 2020 | Volume 8 | Article 85
Williamson and Lucani AQVx Smoke Pollution Display System
3.3. Assessing Community Impacts of locations from the Himawari-8 platform (29, 30), which will
Forecast PM2.5 provide rapid detection of fire ignition for incorporation into
Evaluating the potential health impact of forecast PM2.5 was emissions models, as well as live maps of fire spread.
a key output of the system. The AQVx operator activates the The current tool provides overlays of sensitive populations,
CTM PM2.5 layer and loads the forecast time series. Schools both as a population density layer and point locations of schools
and aged care facility locations are now overlaid as markers. and aged care facilities. In the state of Victoria, the Environmental
Animation controls are used to easily cycle through the forecast Protection Authority (EPA Victoria) is responsible for issuing air
time series, and the operator visually assesses the schools or aged quality notices to inform the community about potential smoke
care facilities that fall within regions of elevated PM2.5 through impacts, and actions that can be taken to reduce exposure for
the forecast period. For additional information about the schools sensitive groups, such as remaining inside, avoiding exercise, or
or aged care facilities that are affected, the operator clicks the icon operating indoor air filters or air conditioners. AQVx enables
to view address, phone number and facility details. The operator more precise targeting of these messages by assisting in the
can also load the NEXIS population density layer to evaluate the identification of potential smoke impacts on a local scale. A
impact on densely population areas throughout the forecast time potential future extension to AQVx is the incorporation of a
series. A video demonstration of this process is available online health impact assessment tool. Forecast pollutant concentrations,
at: https://vimeo.com/333485993. combined with mapped population density and incidence rates
for hospitalization and death (31), can be used to predict and
quantify significant health impacts from prescribed or wildfire
4. DISCUSSION smoke. Real-time health impact assessment would significantly
improve fire managers’ capacity for planning and understanding
Operators of the AQVx system over the 2019 Victorian prescribed burn impact, and integrating these calculations into
prescribed fire season reported that they found the system AQVx is a promising direction for future research.
valuable and useful, particularly in assessing the accuracy and Fire management through prescribed burn planning is
of the AQFx chemical transport model forecasts against on- increasingly under pressure to incorporate smoke management,
ground monitoring and field reports. The system was also used by through modeling and projecting smoke impacts and identifying
developers of the AQFx model during the catastrophic 2019/2020 episodes smoke exposure of sensitive populations. Recent
wildfire season to compare modeled PM2.5 concentration with increases in the availability of rapid, high resolution remote
monitor data and known fire locations, to validate model sensing data on landscape fire and smoke, along with innovations
accuracy and ensure correct paramaterization of active fires in the in pollutant transport modeling and low-cost on-ground
AQFx model. The need to ensure timely and accurate ingestion sensors, provide fire managers with increased opportunities for
of fire location data, including information on when fires are understanding and monitoring smoke. AQVx leverages the wide
controlled or extinguished, was highlighted by operators, as the variety of real-time spatial data, satellite imagery and model
AQVx interface enabled the occasional identification of modeled output now available to provide a simple, functional mapping
plumes extending from fires that had been extinguished, or the interface that allows for spatial and temporal overlay of diverse
lack of plumes from known fires that had not been incorporated data sources in order to facilitate smoke monitoring and inform
into model inputs. Development of the AQFx model is ongoing, transport model validation.
to improve model run time, and to better incorporate new fire
ignitions as they occur, through on-demand model runs after fire
locations are known, with model chemistry modules disabled to DATA AVAILABILITY STATEMENT
ensure rapid computation.
Symptom reports were submitted by member of the public The AQVx system is currently unavailable for public access due
during the 2019 Victorian prescribed fire season, although user to the display of geolocated personal user data and photographs
numbers were low during this trial period. The AQVx product within the system. Interested parties should contact the authors
will continue to be operational over the 2020 fire season, with to arrange access or a demonstration of functionality.
additional user recruitment to be encouraged.
The value of geostationary satellite products with sub-hourly
imagery (such as Himawari-8) to near-real-time analysis of
ETHICS STATEMENT
smoke concentration and dispersion was confirmed by operators, The research was approved by the Tasmanian Health and
who appreciated the availability of visible animated smoke Medical Human Research Ethics Committee (Reference
plumes in the interface, to compare with model output. Work number: H0015006).
is ongoing to incorporate an aerosol optical depth (AOD)
product (28) derived from Himawari-8 into the available data
layers. AOD provides a useful proxy for ground-level PM AUTHOR CONTRIBUTIONS
concentration beyond the range of fixed PM monitoring sites, but
existing satellite-based AOD products are only available at daily GW developed the GIS web mapping server pipeline and
timesteps. Frequent AOD grids from a geostationary platform directional smoke prediction algorithm, and wrote the
will greatly assist in chemical transport model validation. There manuscript. CL developed the AQVx front-end web display
is also ongoing research into the derivation of active fire hotspot system and wrote the manuscript.
Frontiers in Public Health | www.frontiersin.org 9 March 2020 | Volume 8 | Article 85Williamson and Lucani AQVx Smoke Pollution Display System
FUNDING ACKNOWLEDGMENTS
This work was funded by DELWP under the Bushfire and Natural We thank Martin Cope from the CSIRO for comments on this
Hazards CRC Emergency Risk Management Projects (ERPs) 4 manuscript.
and 5.
REFERENCES 16. Goodrick SL, Achtemeier GL, Larkin NK, Liu Y, Strand TM. Modelling
smoke transport from wildland fires: a review. Int J Wildl Fire. (2013) 22:83.
1. Reid CE, Brauer M, Johnston FH, Jerrett M, Balmes JR, Elliott CT. Critical doi: 10.1071/wf11116
review of health impacts of wildfire smoke exposure. Environ Health Perspect. 17. Bennett ND, Croke BFW, Guariso G, Guillaume JHA, Hamilton SH, Jakeman
(2016) 124:1334–43. doi: 10.1289/ehp.1409277 AJ, et al. Characterising performance of environmental models. Environ
2. Price OF, Horsey B, Jiang N. Local and regional smoke impacts Modell Softw. (2013) 40:1–20. doi: 10.1016/j.envsoft.2012.09.011
from prescribed fires. Nat Hazards Earth Syst Sci. (2016) 16:2247–57. 18. Johnston FH, Williamson GJ, Bowman DMJS. A review of approaches to
doi: 10.5194/nhess-16-2247-2016 monitoring smoke from vegetation fires for public health. Air Qual Climate
3. Ramakreshnan L, Aghamohammadi N, Fong CS, Bulgiba A, Zaki RA, Wong Change. (2010) 44:17–21.
LP, et al. Haze and health impacts in ASEAN countries: a systematic review. 19. Cope ME, Hess GD, Lee S, Tory K, Azzi M, Carras J, et al. The Australian air
Environ Sci Pollut Res. (2017) 25:2096–111. doi: 10.1007/s11356-017-0860-y quality forecasting system. Part I: project description and early outcomes. J
4. Dennekamp M, Abramson MJ. The effects of bushfire smoke on respiratory Appl Meteorol. (2004) 43:649–62. doi: 10.1175/2093.1
health. Respirology. (2011) 16:198–209. doi: 10.1111/j.1440-1843.2010.01868.x 20. Tolhurst K, Shields B, Chong D. Phoenix: development and application of a
5. Hanigan IC, Johnston FH, Morgan GG. Vegetation fire smoke bushfire risk management tool. Aust J Emerg Manag. (2008) 23:47.
indigenous status and cardio-respiratory hospital admissions in Darwin, 21. Geoscience Australia. Sentinel Hotspots. Geoscience Australia (2019).
Australia, 1996–2005: a time-series study. Environ Health. (2008) 7:42. Available online at: https://sentinel.ga.gov.au/
doi: 10.1186/1476-069x-7-42 22. Mann GW, Carslaw KS, Spracklen DV, Ridley DA, Manktelow PT,
6. Chen L, Verrall K, Tong S. Air particulate pollution due to bushfires and Chipperfield MP, et al. Description and evaluation of GLOMAP-mode: a
respiratory hospital admissions in Brisbane Australia. Int J Environ Health modal global aerosol microphysics model for the UKCA composition-climate
Res. (2006) 16:181–91. doi: 10.1080/09603120600641334 model. Geosci Model Dev. (2010) 3:519–51. doi: 10.5194/gmd-3-519-2010
7. Martin KL, Hanigan IC, Morgan GG, Henderson SB, Johnston FH. 23. GDAL/OGR contributors. GDAL/OGR Geospatial Data Abstraction Software
Air pollution from bushfires and their association with hospital Library (2019). Available online at: https://gdal.org
admissions in Sydney Newcastle and Wollongong, Australia 1994–2007. 24. R Core Team. R: A Language and Environment for Statistical Computing.
Aust N Z J Public Health. (2013) 37:238–43. doi: 10.1111/1753-6405. Vienna: R Core Team (2018). Available online at: https://www.R-project.org/
12065 25. Geoserver.org. GeoServer (2018). Available online at: http://geoserver.org
8. Johnston F, Hanigan I, Henderson S, Morgan G, Bowman D. Extreme air 26. Bessho K, Date K, Hayashi M, Ikeda A, Imai T, Inoue H, et al.
pollution events from bushfires and dust storms and their association with An introduction to Himawari-8/9- Japan’s new-generation geostationary
mortality in Sydney Australia 1994–2007. Environ Res. (2011) 111:811–6. meteorological satellites. J Meteorol Soc Jpn Ser II. (2016) 94:151–83.
doi: 10.1016/j.envres.2011.05.007 doi: 10.2151/jmsj.2016-009
9. Tham R, Erbas B, Akram M, Dennekamp M, Abramson MJ. The 27. Drusch M, Del Bello U, Carlier S, Colin O, Fernandez V, Gascon
impact of smoke on respiratory hospital outcomes during the 2002– F, et al. Sentinel-2: ESA’s optical high-resolution mission for GMES
2003 bushfire season Victoria, Australia. Respirology. (2009) 14:69–75. operational services. Remote Sens Environ. (2012) 120:25–36.
doi: 10.1111/j.1440-1843.2008.01416.x doi: 10.1016/J.RSE.2011.11.026
10. Edwards L, Williamson G, Williams S, Veitch M, Salimi F, Johnston F. Did fine 28. Qin Y, Steven ADL, Schroeder T, McVicar TR, Huang J, Cope M, et al. Cloud
particulate matter from the summer 2016 landscape fires in Tasmania increase cover in the Australian region: development and validation of a cloud masking
emergency ambulance dispatches? A case crossover analysis. Fire. (2018) 1:26. classification and optical depth retrieval algorithm for the advanced Himawari
doi: 10.3390/fire1020026 imager. Front Environ Sci. (2019) 7:20. doi: 10.3389/fenvs.2019.00020
11. Cruz MG, Sullivan AL, Gould JS, Bannister AJ, Hollis JJ, Hurley 29. Wickramasinghe C, Jones S, Reinke K, Wallace L. Development of a multi-
RJ. Anatomy of a catastrophic wildfire: the Black Saturday Kilmore spatial resolution approach to the surveillance of active fire lines using
East fire in Victoria, Australia. For Ecol Manag. (2012) 284:269–85. Himawari-8. Rem Sens. (2016) 8:932. doi: 10.3390/rs8110932
doi: 10.1016/j.foreco.2012.02.035 30. Xu G, Zhong X. Real-time wildfire detection and tracking in Australia
12. Teague B, McLeod R, Pascoe S. 2009 Victorian Bushfires Royal Commission– using geostationary satellite: Himawari-8. Rem Sens Lett. (2017) 8:1052–61.
Final Report. Melbourne, VIC: Government Printer for the State of Victoria doi: 10.1080/2150704x.2017.1350303
(2010). Available online at: http://royalcommission.vic.gov.au/Commission- 31. Broome RA, Johnston FH, Horsley J, Morgan GG. A rapid assessment of the
Reports/Final-Report.html impact of hazard reduction burning around Sydney May 2016. Med J Aust.
13. Inspector-General for Emergency Management. Review of Performance (2016) 205:407–8. doi: 10.5694/mja16.00895
Targets for Bushfire Fuel Management on Public Land. Melbourne, VIC:
Victorian Government (2015). Available online at: https://www.igem.vic.gov. Conflict of Interest: The authors declare that the research was conducted in the
au/reports-and-publications/igem-reports/review-of-performance-targets- absence of any commercial or financial relationships that could be construed as a
for-bushfire-fuel-management-on potential conflict of interest.
14. Department of Environment Land Water Planning. Reducing Victoria’s
Bushfire Risk: Fuel Management Report 2016–2017. Melbourne, VIC: State The reviewer MH and handling Editor declared their shared affiliation at
of Victoria (2017). Available online at: https://www.ffm.vic.gov.au/__data/ the time of review.
assets/pdf_file/0025/88450/DELWP0064_FuelManagementReport_2017_v6_
web_accessible.pdf Copyright © 2020 Williamson and Lucani. This is an open-access article distributed
15. Department of Environment Land Water Planning. Managing Victoria’s under the terms of the Creative Commons Attribution License (CC BY). The use,
Bushfire Risk: Fuel Management Report 2017–2018. Melbourne, VIC: distribution or reproduction in other forums is permitted, provided the original
State of Victoria (2018). Available online at: https://web.archive.org/web/ author(s) and the copyright owner(s) are credited and that the original publication
20190312184524/https://www.ffm.vic.gov.au/fuel-management-report- in this journal is cited, in accordance with accepted academic practice. No use,
2017-18/homepage distribution or reproduction is permitted which does not comply with these terms.
Frontiers in Public Health | www.frontiersin.org 10 March 2020 | Volume 8 | Article 85You can also read