Changes in tropical cyclones under stabilized 1.5 and 2.0 C global warming scenarios as simulated by the Community Atmospheric Model under the ...
←
→
Page content transcription
If your browser does not render page correctly, please read the page content below

Earth Syst. Dynam., 9, 187–195, 2018
https://doi.org/10.5194/esd-9-187-2018
© Author(s) 2018. This work is distributed under
the Creative Commons Attribution 4.0 License.

           Changes in tropical cyclones under stabilized 1.5 and
           2.0 ◦ C global warming scenarios as simulated by the
             Community Atmospheric Model under the HAPPI
                                 protocols
           Michael F. Wehner1 , Kevin A. Reed2 , Burlen Loring1 , Dáithí Stone1 , and Harinarayan Krishnan1
                          1 Lawrence    Berkeley National Laboratory, Berkeley, California 94720, USA
                     2 State   University of New York at Stony Brook, Stony Brook, New York 11794, USA
                                   Correspondence: Michael F. Wehner (mfwehner@lbl.gov)

                                   Received: 31 October 2017 – Discussion started: 6 November 2017
                                      Accepted: 17 January 2018 – Published: 28 February 2018

       Abstract. The United Nations Framework Convention on Climate Change (UNFCCC) invited the scientific
       community to explore the impacts of a world in which anthropogenic global warming is stabilized at only 1.5 ◦ C
       above preindustrial average temperatures. We present a projection of future tropical cyclone statistics for both
       1.5 and 2.0 ◦ C stabilized warming scenarios with direct numerical simulation using a high-resolution global
       climate model. As in similar projections at higher warming levels, we find that even at these low warming levels
       the most intense tropical cyclones become more frequent and more intense, while simultaneously the frequency
       of weaker tropical storms is decreased. We also conclude that in the 1.5 ◦ C stabilization, the effect of aerosol
       forcing changes complicates the interpretation of greenhouse gas forcing changes.

1   Introduction                                                     work Convention on Climate Change (UNFCCC) invited the
                                                                     International Panel on Climate Change (IPCC) to explore the
Changes in tropical cyclone intensity, frequency and distribu-       impacts of a world in which the expected average warming
tion are expected as the climate warms due to anthropogenic          remains less than or equal to 2.0 ◦ C over preindustrial levels.
changes in the composition of the atmosphere. While the              In particular, the UNFCCC requested an analysis of the fea-
development of a complete climate theory of tropical cy-             sibility and impacts of a target stabilized global mean tem-
clones remains elusive (Walsh et al., 2015), recent advances         perature of 1.5 ◦ C over preindustrial levels. The Half a de-
in high-performance computing enable multi-decadal simu-             gree Additional warming, Prognosis and Projected Impacts
lations of climate models at tropical-cyclone-permitting res-        (HAPPI) experimental protocol was designed in response to
olutions. Together with conceptual models, such numerical            this request to permit a comparison of the effects of stabi-
models are the tool of choice for investigating projected fu-        lizing anthropogenic global warming at 1.5 ◦ C over prein-
ture changes in tropical cyclones (Wehner et al., 2017a).            dustrial levels to 2.0 ◦ C (Mitchell et al., 2017). In this paper,
   Previous work has studied the impact of climate change            we present results from a high-resolution atmosphere–land
on tropical storms through idealized representations of future       model forced by the HAPPI prescriptions of sea surface tem-
climate through uniform increases in greenhouse gases and            perature (SST) and sea ice concentration.
sea surface temperature (Walsh et al., 2015; Wehner et al.,             The HAPPI experimental protocol consists of three
2015) or more realistic but more extreme cases of warming            parts (Mitchell et al., 2017). The “historical” part spec-
using the Representative Concentration Pathway (RCP4.5               ifies observed sea surface temperatures (SSTs) from the
or RCP8.5) scenarios (e.g., Camargo, 2013; Knutson et al.,           NOAA OI.v2 gridded monthly mean observational prod-
2015; Bacmeister et al., 2018). The United Nations Frame-            uct (Reynolds et al., 2002) over the period 1996–2015.

Published by Copernicus Publications on behalf of the European Geosciences Union.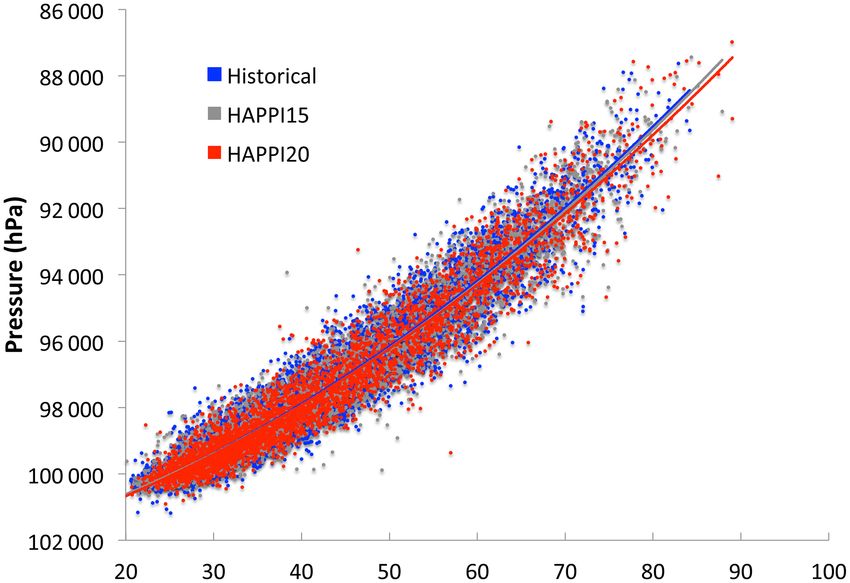
188                                      M. F. Wehner et al.: The Community Atmospheric Model under the HAPPI protocols

An estimate of SST and sea ice concentrations in stabi-              clone behavior in the four idealized climate change configu-
lized scenarios at both 1.5 and 2.0 ◦ C is constructed from          rations of the US CLIVAR Hurricane Working Group (Walsh
the CMIP5 (Coupled Model Intercomparison Project) multi-             et al., 2015). That project compared the combined effect of
model database of future climate projections under the               a spatially uniform 2 ◦ C increase applied to a climatological
RCP2.6 and RCP4.5 forcing scenarios hereafter designated             average of observed SST centered at 1990 and of a doubling
“HAPPI15” and “HAPPI20”. A stabilized anthropogenic cli-             of atmospheric CO2 to a control 1990 simulation, as well
mate change to these surface forcing functions is constant in        as the separate effects of each factor. Their principal finding
time. By adding such a change to the observations, observed          was that a lower-resolution (1◦ ) version of the CAM5 and
interannual variations are preserved. As such, historical year       methods based on the genesis potential index (Emanuel and
2006 is directly comparable to HAPPI15 or HAPPI20 year               Nolan, 2004) could not reproduce the sign of the change in
2106 as the date in the stabilized scenarios is arbitrarily in-      the global number of tropical cyclones produced by the high-
creased by 1 century. The original design of the HAPPI pro-          resolution version. Under the combined effect of the uniform
tocols follows that of the “Climate of the 20th Century Plus         2 ◦ C SST increase and CO2 doubling, the high-resolution
Detection and Attribution project” (C20C+) (Stone et al.,            CAM5 reduced the annual number of tropical storms (cate-
2017) and targets large ensembles of 50 realizations or more         gory 0–5) from 86±4 to 70±3. However, the annual number
to quantify the differences in projections (or attribution) of       of intense tropical cyclones (category 4–5) increased from
extreme events in specific years. However, at the high hor-          10±1.7 to 12±1.7. The two separate forcing simulations re-
izontal resolutions necessary to simulate tropical cyclones,         vealed that most of the reduction in the total number of trop-
the computational costs of the climate model are too high            ical storms of all intensities was caused by the change in the
to permit such a large number of simulations and ensem-              vertical temperature profile due to the CO2 doubling, while
ble sizes are restricted. Hence, in this study we pool results       the increase in the number of intense tropical cyclones was
across both simulation years and the ensembles for each part         caused solely by the increased SST. The warmer SST con-
of the HAPPI experiment to isolate the climate change signal,        ditions also caused the maximum wind speeds of the most
if any, from internal variability. As part of our participation in   intense storms to increase and their central pressure min-
the C20C+ project, we began the historical simulation period         ima to decrease, while CO2 doubling had the opposite effect.
in 1996 extending through 2015, thus permitting a more ro-           The peak of the zonally averaged tropical storm track den-
bust estimate of present day simulated tropical cyclone statis-      sity shifted poleward by ∼ 2◦ in the Northern Hemisphere
tics for comparison to the stabilized warmer climate.                and ∼ 4◦ in the Southern Hemisphere in all three perturbed
   This study uses the Community Atmospheric Model ver-              US CLIVAR configurations. A small poleward shift (∼ 1◦ ) in
sion 5.3 configured at a global resolution of approximately          Northern Hemisphere cyclogenesis origins was exhibited in
0.25◦ , roughly equaling a grid spacing of 28 km in tropi-           the two simulations with warmer SSTs but not the CO2 dou-
cal regions. Note that this participating model is listed as         bling only simulation, while all three perturbed simulations
“CAM5.1.2-0.25degree” in the HAPPI documentation (http:              exhibited a similar shift in the broader Southern Hemisphere
//portal.nersc.gov/c20c/data.html), but here it is abbreviated       cyclogenesis distribution.
to ”CAM5”. This configuration has been demonstrated to                  The SST and sea ice perturbations imposed by the HAPPI
produce reasonable annual numbers of tropical cyclones on            protocols exhibit the more realistic spatially varying SST
the global scale compared to observations (Bacmeister et al.,        patterns shown in Fig. 1 than the uniform increase in the
2014; Wehner et al., 2014; Reed et al., 2015). The formula-          US CLIVAR experiments. In the HAPPI protocols, warmer
tion of the dynamical core portion of the atmospheric model          configurations are produced by adding monthly climatolog-
does influence tropical cyclone counts and intensities (Reed         ical perturbations to the observed SSTs for each individual
et al., 2015). The model used in this study used CAM5’s              month, preserving the current patterns of SST variability. The
finite-volume-based dynamical core on a latitude–longitude           SST perturbations for the 1.5 ◦ C stabilization scenario are
grid (Lin and Rood, 1996, 1997; Lin, 2004). Storms up to cat-        taken directly from the multi-model mean of CMIP5 RCP2.6
egory 5 on the Saffir–Simpson scale are regularly produced,          simulations (which conveniently warm by approximately that
allowing for investigation into the effects of global warm-          amount on average above preindustrial temperatures). Ra-
ing on the distribution of tropical cyclone intensity. The rela-     diative forcings (greenhouse gas concentrations, burdens of
tionship between maximum wind speed and central pressure             various aerosol species and ozone concentrations) are also
minima was also demonstrated to be realistic (Wehner et al.,         taken directly from the RCP2.6 values. The 2.0 ◦ C scenario
2014). However, there are significant biases in track and cy-        uses SST perturbations and CO2 concentrations interpolated
clogenesis density, particularly in the Pacific Ocean with the       between CMIP5 RCP2.6 and RCP4.5 multi-model means,
model simulating too many storms in the central North Pa-            while other forcings remain the same as for the 1.5 ◦ C sce-
cific and too few in the northwestern part of that basin.            nario. Sea ice concentrations are computed using an adapted
   Nonetheless, the high-resolution CAM5 can be an infor-            version of the method described in Massey (2018) by using
mative tool to explore the change in tropical cyclone behavior       observations of SST and ice to establish a linear relationship
in altered climates. Wehner et al. (2015) explored tropical cy-      between the two fields for the time period 1996–2015 and

Earth Syst. Dynam., 9, 187–195, 2018                                                    www.earth-syst-dynam.net/9/187/2018/
M. F. Wehner et al.: The Community Atmospheric Model under the HAPPI protocols 189
Figure 2. Percent difference between the stabilized 2 ◦ C scenario
and the historical simulation of the total aerosol optical depth in the
visible band.
for both stabilization scenarios. Hence, there is a substan-
tial reduction in the aerosol forcing in the stabilization sim-
ulations compared to the historical simulations. Dunstone
et al. (2013) indirectly found a substantial reduction in At-
lantic tropical storms by varying aerosol forcing in the UK
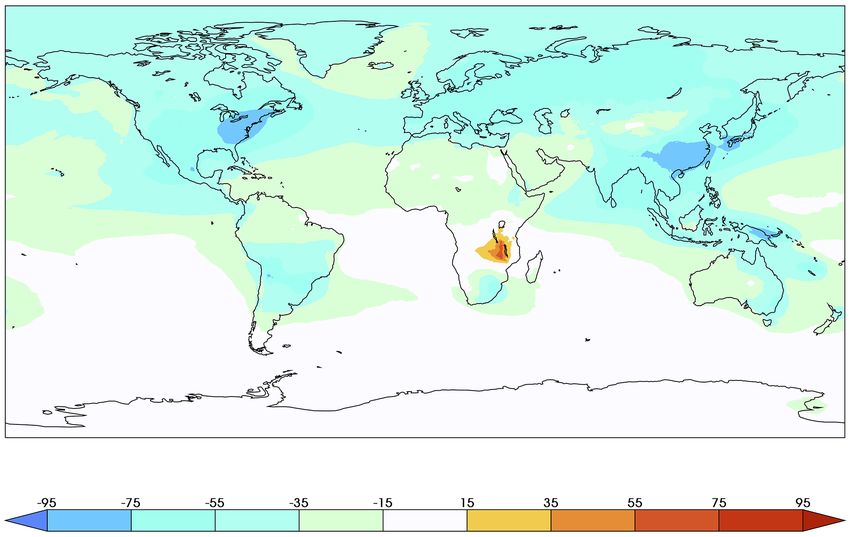
Figure 1. The temporal average of the imposed change (◦ C) in
MetOffice climate model HadGEM2-ES at a resolution of
sea surface temperature as prescribed by the HAPPI protocols: (a)
1.2◦ × 1.9◦ . In the CAM5 simulations presented here, we
1.5 ◦ C stabilization, (b) 2.0 ◦ C stabilization.
used its bulk aerosol model to prescribe aerosol concentra-
tions rather than emissions in order to reduce the computa-
tional burden (Kiehl et al., 2000). Huff et al. (2017) estab-
are consistent with the HAPPI prescribed SST fields. Details lished that CAM5 does exhibit sensitivity to aerosol formu-
are further described in Mitchell et al. (2017). Although they lation in the simulated number and intensity distribution of
represent a smaller perturbation to the climate system than tropical cyclones in the simulated current climate. However,
the US CLIVAR experiment, the HAPPI experiment is more the HAPPI protocol does not establish a controlled investiga-
physically consistent in terms of the relationship of the SST tion of the effects of the aerosol forcing reduction in the sta-
change to radiative forcing changes and in the distribution of bilized scenarios, nor have we performed such simulations
sea ice in the high latitudes, permitting the HAPPI simula- yet. Figure 2 shows the percent change in total aerosol op-
tions to be more widely applicable to phenomena outside of tical depth in the visible band comparing the historical and
the tropics. 2.0 ◦ C stabilization simulations averaged over all years and
The CAM5 simulations performed for the HAPPI project realizations. Significant decreases are evident over most of
consist of five realizations of the historical period plus six the Northern Hemisphere and the tropics. Results from the
realizations of each stabilization scenario. One of the his- 1.5 ◦ C stabilization simulations are the same.
torical realizations is incomplete due to computer resource
limitations, resulting in 96 simulated years for this part of
the dataset. Sixty simulated years were produced for both 2 Results
the 1.5 and 2.0 ◦ C stabilization scenarios. Data products
are freely available with further information provided at As in the US CLIVAR idealized experiments, the global
www.portal.nersc.gov/c20c. Simulated tropical cyclones are number of intense tropical cyclones (category 4 and 5) is
identified and tracked with the Toolkit for Extreme Climate substantially increased in the warmer climates of the HAPPI
Analysis (TECA2.) available for download and installation stabilization scenarios, with a statistical significance higher
at https://github.com/LBL-EESA/TECA using the methods than the 1 % level as shown in Fig. 3. Also as in the ide-
described in Knutson et al. (2007). alized warming experiments, the number of tropical storms
Another critical difference between the HAPPI and the (category 0) is substantially decreased in a warmer climate.
US CLIVAR experimental protocols is the aerosol forcing. However, the effect on the total number of named storms of
While the US CLIVAR protocols had no specified changes all intensities (category 0–5) is subtler in the HAPPI simula-
to aerosols, the HAPPI protocols set aerosol forcings to the tions. For this version of CAM5, the global annual number
end of the 21st century levels under the RCP2.6 scenario of category 0 to 5 storms is 73.4 ± 0.91 in the historical en-
www.earth-syst-dynam.net/9/187/2018/ Earth Syst. Dynam., 9, 187–195, 2018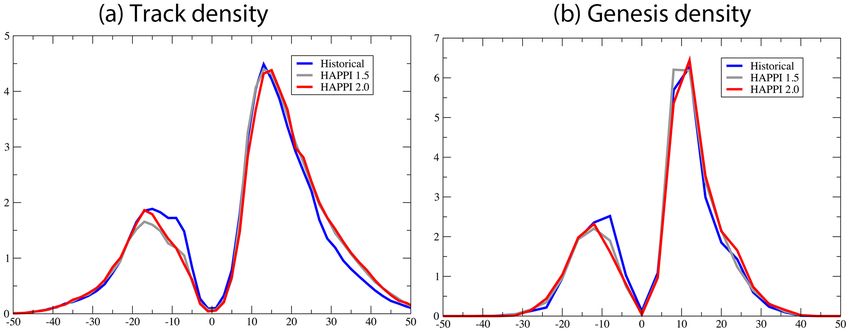
190                                                            M. F. Wehner et al.: The Community Atmospheric Model under the HAPPI protocols

      30
                                                                             category 2–4 storms in the 1.5 ◦ C stabilization scenario com-
                                                                                       pared to the historical simulations, those increases are atten-
      25
                                                                             uated in the warmer 2.0 ◦ C stabilization scenario. However,
                                           Historical
                                the most intense storms (category 5) exhibit consistent in-
      20

                                           HAPPI1.5
                                  creases in track length and duration on average as the cli-
                                           HAPPI2.0

                                                                                       mate system warms. Translational speed (here averaged over
      15

                                                                                       the entire storm duration) increases in all three ensembles
                                                                                       with storm intensity but the differences among scenarios are
      10

                                                                                       complex. Notably, while increases in average translational
        5

                                                                                       speed in the warmer scenarios are simulated for storms in the
                                                                                       middle of the Saffir–Simpson scale, decreases are simulated
        0

                                                                                       for the most intense category. While all of the differences in
                0
     1
     2
                    3
         4
     5
         Fig. 4 are statistically significant well above the 1 % level
                                        Category

                                                                                       due to the large number of storms tracked, subtle changes in
Figure 3. Global annual number of tropical cyclones by Saffir–                         the experimental design, including changes in SST pattern or
Simpson scale for the historical (blue), 1.5 ◦ C stabilization scenario                aerosol forcing, might alter these results. Better quantifica-
(gray) and 2 ◦ C stabilization scenario (red). Error bars are the stan-                tion of this type of structural uncertainty will require further
dard errors based on interannual variability. Blue: historical. Gray:                  developments in high-performance computing technologies
1.5◦ stabilization. Red: 2.0◦ stabilization.                                           to permit more diverse experiments.
                                                                                          The zonal average of the normalized density of storm
                                                                                       tracks of all intensities for the HAPPI scenarios is shown in
semble1 . In the 1.5 ◦ C stabilization scenario, this number is                        Fig. 5a. As mentioned above, CAM5 is known to have a sig-
only reduced to 72.5 ± 1.2, which is not significant at a 10 %                         nificant bias in the genesis location of Pacific tropical storms
significance level. However, in the 2.0 ◦ C stabilization sce-                         although the total number, both in that basin and globally, is
nario, a further reduction to 67.5 ± 1.3 is realized, which is                         not far from observed records. More detailed but somewhat
significant at the 1 % level. In the cooler stabilization sce-                         noisy maps of track density differences among the HAPPI
nario, the decrease in category 0 storms is roughly offset by                          scenarios are shown Fig. S1 in the Supplement. Integrating
the increase in intense storms, leading to the insignificance of                       over all longitudes, as in Fig. 5, damps this noise, revealing a
the change in the total number of storms. In the warmer sce-                           poleward shift in the warmer HAPPI scenarios compared to
nario, the yet larger decrease in category 0 causes the change                         the historical simulations. In the Northern Hemisphere, there
in the total number of storms to be more significant. In both                          is a tendency for a substantially larger normalized density of
stabilization scenarios, the changes from the historical simu-                         storm tracks poleward of 25◦ N in both the Atlantic and Pa-
lation in category 1, 2 and 3 storms are not statistically sig-                        cific Ocean basins (see Fig. S1). This may partially explain
nificant above the 5 % level. Differences between the 1.5 and                          the increased track lengths and durations shown in Fig. 4.
2 ◦ C stabilization scenarios are only highly significant in the                       With warmer temperatures, conditions that can sustain trop-
decrease by category for the number of the weakest category                            ical storm wind speeds extend poleward. Although not con-
of storms. Importantly, the differences in the number of in-                           sidered here, there is potential for an anthropogenic influence
tense tropical cyclones between the two warming scenarios                              on the transition to extratropical characteristics of storms that
are not statistically significant in this study. The results pre-                      undergo them (Liu et al., 2017; Zarzycki et al., 2017). In the
sented in Fig. 3 are repeated numerically in Table 1. Basin-                           Southern Hemisphere, Fig. 5 reveals that normalized storm
specific results are tabulated in the Supplement.                                      track density is a narrower function of latitude in the warmer
   Average storm track length, duration and mean transla-                              HAPPI scenarios. Figure S1 reveals that this is mainly due to
tional speed are shown for the HAPPI scenarios as a func-                              a change in the location of simulated tropical storms in the
tion of maximum lifetime intensity on the Saffir–Simpson                               southern Indian Ocean. In both hemispheres, differences be-
scale in Fig. 4. Weak storms (category 0) show no substan-                             tween the 1.5 and 2.0 ◦ C stabilization scenarios are smaller
tial changes in track length, translational speed or duration                          and noisier, making any differences in track density between
among the three ensembles of CAM5 simulations and this re-                             them difficult to interpret. The statistical significance of the
sult is consistent with the US CLIVAR experiments (Wehner                              larger differences in normalized track density between the
et al., 2015). While these three metrics show increases for                            historical and warmer stabilized scenarios is very high as as-
    1 The historical annual global tropical storm counts over all cat-                 sessed by a comparison of the standard errors.
egories differ from the 1990 climatological simulations of Wehner                         The zonal average of the normalized cyclogenesis den-
et al. (2015) for three reasons: (1) SSTs are slightly different, (2)                  sity for tropical storms of all intensities is shown in Fig. 5b.
the version of CAM5 is a more recent release (CESM v1.2.2 vs.                          Again, more detailed but noisy maps of cyclogenesis density
v1.0.3) and (3) there are subtle differences in the implementation of                  differences among the HAPPI scenarios are shown in Fig. S2.
the tracking algorithm.                                                                In the Northern Hemisphere, a much smaller poleward shift

Earth Syst. Dynam., 9, 187–195, 2018                                                                       www.earth-syst-dynam.net/9/187/2018/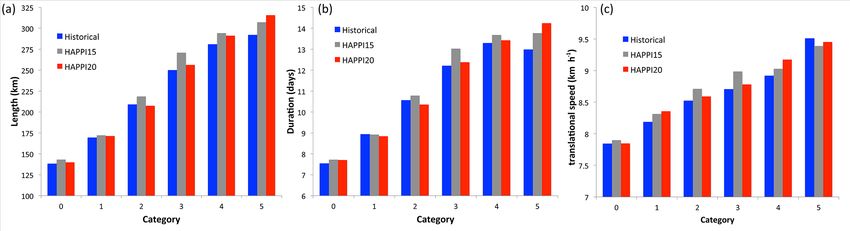
M. F. Wehner et al.: The Community Atmospheric Model under the HAPPI protocols                                                                 191

Table 1. Differences in CAM5 simulated global annual tropical storm counts by Saffir–Simpson scale between the two HAPPI stabilization
scenarios, the historical simulation and each other. Differences that are statistically significant at the 1 % level are in bold, while those at the
10 % level are in italics.

                             Saffir–Simpson                   0–5        0        1        2        3        4      5
                             HAPPI15 minus historical        −0.9     −4.5     −0.4      0.2      0.6      2.1    1.2
                             HAPPI20 minus historical        −5.9     −7.2     −1.0     −0.4     −0.1      1.4    1.2
                             HAPPI20 minus HAPPI15           −5.0     −2.6     −0.5     −0.5     −0.7     −0.6    0.1

Figure 4. (a) Average tropical storm track length (km) for the HAPPI scenarios as a function of maximum intensity on the Saffir–Simpson
scale. (b) Average tropical storm track duration (days) for the HAPPI scenarios as a function of maximum intensity on the Saffir–Simpson
scale. (c) Average tropical storm track speed (km h−1 ) for the HAPPI scenarios as a function of maximum intensity on the Saffir–Simpson
scale. Blue: historical. Gray: 1.5◦ stabilization. Red: 2.0◦ stabilization.

than for track density starting at about 15◦ N is simulated                  are dominated by similar changes in the North Atlantic and
in the warmer HAPPI scenarios compared to the historical                     Northeast Pacific. Changes in the Northwest Pacific do not
simulations. Figure S2 suggests that much of this change is                  exhibit large changes but CAM5 has a significant cyclogen-
coming from the Atlantic Ocean, but these cyclogenesis dif-                  esis location bias in the Pacific Ocean that may be relevant.
ferences are not as compelling as they are for the tropical                  While the total number of simulated North Pacific storms is
storm tracks. In the Southern Hemisphere, the cyclogenesis                   a reasonable representation of observations (Wehner et al.,
changes are similar to the track changes in both Fig. 5 and                  2014), Northwestern Pacific storms originate too far to the
the Supplement. Hence, we can conclude that the shifts in                    east, causing cyclogenesis and track densities to be too high
Southern Hemisphere tracks are mainly a result of cyclogen-                  in the central Pacific; this is the focus of current research
esis shifts that are mostly in the southern Indian Ocean.                    to be presented elsewhere. Also of note is that ACE in the
   The annual accumulated cyclonic energy (ACE) is shown                     Southern Hemisphere does not change despite the cyclogen-
in Fig. 6 for the historical and HAPPI stabilization scenarios               esis and track changes discussed above.
both globally and by the major ocean basins with tropical cy-                   Figure 7 shows the relationship between peak wind speeds
clone activity. ACE is a measure of the annual kinetic energy                and central pressure minima at the time of maximum inten-
contained in tropical storms and is obtained by squaring the                 sity for the three HAPPI ensembles. As there are no changes
maximum sustained surface wind in the system every 6 h and                   to the model configuration among the simulations other than
summing it up for the year (http://www.cpc.ncep.noaa.gov/                    forcing conditions, this relationship does not significantly
products/outlooks/background_information.shtml). Compar-                     change other than the appearance of combinations of wind
ison with an observational estimate taken from Maue (2011)                   speed and pressure at the very highest simulated intensities
suggests that the model is overactive by this measure of tropi-              in the warmer simulations that do not occur in the histor-
cal cyclone activity, although differences in the methods with               ical simulation. The peak wind speed and central pressure
which tracks and wind speeds are calculated could explain                    minima relationship is controlled by the mechanical con-
some of the biases shown in Fig. 6. Globally, ACE is mainly                  straints of gradient wind balance, storm size and Coriolis
increased in the 1.5 ◦ C stabilization scenario by the increase              force (Chavas et al., 2017; Chavas, private communication,
in the number of intense tropical cyclones. Increases in aver-               October 2017). The small poleward shift in the track den-
age storm duration also lead to in the increase in ACE. How-                 sity (Fig. 5) and subtle structural changes in wind speed radii
ever, as the total number of storms is significantly decreased               discussed below are not large enough to change this relation-
in the 2.0 ◦ C stabilization scenario, ACE is decreased com-                 ship. Warmer temperatures do change the distribution of peak
pared to the cooler stabilization scenario. The global changes               wind speeds and central pressure minima (Fig. 3) but do not

www.earth-syst-dynam.net/9/187/2018/                                                                Earth Syst. Dynam., 9, 187–195, 2018
192 M. F. Wehner et al.: The Community Atmospheric Model under the HAPPI protocols
Figure 5. (a) Zonally averaged normalized tropical storm track density for the HAPPI scenarios. (b) Zonally averaged normalized tropical
storm genesis density for the HAPPI scenarios. Blue: historical. Gray: 1.5◦ stabilization. Red: 2.0◦ stabilization.
1100
Observa9ons
1000
Historical
900
HAPPI1.5
800
HAPPI2.0
700
600
500
400
300
200
100
0
Figure 7. Scatterplot of minimum central pressure (hPa) versus
Global
NH
SH
North
NE
NW
North
South
South
Atlan9c
Pacific
Pacific
Indian
Indian
Pacific
maximum wind speed (m s−1 ) at the time of maximum intensity for
the HAPPI simulations. Blue: historical. Gray: 1.5◦ stabilization.
Figure 6. Average annual accumulated cyclonic energy (ACE) Red: 2.0◦ stabilization. Solid lines are quadratic fits to the data.
for the historical and HAPPI stabilization scenarios for all named
storms by basin and globally for intense tropical cyclones only.
Units: 1 ACE = 104 knots. Green: observations. Blue: historical. culated for all storms. For instance, we calculate six Chavas
Gray: 1.5◦ stabilization. Red: 2.0◦ stabilization. Error bars are stan- radii for a category 5 storm (one for each Saffir–Simpson
dard errors based on interannual variability. threshold) as all six Saffir–Simpson wind speeds are present
at some point in such storms. Likewise, only a single Chavas
radius for a category 0 storm and the higher wind speeds are
appear to substantially change how they co-vary. We note, not realized. The CAM5 HAPPI simulations exhibit about a
however, that model resolution and structure may influence 5 % increase in category 0 Chavas radii and a smaller (2–
the simulation of this relationship, thus requiring that evalu- 3 %) increase in category 1 Chavas radii in the warmer sta-
ation of the effect of forcing changes on tropical storm statis- bilized climates. Little change in Chavas radii is simulated
tics only be done with simulations from the same version of for more intense wind speeds except for category 5 storms
the climate model. in the 2 ◦ C stabilization scenario that experience an 8 % in-
A definition of the physical size of tropical storms has re- crease in Chavas radius. The increase in weak-wind-speed
cently been developed by Chavas et al. (2015) by defining Chavas radii may be due to the change in the track den-
an approximate radius at specified wind speeds. Figure 8 sity discussed above. The increased tracked tropical storms
shows average Chavas radii for the historical and HAPPI at higher latitudes are likely to be in the lower categories and
stabilization scenarios. Radii are calculated every 3 h over may be starting their extratropical transition but still main-
the duration of every tracked storm for the threshold wind taining high winds. The increase in category 5 Chavas radii
speeds defining the Saffir–Simpson categories and for the in only the warmer of the two HAPPI stabilizations currently
storm maximum wind speeds. Each relevant radius is cal- lacks an explanation. Planned simulations of this version of
Earth Syst. Dynam., 9, 187–195, 2018 www.earth-syst-dynam.net/9/187/2018/M. F. Wehner et al.: The Community Atmospheric Model under the HAPPI protocols 193
derstanding of tropical storm frequency in aggressively sta-
200
bilized climates requires detailed descriptions of the changes
Historical
in those forcings. This would be particularly critical in geo-
175
engineering schemes relying on solar radiation management.
HAPPI15
However, as found by Bacmeister et al. (2018) in their com-
150
HAPPI20
parison of RCP4.5 to RCP8.5, major uncertainties in the pat-
tern of SST changes also pose a significant challenge in ac-
125
curately projecting future tropical storm frequency.
Changes in other important characteristics of tropical cy-
100
clone behavior are subtler. Both warmer climate conditions
considered here project significant changes in the poleward
75
density of tropical storm tracks compared to the historical
simulations, but the differences between them are not likely
50
0
1
2
3
4
5
to be highly significant. Also, changes in accumulated cy-
clonic energy (ACE), storm duration, track length and trans-
Figure 8. Chavas radii at different wind speeds selected as the def- lational speed are complex with the differences clearly ev-
initions of the Saffir–Simpson categories (km) for the HAPPI sim- ident for only the most intense storms. Finally, some prop-
ulations. Blue: historical. Gray: 1.5◦ stabilization. Red: 2.0◦ stabi- erties of tropical cyclones are not significantly altered in
lization. warmer climates, most notably the robust relationship be-
tween maximum wind speeds and central pressure minima.
CAM5 with the so-called unHAPPI protocols (stabilized at
3 and 4 ◦ C above preindustrial levels) may provide some in-
Data availability. The tracking software used in this study is
sight into these aspects of change in storm structure. the Toolkit for Extreme Climate Analysis (TECA2.) available for
download and installation at https://github.com/LBL-EESA/TECA.
Data for this study total 23 TB and are currently available for down-
3 Conclusions
load from the tape storage archive at the National Energy Research
Supercomputing Center via anonymous wget scripts provided via
The Half a degree Additional warming, Prognosis and Pro-
the following DOI link: https://doi.org/10.25342/HAPPI_TC_2018.
jected Impacts (HAPPI) experimental protocol was designed Because of the large dataset size, wget transfers of the entire
to rapidly inform the Intergovernmental Panel on Climate database will likely be slow, and interested parties should contact
Change about the differences between stabilized climate at the authors for faster access. As data transfer technologies serving
1.5 and 2.0 ◦ C above preindustrial global temperatures. How- this database evolve, faster alternatives will be offered via the DOI
ever, it does not isolate all of the effects of forcing changes link.
required to stabilize the climate from the present day con-
ditions. In particular, the effect of sulfate aerosol reductions
in the atmosphere has a nonlocal effect in the HAPPI sim- The Supplement related to this article is available online
ulations and has been demonstrated to be important to as- at https://doi.org/10.5194/esd-9-187-2018-supplement.
sessing changes in tropical cyclones (Huff et al., 2017) and
heat waves (Wehner et al., 2017b). As the radiative forcing
changes due to CO2 between the historical and 1.5 ◦ C scenar-
ios may be smaller than the forcing changes due to aerosols,
the CO2 effects in tropical storms may be comparable or even Competing interests. The authors declare that they have no con-
smaller due to the aerosol effects at this stabilization level. flict of interest.
It is fair to say that the simulated differences in tropical cy-
clone statistics between the 1.5 and 2.0 ◦ C stabilization sce-
narios as defined by the HAPPI protocols are small. Indeed, Special issue statement. This article is part of the special issue
“The Earth system at a global warming of 1.5 ◦ C and 2.0 ◦ C”. It is
both warmer climates produce fewer tropical storms over all
not associated with a conference.
intensities in the global sense and the reduction increases as
the sea surface temperature (SST) becomes warmer. Also, the
most intense storms become more intense in both warmer
Acknowledgements. The work at LBNL was supported by the
SST configurations with the highest peak wind speeds and Regional and Global Modeling Program as part of the Calibrated
lowest central pressure minima simulated in the warmer of and Systematic Characterization, Attribution, and Detection of Ex-
the two stabilizations. tremes project (CASCADE). LBNL is operated for the Department
Given the similarities between the two HAPPI scenarios of Energy’s Office of Science under contract number DE-AC02-
and the importance of aerosol forcings, a more complete un- 05CH11231. This document was prepared as an account of work
www.earth-syst-dynam.net/9/187/2018/ Earth Syst. Dynam., 9, 187–195, 2018194 M. F. Wehner et al.: The Community Atmospheric Model under the HAPPI protocols
sponsored by the United States Government. While this document Huff, J. J. A., Reed, K. A., Bacmeister, J. B., and Wehner, M.
is believed to contain correct information, neither the United States F.: Evaluating the Influence of CAM5 Aerosol Configuration
Government nor any agency thereof, nor the Regents of the Univer- on Simulated Tropical Cyclones in the North Atlantic, J. Adv.
sity of California, nor any of their employees, makes any warranty, Model. Earth Syst., in review, 2017.
express or implied, or assumes any legal responsibility for the ac- Kiehl, J. T., Schneider, T. L., Rasch, P. J., Barth, M. C., and Wong,
curacy, completeness, or usefulness of any information, apparatus, J.: Radiative forcing due to sulfate aerosols from simulations
product, or process disclosed, or represents that its use would not with the National Center for Atmospheric Research Community
infringe privately owned rights. Reference herein to any specific Climate Model, Version 3, J. Geophys. Res., 105, 1441–1457,
commercial product, process, or service by its trade name, trade- https://doi.org/10.1029/1999JD900495, 2000.
mark, manufacturer, or otherwise, does not necessarily constitute or Knutson, T. R., Sirutis, J. J., Garner, S. T., Held, I., and
imply its endorsement, recommendation, or favoring by the United Tuleya, R. E.: Simulation of the Recent Multidecadal In-
States Government or any agency thereof, or the Regents of the Uni- crease of Atlantic Hurricane Activity Using an 18-km-Grid
versity of California. The views and opinions of authors expressed Regional Model, B. Am. Meteorol. Soc., 88, 1549–1565,
herein do not necessarily state or reflect those of the United States https://doi.org/10.1175/BAMS-88-10-1549, 2007.
Government or any agency thereof or the Regents of the University Knutson, T. R., Sirutis, J. J., Zhao, M., Tuleya, R. E., Bender, M.,
of California. Vecchi, G. A., Villarini, G., and Chavas, D.: Global Projections
Work at Stony Brook University was supported by the Depart- of Intense Tropical Cyclone Activity for the Late Twenty-First
ment of Energy’s Office of Science under contract number DE- Century from Dynamical Downscaling of CMIP5/RCP4.5 Sce-
SC0016605. narios, J. Climate, 28, 7203–7224, https://doi.org/10.1175/JCLI-
These simulations were performed using resources of the D-15-0129.1, 2015.
National Energy Research Scientific Computing Center, a DOE Lin, S.-J.: A “vertically Lagrangian” finite-volume dynamical core
Office of Science User Facility supported by the Office of Science for global models, Mon. Weather Rev., 132, 2293–2307, 2004.
of the US Department of Energy, also under contract no. DE-AC02- Lin, S.-J. and Rood, R. B.: Multidimensional flux-form semi-
05CH11231. Lagrangian transport scheme, Mon. Weather Rev., 124, 2046–
2070, 1996.
Edited by: Ben Kravitz Lin, S.-J. and Rood, R. B.: An explicit flux-form semi-Lagrangian
Reviewed by: two anonymous referees shallow water model on the sphere, Q. J. Roy. Meteorol. Soc.,
123, 2477–2498, 1997.
Liu, M., Vecchi, G. A., Smith, J. A., and Murakami, H.: The
References Present-Day Simulation and Twenty-First-Century Projection of
the Climatology of Extratropical Transition in the North Atlantic,
Bacmeister, J. T., Wehner, M. F., Neale, R. B., Gettelman, A., Han- J. Climate, 30, 2739–2756, https://doi.org/10.1175/JCLI-D-16-
nay, C., Lauritzen, P. H., Caron, J. M., and Truesdale, J. E.: Ex- 0352.1, 2017.
ploratory High-Resolution Climate Simulations using the Com- Massey, N.: Generating sea ice patterns and uncertainty from cou-
munity Atmosphere Model (CAM), J. Climate, 27, 3073–3099, pled climate models, J. Geophys. Res., in preparation, 2018.
https://doi.org/10.1175/JCLI-D-13-00387.1, 2014. Maue, R. N.: Recent historically low global tropical
Bacmeister, J. T., Reed, K. A., Hannay, C., Lawrence, P. J., cyclone activity, Geophys. Rev. Lett., 38, L14803,
Bates, S. C., Truesdale, J. E., Rosenbloom, N. A., and Levy, https://doi.org/10.1029/2011GL047711, 2011.
M. N.: Projected changes in tropical cyclone activity under fu- Mitchell, D., AchutaRao, K., Allen, M., Bethke, I., Beyerle,
ture warming scenarios using a high-resolution climate model, U., Ciavarella, A., Forster, P. M., Fuglestvedt, J., Gillett, N.,
Clim. Change, 146, 547–560, https://doi.org/10.1007/s10584- Haustein, K., Ingram, W., Iversen, T., Kharin, V., Klingaman,
016-1750-x, 2018. N., Massey, N., Fischer, E., Schleussner, C.-F., Scinocca, J., Se-
Camargo, S. J.: Global and Regional Aspects of Tropical Cy- land, Ø., Shiogama, H., Shuckburgh, E., Sparrow, S., Stone, D.,
clone Activity in the CMIP5 Models, J. Climate, 26, 9880–9902, Uhe, P., Wallom, D., Wehner, M., and Zaaboul, R.: Half a degree
https://doi.org/10.1175/JCLI-D-12-00549.1, 2013. additional warming, prognosis and projected impacts (HAPPI):
Chavas, D. R., Lin, N., and Emanuel, K.: A model for the complete background and experimental design, Geosci. Model Dev., 10,
radial structure of the tropical cyclone wind field. Part I: Com- 571–583, https://doi.org/10.5194/gmd-10-571-2017, 2017.
parison with observed structure, J. Atmos. Sci., 72, 3647–3662, Reed, K. A., Bacmeister, J. T., Rosenbloom, N. A., Wehner, M. F.,
https://doi.org/10.1175/JAS-D-15-0014.1, 2015. Bates, S. C., Lauritzen, P. H., Truesdale, J. E., and Hannay, C.:
Chavas, D. R., Reed, K. A., and Knaff, J. A.: Physical understanding Impact of the dynamical core on the direct simulation of tropical
of the tropical cyclone wind-pressure relationship, Nat. Comm., cyclones in a high-resolution global model, Geophys. Res. Lett.,
8, 1–11, https://doi.org/10.1038/s41467-017-01546-9, 2017. 42, 3603–3608, https://doi.org/10.1002/2015GL063974, 2015.
Dunstone, N. J., Smith, D. M., Booth, B. B. B., Her- Reynolds, R. W., Rayner, N. A., Smith, T. M., Stokes, D. C., and
manson, L., and Eade, R.: Anthropogenic aerosol forc- Wang, W. C.: An improved in situ and satellite {SST} analysis
ing of Atlantic tropical storms, Nat. Geosci., 6, 534–539, for climate, J. Climate, 15, 1609–1625, 2002.
https://doi.org/10.1038/ngeo1854, 2013. Stone, D. A., Christidis, N., Folland, C., Perkins-Kirkpatrick, S.,
Emanuel, K. and Nolan, D. S.: Tropical cyclone activity and the Perlwitz, J., Shiogama, H., Wehner, M. F., Wolski, P., Cholia, S.,
global climate system, Preprints, 26th Conf. on Hurricanes and Krishnan, H., Murray, D., Ang’elil, O., Beyerle, U., Ciavarella,
Tropical Meteorology, Miami, FL, Am. Meteorol. Soc., 240– A., Dittus, A., and Quan, X.-W.: Experiment design of the In-
241, 2004.
Earth Syst. Dynam., 9, 187–195, 2018 www.earth-syst-dynam.net/9/187/2018/M. F. Wehner et al.: The Community Atmospheric Model under the HAPPI protocols 195 ternational CLIVAR C20C+ Detection and Attribution Project. Wehner, M. F., Reed, K. A., and Zarzycki, C. M.: High-Resolution Weather and Climate Extremes, in preparation, 2017. Multi-Decadal Simulation of Tropical Cyclones, Chapter 8 in Walsh, K. J. E., Camargo, S., Vecchi, G., Daloz, A. S., Elsner, J., Hurricanes and Climate Change, edited by: Collins, J. and Walsh, Emanuel, K., Horn, M., Lim, Young-K., Roberts, M., Patricola, K., Springer, 187–207, 2017a. C., Scoccimarro, E., Sobel, A., Strazzo, S., Villarini, G., Wehner, Wehner, M., Stone, D., Mitchell, D., Shiogama, H., Fischer, E., M., Zhao, M., Kossin, J., LaRow, T., Oouchi, K., Schubert, S., Graff, L. S., Kharin, V. V., Sanderson, B., and Krishnan, H.: Wang, H., Bacmeister, J., Chang, P., Chauvin, F., Jablonowski, Changes in extremely hot days under stabilized 1.5 ◦ C and 2.0 ◦ C C., Kumar, A., Murakami, H., Ose, T., Reed, K., Saravanan, global warming scenarios as simulated by the HAPPI multi- R., Yamada, Y., Zarzycki, C., Vidale, P.-L., Jonas, J., and Hen- model ensemble, Earth Syst. Dynam., submitted, 2017b. derson, N.: Hurricanes and climate: the U.S. CLIVAR work- Zarzycki, C. M., Thatcher, D. R., and Jablonowski, ing group on hurricanes, B. Am. Meteorol. Soc., 96, 997–1017, C.: Objective tropical cyclone extratropical transi- https://doi.org/10.1175/BAMS-D-13-00242.1, 2015. tion detection in high-resolution reanalysis and climate Wehner, M. F., Reed, K., Li, F., Prabhat, Bacmeister, J., Chen, model data, J. Adv. Model. Earth Syst., 9, 130–148, C.-T., Paciorek, C., Gleckler, P., Sperber, K., Collins, W. D., https://doi.org/10.1002/2016MS000775, 2017. Gettelman, A., and Jablonowski, C.: The effect of horizon- tal resolution on simulation quality in the Community Atmo- spheric Model, CAM5.1, J. Model. Earth Syst., 06, 980–997, https://doi.org/10.1002/2013MS000276, 2014. Wehner, M. F., Prabhat, Reed, K., Stone, D., Collins, W. D., and Bacmeister, J.: Resolution dependence of future tropical cyclone projections of CAM5.1 in the US CLIVAR Hurricane Work- ing Group idealized configurations, J. Climate, 28, 3905–3925, https://doi.org/10.1175/JCLI-D-14-00311.1, 2015. www.earth-syst-dynam.net/9/187/2018/ Earth Syst. Dynam., 9, 187–195, 2018
You can also read