Multi-year methane ebullition measurements from water and bare peat surfaces of a patterned boreal bog - Biogeosciences
←
→
Page content transcription
If your browser does not render page correctly, please read the page content below
Biogeosciences, 16, 2409–2421, 2019
https://doi.org/10.5194/bg-16-2409-2019
© Author(s) 2019. This work is distributed under
the Creative Commons Attribution 4.0 License.

Multi-year methane ebullition measurements from water and bare
peat surfaces of a patterned boreal bog
Elisa Männistö1 , Aino Korrensalo1 , Pavel Alekseychik2 , Ivan Mammarella2 , Olli Peltola2 , Timo Vesala2,3 , and
Eeva-Stiina Tuittila1
1 Peatland  and Soil Ecology Research Group, School of Forest Sciences, University of Eastern Finland,
P.O. Box 111, 80101 Joensuu, Finland
2 Institute for Atmospheric and Earth System Research/Physics, Faculty of Science, University of Helsinki,

P.O. Box 68, 00014 Helsinki, Finland
3 Institute for Atmospheric and Earth System Research/Forest Sciences, Faculty of Agriculture and Forestry,

University of Helsinki, P.O. Box 27, 00014 Helsinki, Finland

Correspondence: Elisa Männistö (elisa.mannisto@uef.fi)

Received: 31 December 2018 – Discussion started: 14 January 2019
Revised: 10 May 2019 – Accepted: 28 May 2019 – Published: 14 June 2019

Abstract. We measured methane ebullition from a patterned        wet non-vegetated surfaces of the bog to the total ecosystem-
boreal bog situated in the Siikaneva wetland complex in          scale methane emission appeared to be small.
southern Finland. Measurements were conducted on water
(W) and bare peat surfaces (BP) in three growing seasons
(2014–2016) using floating gas traps. The volume of the
trapped gas was measured weekly, and methane and carbon          1   Introduction
dioxide (CO2 ) concentrations of bubbles were analysed from
fresh bubble samples that were collected separately. We ap-      Historically, bogs were commonly feared, as people saw
plied a mixed-effect model to quantify the effect of the envi-   mysterious lights that gave rise to the tales of the “will o’ the
ronmental controlling factors on the ebullition.                 wisps” that lure travellers from their paths to sink into bog
   Ebullition was higher from W than from BP, and more           holes (Meredith, 2002). Nowadays, these lights are thought
bubbles were released from open water (OW) than from             to be the spontaneous combustion of peatland gases, such as
the water’s edge (EW). On average, ebullition rate was the       methane, bubbling into the atmosphere, rather than deceptive
highest in the wettest year (2016) and ranged between 0          fairies. However, the widespread folklore indicates that the
and 253 mg m−2 d−1 with a median of 2 mg m−2 d−1 , 0 and         phenomenon is well known around the world in peatland-rich
147 mg m−2 d−1 with a median of 3 mg m−2 d−1 , and 0 and         areas. Although currently peatlands are more known for their
186 mg m−2 d−1 with a median of 28 mg m−2 d−1 in 2014,           climate-cooling impact as small carbon sinks and the storage
2015, and 2016, respectively. Ebullition increased together      of a third of the global soil carbon stock (Strack, 2008), they
with increasing peat temperature, weekly air temperature         are also a major natural source of methane, a potent climate
sum and atmospheric pressure, and decreasing water table         warming greenhouse gas (IPCC, 2014). The same high wa-
(WT). Methane concentration in the bubbles released from         ter table (WT) conditions that support accumulation of or-
W was 15–20 times higher than the CO2 concentration, and         ganic material as peat by slowing down aerobic decomposi-
from BP it was 10 times higher. The proportion of ebullition     tion also favour methane production by anaerobic microbes,
fluxes upscaled to ecosystem level for the peak season was       methanogens (Archaea) (Hanson and Hanson, 1996). It has
2 %–8 % and 2 %–5 % of the total flux measured with eddy         been predicted that carbon dioxide (CO2 ) uptake typically
covariance technique and with chambers and gas traps, re-        offsets sustained methane emissions in natural ecosystems in
spectively. Thus, the contribution of methane ebullition from    the long term (i.e. several centuries), albeit with large spa-
                                                                 tiotemporal variability (Petrescu et al., 2015).

Published by Copernicus Publications on behalf of the European Geosciences Union.
2410                                                               E. Männistö et al.: Methane ebullition from a boreal bog

    Methane is emitted from peatlands into the atmosphere          proportion of ebullition in the total emission varies from 3 %
via three routes: by diffusion from peat, transport through        (Green and Baird, 2013) to 50 % (Christensen et al., 2003).
aerenchymatous vascular plants and by episodic bubble re-              Similar to chamber and EC measurements (Rinne et al.,
lease, i.e. ebullition (LeMer and Roger, 2001; Raghoebars-         2007, 2018; Jackowicz-Krczyński et al., 2010; Turetsky et
ing et al., 2005). A large part of the produced methane is ox-     al., 2014; Mikhaylov et al., 2015), direct ebullition studies
idised by methanotrophic bacteria in the aerobic peat layer        have connected the rate of methane emission to peat temper-
above water level (Hanson and Hanson, 1996; LeMer and              ature (Strack et al., 2005) related to increasing microbial ac-
Roger, 2001; Larmola et al., 2010), and thus methane flux          tivity (Conrad et al., 1997). It is noteworthy that the incoming
rate of a peatland depends on the rates of methane produc-         energy flux has been shown to primarily control the methane
tion and consumption, in addition to transportation within the     production and ebullition in shallow subarctic lakes (Wik et
peat to the atmosphere. It is known that part of methane can       al., 2014) that could be contrasted to peatland pools. Ebul-
also be oxidised in plants, such as rice (Bosse and Frenzel,       lition in peatlands has additionally been linked to decreas-
1997), but so far significant methane oxidation has not been       ing WT and falling atmospheric pressure: the decrease in hy-
detected in bog plants, such as Eriophorum spp. (Frenzel and       drostatic pressure increases the volume of the gas phase of
Rudolph, 1998). As methane emitted through vascular plants         methane in peat and releases it into the atmosphere (Tokida et
or by ebullition bypasses the oxidation in the aerobic peat        al., 2007). Also, an increase in atmospheric pressure can trig-
layer, these pathways can potentially release high amounts         ger ebullition by decreasing the bubble size, due to compres-
of methane into the atmosphere. Diffusion through peat and         sion, and thus increasing the bubble mobility in shallow peat
vascular plants have been regarded as being the dominant           (Comas et al., 2011; Chen and Slater, 2015). Furthermore,
pathways of methane emissions and those emission pathways          peat structure has been shown to affect bubble sizes and de-
have been largely targeted with chamber measurements (e.g.         termine whether ebullition is steady or erratic (Ramirez et
Bubier et al., 2005; Ström et al., 2005; Turetsky et al., 2014).   al., 2016). However, the importance of these factors for ebul-
Alternatively, the eddy covariance (EC) technique is used to       lition is still based on only a few studies, of which the longest
estimate the integrated ecosystem-scale methane flux (e.g.         covers two growing seasons (Strack and Waddington, 2008).
Brown et al., 2014; Rinne et al., 2018) but is unable to differ-       In this study, we measured methane ebullition from open
entiate the emission pathways.                                     water pools (W) and bare peat surfaces (BP) with gas traps in
    Current models of the global methane budget are still un-      three consecutive growing seasons (2014–2016) in a boreal
certain due to limited knowledge of the relative contribu-         bog where methane fluxes were also measured with EC and
tion of different factors controlling methane fluxes (Riley        static chamber techniques. We aimed to (1) quantify the spa-
et al., 2011). The largest source of uncertainty is the quan-      tial and temporal variation in methane ebullition from wet
tity of methane emissions from natural wetlands, such as           bog surfaces, (2) study the controlling factors and (3) as-
peatlands (Riley et al., 2011; Melton et al., 2013). Within        sess the contribution of ebullition from wet surfaces to the
peatland emissions, the largest uncertainty is related to the      ecosystem-level emission.
magnitude of ebullition (Peltola et al., 2018). We are aware
of only few studies that have directly measured ebullition
from boreal peatlands with gas traps. In the first one, Hamil-     2   Materials and methods
ton et al. (1994) carried out measurements over 24 h and
found no bubbles. In three other studies conducted in a fen        The study was conducted in the ombrotrophic bog that is part
(Strack et al., 2005; Strack and Waddington, 2008) or a            of Siikaneva peatland complex situated in southern Finland
bog (Stamp et al., 2013) ebullition fluxes between 7 and           (61◦ 500 N, 24◦ 120 E, 160 m a.s.l.), within the southern boreal
96 mg CH4 m−2 d−1 were detected, but the importance of             vegetation zone (Ahti et al., 1968). Annual rainfall in the
ebullition for the ecosystem flux remained unrevealed. Ebul-       area is 707 mm, the snow depth in March (with the thick-
lition has also been measured in the field by separating peak      est snow cover) is 36 cm, the annual cumulative temperature
methane releases from steady chamber flux (Riutta et al.,          is 1318, the length of growing season is 168 d, the average
2007; Tokida et al., 2007; Goodrich et al., 2011) with emis-       annual temperature is 4.2 ◦ C, and the average temperatures
sions varying from 49–152 mg CH4 m−2 d−1 (Goodrich et              in January and July are −7.2 and 17.1 ◦ C, respectively (30-
al., 2011) to 48–1440 mg CH4 m−2 d−1 (Tokida et al., 2007).        year averages from the nearby Juupajoki–Hyytiälä weather
These studies show contrasting results in relation to the con-     station, except snow depth, which uses a 20-year average).
tribution of ebullition to the total emission. While Riutta et     The microtopography of the studied bog site varies from W
al. (2007) estimated the role of ebullition to be small in the     and BP to hollows, lawns and hummocks. W and BP together
two study years, Tokida et al. (2007) (with two sample plots)      cover approximately one-fourth of the site (W 11.6 % and BP
found that the proportion of ebullition may constitute up to       15.3 % within a 30 m radius from the EC tower of the site).
50 % of the total flux. Results on mesocosm studies in labo-       The bottom layer is formed by Sphagnum mosses, except in
ratory conditions are similarly disparate as they show that the    W and BP that are devoid of moss. Sedges are the dominant
                                                                   vascular plants in hollows and lawns, whereas vascular plant

Biogeosciences, 16, 2409–2421, 2019                                                     www.biogeosciences.net/16/2409/2019/
E. Männistö et al.: Methane ebullition from a boreal bog                                                                         2411

vegetation on hummocks is dominated by dwarf shrubs. In
BP, Rhynchospora alba is often the only plant species (Kor-
rensalo et al., 2018a).
   In order to measure methane ebullition from the studied
bog, floating gas traps were placed in W and BP in three
consecutive years (2014–2016). Only W and BP microforms
were chosen because we expected high ebullition from these
waterlogged surfaces that have almost no vegetation, and the
sampling method required gas traps to be easily filled with
water. BP are patches of visible peat that have WT at or near
the surface. For example, in 2014, WT in BP was on average
−1.8 cm. W are without a clear bottom but have on average
1 m of water over very loose peat slurry and their water area
starts directly from the edge of the surrounding moss cover.
As it is difficult to determine what is the bottom of the pools,
we did not measure the water depth or temperature in the
bottom of the W.                                                   Figure 1. Floating gas traps in an open water peatland pool (OW).
   The gas traps were constructed from inverted plastic
funnels with diameters ranging between 14.3 and 24.5 cm
(Fig. 1). A syringe with a three-way stopcock was attached
to the narrow end of each funnel, and the joint was covered
with sealant to make it airtight. A piece of metallic netting
coated with filter fabric was glued inside the funnels to pre-
vent litter and small animals from entering the gas traps in
the open water pools. The gas traps on W were attached to
a floating styrofoam raft and placed in the pools in lines of
two or three gas traps, anchored to the opposing shores of the
pool with string (Fig. 1). To study the potential difference in
availability of substrate for methanogenesis, some gas traps
were anchored further away from the surrounding moss cover
at the centre of the pools (open water, OW), while the other
gas traps were anchored at the water’s edge (EW) right next
to the moss (Fig. 2). The gas traps on BP were placed next to
boardwalks at the study site (Fig. 2). The air was sucked out
of the gas traps with an extra syringe until they were filled      Figure 2. Aerial photo of the study site in Siikaneva bog. Red lines
                                                                   with dots mark the floating gas traps in open water (OW) and at the
with water. The rate of ebullition was measured weekly by
                                                                   water’s edge (EW). Red circles mark the area where the gas traps
sampling the gas volume that had replaced water in each gas        were placed on bare peat surfaces (BP), which are seen as brownish-
trap.                                                              grey in the photo. The eddy covariance (EC) raft is marked with the
   A total of 16 gas traps were used (11 in W and 5 in BP)         red ×.
from 3 June to 25 September in 2014, 20 gas traps (13 in
W and 7 in BP) were used from 13 May to 24 September in
2015 and 18 gas traps (12 in W and 6 in BP) were used from         gered manually from the sampled surfaces and the formed
27 May to 9 September in 2016.                                     bubbles were caught in an extra gas trap, from where 20 mL
   Methane concentrations of the gas caught in the gas traps       samples were taken into vacuumed glass vials. The samples
during the weekly sampling periods were measured in 2014           were analysed with an Agilent Technologies HP 8690 gas
and compared with methane concentration of fresh ebulli-           chromatograph at the Natural Resources Institute Finland
tion samples. We found methane concentrations in the gas           (LUKE), Vantaa. Fresh ebullition samples were collected 4
traps to be clearly lower than in the fresh ebullition sam-        times during the measurement season in 2014 and 2016 and
ples (Table A1 in the Appendix), and thus methane concen-          13 times in 2015. Average methane concentration was inter-
tration of the gas caught in the traps was assumed to dilute       polated linearly from the fresh ebullition samples for each
during the weekly sampling periods due to diffusion. There-        weekly measurement day.
fore, methane concentration of the releasing bubbles was not          Average methane emission by ebullition as mL m−2 d−1
measured from the weekly samples but instead by collecting         was calculated based on the area of the gas trap, num-
fresh ebullition samples from W without disturbing the gas         ber of days and volume of gas collected in each measure-
traps and from BP that had no gas traps. Ebullition was trig-      ment period and the average methane concentration of each

www.biogeosciences.net/16/2409/2019/                                                        Biogeosciences, 16, 2409–2421, 2019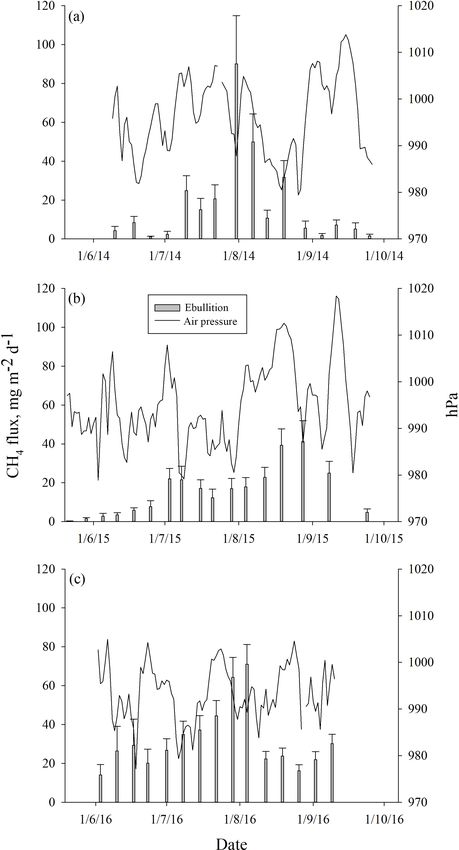
2412                                                              E. Männistö et al.: Methane ebullition from a boreal bog

measurement period. In order to convert the emissions to          Table 1. Effective temperature sum of the growing season, an-
mg m−2 d−1 , methane density in each measurement period           nual rainfall and the cumulative photosynthetically active radiation
was calculated based on the average air temperature of the        (PAR) in the three studied years (2014–2016), compared to the 30-
measurement period in degrees Celsius and the standard at-        year averages of the area. Data for the Hyytiälä weather station are
mospheric air pressure, 101 325 Pa. Average methane emis-         from Finnish Meteorological Institute open data.
sion (mg m−2 d−1 ) was calculated separately for ebullition
from OW, EW and BP.                                                  Year             Temp. sum      Annual rainfall         PAR
                                                                                             ◦C                 mm      µmol m−2
   In order to compare the ebullition fluxes to EC and cham-
ber measurements (Korrensalo et al., 2018b), the ebullition          2014                   1349                579        70 800
flux was upscaled to ecosystem level by linearly interpolat-         2015                   1166                658        69 180
ing the total average ebullition that was calculated as a sum        2016                   1280                660        67 996
of average ebullition fluxes from W and BP weighted with             30-year mean           1318                707             –
their relative surface areas.
   Air pressure and temperature data from 2014 to 2016 were
received from the Juupajoki–Hyytiälä weather station that is
situated about 6 km from the study site in Siikaneva. The             Higher ebullition was observed on W than on BP (Fig. 3)
data on WT, water temperature and peat temperatures at the        (DF = 1, 746; p < 0.0001). Ebullition from OW was signif-
depths of 5, 20 and 50 cm were received from data loggers         icantly higher than ebullition from EW, except in the middle
installed in a lawn about 1.5 m away from the EC raft. Pho-       of the growing season 2015 (Fig. 3). Although BP showed
tosynthetically active radiation (PAR) data was measured at       lower ebullition with fewer peaks than W, all the surfaces
the site.                                                         had the same seasonal ebullition pattern each year, with high-
   Linear mixed-effect models were used to analyse the effect     est fluxes observed in August (Fig. 3). However, in 2015 the
of measured environmental variables (peat temperature in          highest ebullition was measured later than in other years after
different depths, WT, atmospheric pressure and cumulative         relatively low ebullition in late summer (Fig. 3).
PAR, and effective temperature sum of a measurement period            Ebullition increased with increasing average peat temper-
as variables of incoming energy flux) on log-transformed          ature at the depth of 5 cm (DF = 1, 746; p < 0.0001) that ex-
ebullition flux rates. The gas trap was included as a ran-        plained ebullition better than the other peat temperature vari-
dom effect in the model. We also tested which of the four         ables measured. The seasonal pattern of ebullition followed
peat temperature variables explained the variation in ebulli-     the temperature in each year (Fig. 4). Higher ebullition rates
tion fluxes the best. The data were analysed with the function    were also explained with decreasing average WT (DF = 1,
lme of the package nlme of the R software (version 3.3.2).        746; p = 0.0001). The highest ebullition peaks were associ-
                                                                  ated with the lowest WT in each year (Fig. 4). A prolonged
                                                                  depression of WT further explained the late peak of ebullition
3   Results                                                       in 2015, as well as the increase in ebullition in the autumn
                                                                  2016 (Fig. 4). Change in atmospheric pressure during the
Among the three studied years, the year 2014 was the
                                                                  measurement period further explained ebullition: more bub-
warmest, driest and had the highest amount of cumulative
                                                                  bles were released with a higher increase in pressure (DF = 1,
photosynthetically active radiation (PAR) (Finnish Meteoro-
                                                                  746; p = 0.001). Some events of ebullition might be directly
logical Institute open data) (Table 1). It was also warmer than
                                                                  related to decreasing atmospheric pressure, such as the small
the 30-year average. The year 2015 was the coolest, with a
                                                                  peak in ebullition in mid-August 2014 that appears to be bet-
lowered annual rainfall and PAR, while 2016 was the wettest
                                                                  ter explained by the long decrease in atmospheric pressure
and the cloudiest year (Table 1). All 3 years were signifi-
                                                                  than by peat temperature or WT (Fig. 5). After including
cantly drier than the average (Table 1).
                                                                  peat temperature, WT and change in atmospheric pressure,
   Measured methane ebullition ranges were 0–253, 0–
                                                                  the effective temperature sum of a measurement period still
147 and 0–186 mg m−2 d−1 with medians 2, 3 and
                                                                  had a positive effect on ebullition (DF = 1, 746; p = 0.0351.
28 mg m−2 d−1 in 2014, 2015 and 2016, respectively
                                                                  Finally, the cumulative PAR had no significant effect on ebul-
(Fig. A1 in the Appendix). Weekly medians of individual gas
                                                                  lition and was excluded from the final model.
traps were 0–57 mg m−2 d−1 in 2014, 0–33 mg m−2 d−1 in
                                                                      Fresh ebullition sample analyses showed that the released
2015 and 10–67 mg m−2 d−1 in 2016. The 3 years differed
                                                                  gas bubbles contained more methane than CO2 . Methane
(degrees of freedom, DF = 2, 746; p < 0.0001) as slightly
                                                                  concentration of bubbles released from W was 15–20 times
higher ebullition fluxes were generally obtained in 2015 than
                                                                  higher than their CO2 concentration, while bubbles from BP
2014, while, on average, the ebullition fluxes were at their
                                                                  had a methane concentration tenfold higher than their CO2
highest in the wettest year (2016).
                                                                  concentration (Table 2).
                                                                      The average ebullition flux upscaled to ecosystem level
                                                                  was an order of a magnitude lower than the net methane flux

Biogeosciences, 16, 2409–2421, 2019                                                     www.biogeosciences.net/16/2409/2019/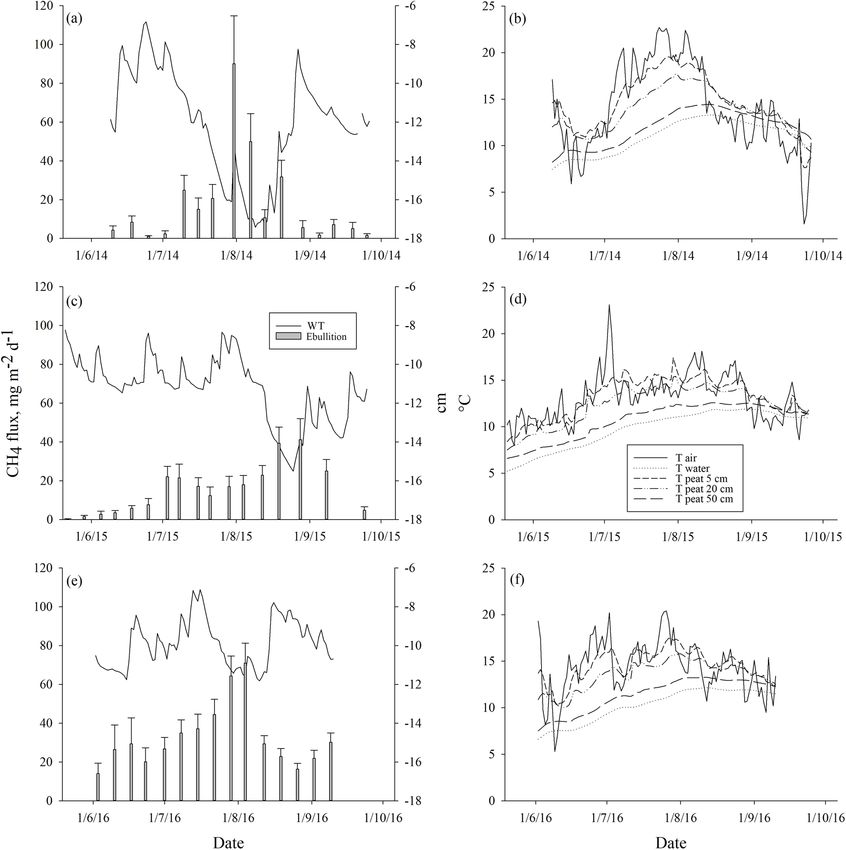
E. Männistö et al.: Methane ebullition from a boreal bog                                                                          2413

Table 2. Average methane (CH4 ) and carbon dioxide (CO2 ) concentrations (mL L−1 ), with the standard deviation (SD) of gas-releasing
bubbles from pools (W) and bare peat surfaces (BP) in the three studied years (2014–2016).

                                                   2014                  2015                  2016
                                              Average      SD     Average        SD    Average          SD
                                    W CH4       380.0     50.7         285.0    93.0      423.0       103.9
                                    W CO2        23.8      4.9          18.0     8.8       20.8         6.5
                                    BP CH4      274.2     64.5         273.6    56.1      364.2       123.7
                                    BP CO2       29.4     16.0          26.9     9.4       31.8         8.9

Table 3. Monthly cumulative methane fluxes (mg m−2 month−1 ), measured as ebullition and with the eddy covariance (EC) technique for
June–August in the three studied years (2014–2016).

                                     2014                                2015                                 2016
                       Ebullition     EC          % of    Ebullition       EC          % of     Ebullition     EC         % of
                                             ebullition                           ebullition                         ebullition
              June            27     1668            2            73     1139             6             117   2530           5
              July           155     3423            5           112     2277             5             314   4216           7
              August         176     3447            5           223     2657             8             249   3448           7

measured by EC in each year (Fig. 6). The sum of ebullition              fen lawn samples in Waddington et al., 2009). So far, only
and upscaled chamber flux in 2014 was higher than the one                Tokida et al. (2007) have estimated ebullition fluxes reach-
measured with EC, but the two estimates followed the same                ing 1440 mg m−2 d−1 in the field based on methane fluxes
seasonal trend (Fig. 6). The contribution of ebullition to the           measured with the static chamber method from two sample
total methane flux measured with chambers and bubble traps               plots showing high episodic fluxes during 30 min measure-
during the peak season in 2014 was 2 %, 3 % and 5 % in June,             ments. Generally, there is a difference in temporal resolution
July and August, respectively (Table 3). The contribution of             between the two methods as chamber measurements usually
ebullition to EC flux during the peak season varied from 2 %             cover only short time periods (from minutes to hours), while
in June 2014 to 8 % in August 2015 (Table 3).                            gas traps show estimates of cumulative bubble flux over sev-
                                                                         eral days.
                                                                            The fact that the ebullition rates measured with gas traps
4     Discussion                                                         are lower than in laboratory studies might be partly explained
                                                                         by the process of bubbles stacking in the gas traps instead
4.1    The magnitude of ebullition                                       of automatically gathering in the headspace. In this study,
                                                                         we tried to overcome this potential error source by gen-
The methane ebullition measured in this study ranged from 0              tly shaking and tapping the gas traps before sampling, si-
to 253 mg m−2 d−1 and the seasonal weekly median of ebul-                multaneously trying to avoid causing more ebullition from
lition for different surfaces ranged from 0 (measured from               this disturbance. However, methane ebullition fluxes of up to
BP in 2014) to 37 mg m−2 d−1 (measured from OW in 2016).                 1683 mg m−2 d−1 have been previously measured with the
Our results are of the same magnitude as ebullition fluxes               same method from subarctic lakes (Wik et al., 2013), which
previously measured in boreal peatlands with gas traps, rang-            shows the potential of this method to also measure higher
ing from 7 to 96 mg m−2 d−1 (Strack et al., 2005; Strack and             ebullition fluxes.
Waddington, 2008; Stamp et al., 2013), and with automatic
chambers, ranging from 9 to 152 mg m−2 d−1 (Goodrich                     4.2    Temporal and spatial variation
et al., 2011). In addition to field measurements, some of
the laboratory-based experiments have shown similar ebul-                Our study conducted over three growing seasons showed
lition flux rates in the range of 0–270 mg m−2 d−1 (Chris-               inter-annual variation. The highest ebullition on average was
tensen et al., 2003; Kellner et al., 2006; Yu et al., 2014) but          measured in 2016, whereas the average flux rates of 2014
also higher fluxes up to 784 mg m−2 d−1 (Green and Baird,                and 2015 did not differ significantly from each other. More
2012). Some laboratory studies have even shown potential                 ebullition was measured from BP in 2016 especially, which
for much higher ebullition rates up to 33 000 mg m−2 d−1                 was the wettest year with the highest WT. This indicates
(Sphagnum surface samples from bog in Tokida et al., 2005;               that despite higher WT increasing hydrostatic pressure in

www.biogeosciences.net/16/2409/2019/                                                               Biogeosciences, 16, 2409–2421, 2019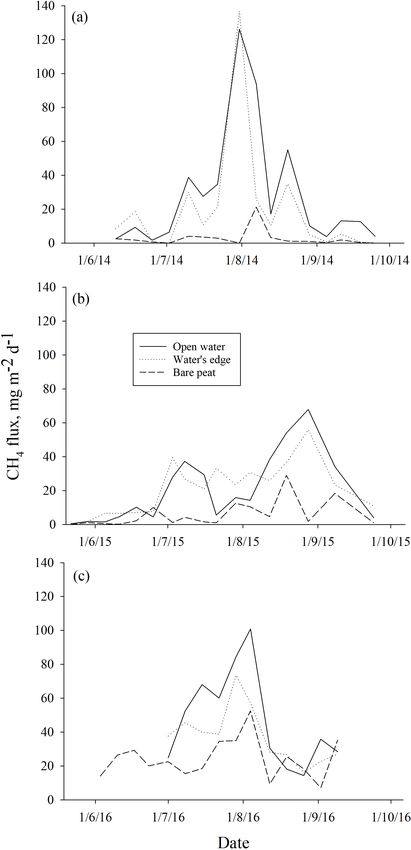
2414                                                                   E. Männistö et al.: Methane ebullition from a boreal bog

                                                                       2008) also found the ebullition level to differ between the
                                                                       study years. Similarly, Wik et al. (2013) found differences in
                                                                       bubble methane concentrations and fluxes in subarctic lakes
                                                                       among the four summers studied. These results point out the
                                                                       need for multi-year studies in order to include inter-annual
                                                                       variation in ebullition fluxes in methane models. Further-
                                                                       more, the higher ebullition rate from W than from BP in our
                                                                       study indicates that balanced sampling in a bog should cover
                                                                       microform variability, although in some studies no spatial
                                                                       variation in ebullition were found (Green and Baird, 2012,
                                                                       2013; Stamp et al., 2013). However, drier and wetter condi-
                                                                       tions can change the proportions of water and bare peat sur-
                                                                       faces, and, according to our results, such changes may have
                                                                       an impact on ebullition.

                                                                       4.3   Controlling factors and their importance

                                                                       The measured ebullition rates increased together with peat
                                                                       temperature as also shown earlier (Strack and Waddington,
                                                                       2008). Increasing temperature generally increases the ac-
                                                                       tivity of methanogens, and thus more methane is produced
                                                                       in the peat when it gets warmer, until the temperature op-
                                                                       timum of the microbes around 20–30 ◦ C is reached (Dun-
                                                                       field et al., 1993). Peat temperature affects also the solubil-
                                                                       ity of methane, according to Henry’s law, as gas solubility
                                                                       decreases with increasing temperature (Strack et al., 2005).
                                                                       Thus, increasing peat temperature may lead to transfer of
                                                                       methane from aqueous to gaseous phase, which increases
                                                                       bubble formation (Strack et al., 2005). In our study, the peat
                                                                       temperature at the depth of 5 cm showed the highest correla-
                                                                       tion with ebullition but temperature at all depths was highly
                                                                       intercorrelated. The effect of peat temperature was reflected
                                                                       in the seasonal pattern of ebullition.
                                                                           As expected, ebullition fluxes increased when WT de-
                                                                       creased, as found in previous studies (Strack and Wadding-
                                                                       ton, 2008). Bubbles may accumulate in peat under barriers,
                                                                       such as pieces of wood, and they are suppressed by high
                                                                       hydrostatic or air pressure (Rosenberry et al., 2003; Strack
                                                                       and Waddington, 2008; Chen and Slater, 2015). Decreasing
                                                                       WT lowers the hydrostatic pressure, releasing newly formed
                                                                       and the accumulated bubbles. Many studies have also shown
                                                                       that the falling atmospheric pressure can trigger high rates of
Figure 3. Mean methane ebullition measured weekly in Siikaneva         ebullition (Tokida et al., 2005, 2007). Although some weeks
bog over three consecutive years (a) 2014, (b) 2015 and (c) 2016       showed higher ebullition rates when atmospheric pressure
over different surfaces: bare peat, open water and the water’s edge.
                                                                       was falling, this pattern was not consistent as increasing ebul-
                                                                       lition rates were also measured during periods of rising at-
                                                                       mospheric pressure. After including WT as explanatory vari-
peat, wetter conditions in BP facilitate gas release as bub-           able, we still found the weekly change in atmospheric pres-
bles. Although 2015 was almost as wet a year as 2016, it               sure to significantly affect ebullition, as bigger increase in
was much cooler, which decreases methane production. The               weekly pressure was related to more ebullition. Previously,
warmest year (2014) again was much drier than 2016, and                Comas et al. (2011) used ground penetrating radar (GPR) to
although there was high ebullition with sharp drop in WT               study the vertical distribution of free-phase gas in a north-
during the peak season, the general ebullition level from BP           ern peatland and found that increasing atmospheric pressure
was low. The only other peatland study with gas traps cover-           caused rapid ebullition by releasing gas from shallow peat,
ing more than one growing season (Strack and Waddington,               whereas decreasing pressure released gas from deeper peat

Biogeosciences, 16, 2409–2421, 2019                                                         www.biogeosciences.net/16/2409/2019/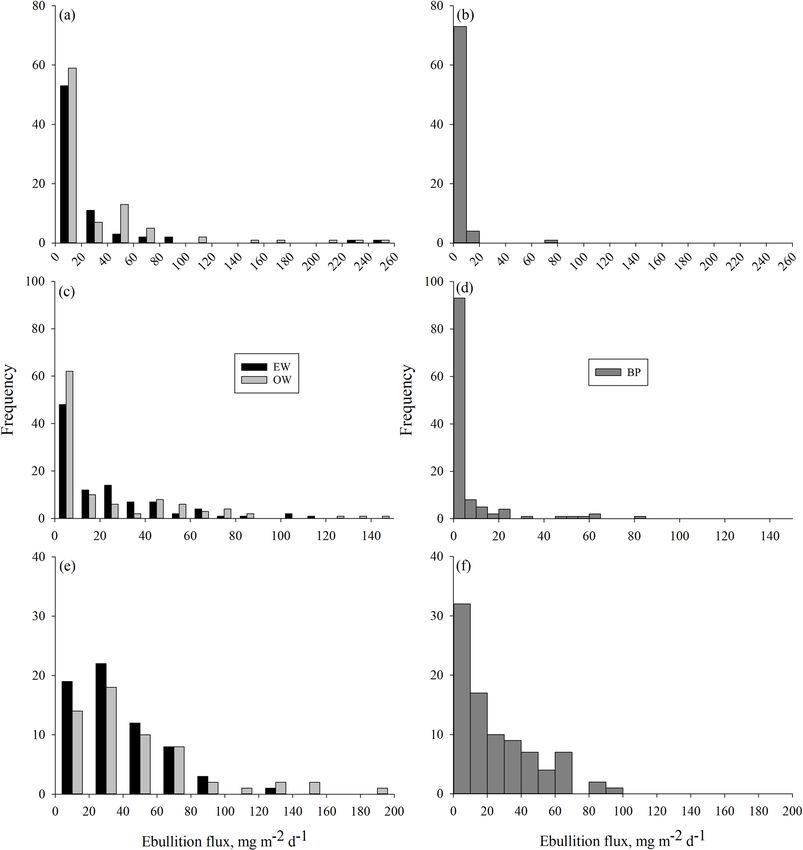
E. Männistö et al.: Methane ebullition from a boreal bog                                                                                2415

Figure 4. Mean weekly methane ebullition with standard error of the means from all surfaces compared to water table (WT) (a, c, e), and
air, water, and peat temperatures at the depths of 5, 25 and 50 cm (b, d, f) measured in Siikaneva bog in the years (a–b) 2014, (c–d) 2015 and
(e–f) 2016.

to shallow layers. Also, Chen and Slater (2015) showed that              not find clear correlation between the two in the three study
increasing pressure can trigger ebullition as it increases the           years. However, the positive effect of the measurement pe-
bubble mobility in peat.                                                 riod temperature sum on ebullition shows that increasing en-
   Furthermore, higher ebullition rates were measured with               ergy input can increase ebullitive methane flux rates at the
a higher effective temperature sum of the measurement pe-                studied bog site.
riod. This indicates the importance of energy input as a
driver of methane production and release as shown by Wik et              4.4    Importance for the ecosystem-level flux
al. (2014). They found strong positive correlations between
seasonal bubble methane flux from subarctic lakes and four               When measured ebullition fluxes were upscaled to the
proxies of energy flux, such as average short-wave radiation             ecosystem level, they showed much lower methane emis-
and maximum water sediment temperature (Wik et al., 2014).               sions than measured with chamber and EC techniques. In
We tried also to compare cumulative PAR (i.e. short-wave                 our previous study (Korrensalo et al., 2018b), we measured
radiation) to seasonal cumulative ebullition fluxes but could            diffusive methane fluxes with the static chamber technique
                                                                         from six different plant community types, including BP, at

www.biogeosciences.net/16/2409/2019/                                                              Biogeosciences, 16, 2409–2421, 2019
2416 E. Männistö et al.: Methane ebullition from a boreal bog
Figure 5. Mean weekly methane ebullition from all surfaces
compared to atmospheric pressure measured in Siikaneva bog in
(a) 2014, (b) 2015 and (c) 2016.
Figure 6. Ecosystem-level methane fluxes measured with the eddy
the same bog site in 2014. We found higher methane fluxes covariance (EC) technique and upscaled from ebullition measure-
from BP than from high hummocks (HHU), but otherwise ments in (a) 2014, (b) 2015 and (c) 2016. In 2014, ecosystem-level
all the studied plant community types had similar methane methane fluxes are also compared to upscaled chamber fluxes.
fluxes. When chamber fluxes were upscaled to ecosystem
level, they were similar to the EC flux (Korrensalo et al.,
2018b). Although laboratory incubation studies have shown et al. (2007) measured methane fluxes from different plant
that the contribution of ebullition to the total methane flux communities with static chambers at the Siikaneva fen site,
may reach up to 50 % (Christensen et al., 2013; Tokida et al., situated 1.3 km south-east of our studied bog site, and cal-
2007), the ebullition contribution in this study was only 3 %– culated results for both diffusive and ebullition fluxes. They
5 % during the peak season of 2014. Here, ebullition is only found ebullition from all communities but showed that its
considered from waterlogged surfaces, as we did not mea- contribution to the total flux (diffusive flux plus ebullition)
sure ebullition from vegetated surfaces. Previously, Riutta was negligible or very small (Riutta et al., 2007). We esti-
Biogeosciences, 16, 2409–2421, 2019 www.biogeosciences.net/16/2409/2019/E. Männistö et al.: Methane ebullition from a boreal bog 2417 mated ebullition to occur only twice in 210 measurements Data availability. The data used in this study are available upon on moss-covered surfaces, i.e. in 0.8 % of our 2014 cham- request from the corresponding author. ber data. Therefore, we assume that ebullition from vege- tated surfaces would not greatly contribute to the total flux at the bog site either. Earlier, similar to our study, Green and Baird (2013) found ebullition to contribute less than 3.3 % of total methane fluxes when incubating peat samples collected from hollows and lawns from two raised bogs in laboratory study. As the measured bubble methane fluxes in our study were of the same magnitude in each year, ebullition did not contribute significantly to the ecosystem methane emissions in any studied growing season, as seen in the comparison with the EC flux. While the same seasonal trend and peaks can be seen in both fluxes in each year, the total flux mea- sured with EC is constantly at least an order of magnitude higher than the ebullition flux rate. 5 Conclusions More methane ebullition was found from W than from BP, and within the pools more bubbles were released from OW than from EW. We also found variation between the three studied growing seasons, as ebullition rate was generally higher in the wettest year (2016). Due to this spatial and tem- poral variation, differences between years in wet or dry con- ditions may have an effect on ebullition. As expected, ebul- lition increased together with increasing peat temperature, which facilitates methane production, and with decreasing WT, which reduces hydrostatic pressure on peat. Addition- ally, more bubbles were released with a bigger weekly in- crease in atmospheric pressure, which is related to rapid ebul- lition from shallow peat. Furthermore, a higher weekly tem- perature sum had a positive effect on ebullition, which shows that increasing energy input can increase ebullitive methane flux rates at the studied bog site. Therefore, the growing sea- son lengthening and the increase in the average temperatures due to climate change may increase the methane emissions in the peatland ecosystem, as long as waterlogged anoxic con- ditions in the peat for methane production persist. Ebullition flux upscaled to the ecosystem level showed a similar sea- sonal pattern to methane fluxes measured with EC and cham- ber techniques but was an order of magnitude lower and had a very small contribution to the total ecosystem flux. Our study only includes ebullition from the waterlogged surfaces, as we did not expect ebullition from all the plant community types to be substantial based on the previous study at the nearby fen site and our chamber measurements in 2014. However, estimating the amount of ebullition from all the plant com- munity types would be needed to fully understand the spa- tial variation in ebullition in the future. In addition, measure- ments with, e.g. time-lapse cameras, are needed to study the short-term temporal variation in ebullition and to estimate the frequency and magnitude of rapid ebullition events that may contribute to the total ecosystem flux. www.biogeosciences.net/16/2409/2019/ Biogeosciences, 16, 2409–2421, 2019
2418                                                                               E. Männistö et al.: Methane ebullition from a boreal bog

Appendix A

Table A1. Mean methane concentrations of the gas caught in the gas traps and of fresh ebullition samples in 2014. Concentration samples
were collected four times from gas traps on water (W) and bare peat (BP) surfaces and by triggering fresh ebullition from similar surfaces.

                                        Date                   Mean CH4 concentration mL L−1
                                                      W gas trap        BP gas trap         W fresh       BP fresh
                                        10 Jun                   17                45            293             268
                                        16 Jul                   61               245            420             313
                                        13 Aug                   86               152            399             172
                                        5 Sep                    49                63            379             221
                                      Numbers in italics indicate the concentration in a single measured gas trap, as
                                      opposed to a mean of many gas traps.

Figure A1. Frequency distribution of methane ebullition (mg m−2 d−1 ) per gas trap from open water pools (OW), the water’s edge (EW)
and bare peat surfaces (BP) in (a–b) 2014, (c–d) 2015 and (e–f) 2016. Note the differences in scales between the years.

Biogeosciences, 16, 2409–2421, 2019                                                                            www.biogeosciences.net/16/2409/2019/
E. Männistö et al.: Methane ebullition from a boreal bog 2419
Author contributions. AK, EST, PA and TV came up with the idea Christensen, T. R., Panikov, N., Mastepanov, M., Joabsson, A.,
and design. AK and EM conducted the ebullition measurements Stewart, A., Öquist, M., Sommerkorn, M., Reynald, S., and
and processed the data. Eddy covariance data was collected and Svensson, B.: Biotic controls on CO2 and CH4 exchange in wet-
analysed by PA and IM. EM fitted the mixed-effect models. The lands – a closed environment study, Biogeochemistry, 64, 337–
manuscript was written by EM, AK and EST and commented on by 254, 2003.
all the other authors. Comas, X., Slater, L., and Reeve, A. S.: Atmospheric pressure
drives changes in the vertical distribution of biogenic free-phase
gas in a northern peaetland, J. Geophys. Res., 116, G04014,
Competing interests. The authors declare that they have no conflict https://doi.org/10.1029/2011JG001701, 2011.
of interest. Conrad, R., Schultz, H., and Babbel, M.: Temperature imitation of
hydrogen turnover and methanogesis in anoxic paddy soil, FEMS
Microbiol. Ecol., 45, 281–289, 1997.
Acknowledgements. We thank Hyytiälä Forest Research Station Dunfield, P., Knowles, R., Dumont, R., and Moore, T. R.: Methane
and its staff for research facilities and Pauli Karppinen from Natu- production and consumption in temperate and subarctic peat
ral Resources Institute Finland (LUKE) for analysing methane con- soils: Response to temperature and pH, Soil Biol. Biochem., 25,
centration of the fresh bubble samples. We also thank Salli Uljas, 321–326, 1993.
Janne Sormunen, Franziska Rossocha and Laura Kettunen for the Finnish Meteorological Institute open data: available at: https://en.
help in the field. ilmatieteenlaitos.fi/open-data, last access: 8 May 2019.
Frenzel, P. and Rudolph, J.: Methane emission from a wetland plant:
the role of CH4 oxidation in Eriophorum, Plant Soil, 202, 27–32,
1998.
Financial support. This research has been supported by the
Goodrich, J. P., Varner, R. K., Frolking, S., Duncan, S. B., and Crill,
Academy of Finland (grant no. 287039), the Finnish Cultural
P. M.: High-frequency measurements of methane ebullition over
Foundation (grant no. 00170743), the Academy research project
a growing season at a temperate peatland site, Geophys. Res.
CLIMOSS (grant no. 41007-00086900), the Strategic Research
Lett., 38, L07404, https://doi.org/10.1029/2011GL046915, 2011.
Council research project SOMPA (grant no. 41007-00114600),
Green, S. M. and Baird, A. J.: A Mesocosm study of the role of
the National Centre of Excellence (grant no. 272041), the ICOS-
the sedge Eriophorun angustifolium in the efflux of methane –
Finland (grant no. 281255), the Academy professor project funded
including that due to episodic ebullition – from peatlands, Plant
by the Academy of Finland, AtMath funded by the University
Soil, 351, 207–218, 2012.
of Helsinki (grant no. 284701), and the Postdoctoral Researcher
Green, S. M. and Baird, A. J.: The importance of episodic ebullition
project funded by the Academy of Finland (grant no. 315424).
methane losses from three peatland microhabitats: a controlled-
environment study, Eur. J. Soil. Sci., 64, 27–36, 2013.
Hamilton, J. D., Kelly, C. A., Rudd, J. W. M., Hesslein, R. H., and
Review statement. This paper was edited by Alexey V. Eliseev and Roulet, N. T.: Flux to the atmosphereof CH4 and CO2 from wet-
reviewed by two anonymous referees. land ponds on the Hudson Bay lowlands (HBLs), J. Geophys.
Res., 99, 1495–1519, 1994.
Hanson, R. S. and Hanson, T. E.: Methanotrophic Bacteria, Micro-
biol. Rev., 60, 439–471, 1996.
References IPCC: Climate Change 2014: Synthesis Report, Contribution of
Working Groups I, and III to the Fifth Assessment Report of
Ahti, T., Hämet-Ahti, L., and Jalas, J.: Vegetation zones and their the Intergovernmental Panel on Climate Change, edited by: Core
sections in northwestern Europe, Ann. Bot. Fenn., 5, 169–211, Writing Team, Pachauri, R. K. and Meyer, L. A., IPCC, Geneva,
1968. Switzerland, 151 pp., 2014.
Bosse, U. and Frenzel, P.: Activity and Distribution of Methane- Jackowicz-Korczyński, M., Christensen, T. R., Bäckstrand, K.,
Oxidizing Bacteria in Flooded Rice Soil Microcosms and in Rice Crill, P., Friborg, T., Mastepanov, M., and Ström, L.: Annual cy-
Plants (Oryza sativa), Appl. Environ. Microb., 63, 1199–1207, cle of methane emission from a subarctic peatland, J. Geophys.
1997. Res., 115, G02009, https://doi.org/10.1029/2008JG000913,
Brown, M. G., Humphreys, E. R., Moore, T. R., Roulet, N. 2010.
T., and Lafleur, P. M.: Evidencefor a nonmonotonic relation- Kellner, E., Baird, A. J., Oosterwoud, M., Harrison, K.,
ship between ecosystem-scale peatland methane emissions and and Waddington, J. M.: Effect of temperature and at-
water table depth, J. Geophys. Res.-Biogeo., 119, 826–835, mospheric pressuer on methane (CH4 ) ebullition from
https://doi.org/10.1002/2013JG002576, 2014. near-surface peats, Geophys. Res. Lett., 33, L18405,
Bubier, J., Moore, T., Savage, K., and Crill, P.: A compari- https://doi.org/10.1029/2006GL027509, 2006.
son of methane flux in a boreal landscape between a dry Korrensalo, A., Kettunen, L., Laiho, R., Alekseychik, P., Vesala, T.,
and a wet year, Global Biogeochem. Cy., 19, GB1023, Mammarella, I., and Tuittila, E.-S.: Boreal bog plant communi-
https://doi.org/10.1029/2004GB002351, 2005. ties along a water-table gradient differ by their standing biomass
Chen, X. and Slater, L.: Gas bubble transport and emissions for but not by their biomass production, J. Veg. Sci., 29, 136–146,
shallow peat from a northern peatland: The role of pressure https://doi.org/10.1111/jvs.12602, 2018a.
changes and peat structure, Water Resour Res., 51, 151–168,
https://doi.org/10.1002/2014WR016268, 2015.
www.biogeosciences.net/16/2409/2019/ Biogeosciences, 16, 2409–2421, 20192420 E. Männistö et al.: Methane ebullition from a boreal bog
Korrensalo, A., Männistö, E., Alekseychik, P., Mammarella, I., Rinne, J., Riutta, T., Pihlatie, M., Aurela, M., Haapanala, S., Tuovi-
Rinne, J., Vesala, T., and Tuittila, E.-S.: Small spatial variability nen, J.-P., Tuittila, E.-S., and Vesala, T.: Annual cycle of methane
in methane emission measured from a wet patterned boreal bog, emission from a boreal fen measured by the eddy covariance
Biogeosciences, 15, 1749–1761, https://doi.org/10.5194/bg-15- technique, Tellus B, 59, 449–457, 2007.
1749-2018, 2018b. Rinne, J., Tuittila, E.-S., Peltola, O., Li, X., Raivonen, M., Aleksey-
Larmola, T., Tuittla, E.-S., Tiirola, M., Nykänen, H., Martikainen, P. chik, P., Haapanala, S., Pihlatie, M., Aurela, M., Mammarella, I.,
J., Yrjälä, K., Tuomivirta, T., and Fritze, H.: The role of Sphanum and Vesala, T.: Temporal variation of ecosystem scale methane
mosses in the methane cycling of a boreal mire, Ecology, 91, emission from a boreal fen in relation to temperature, water table
2356–2365, 2010. position, and carbon dioxide fluxes, Global Biogeochem. Cy., 32,
LeMer, J. and Roger, P.: Production, oxidation, emission and con- 1087–1106, 2018.
sumption of methane by soils: A review, Eur. J. Soil Biol., 37, Riutta, T., Laine, J., Aurela, M., Rinne, J., Vesala, T., Laurila, T.,
25–50, 2001. Haapanala, S., Pihlatie, M., and Tuittila, E.-S.: Spatial variation
Melton, J. R., Wania, R., Hodson, E. L., Poulter, B., Ringeval, B., in plant community functions regulates carbon gas dynamics in
Spahni, R., Bohn, T., Avis, C. A., Beerling, D. J., Chen, G., a boreal fen ecosystem, Tellus B, 59, 838–852, 2007.
Eliseev, A. V., Denisov, S. N., Hopcroft, P. O., Lettenmaier, D. Rosenberry, R. O., Glaser, O. H., Siegel, D. I., and Weeks, E. P.: use
P., Riley, W. J., Singarayer, J. S., Subin, Z. M., Tian, H., Zürcher, of hydraulic head to estimate volumetric gas content and ebul-
S., Brovkin, V., van Bodegom, P. M., Kleinen, T., Yu, Z. C., lition flux in northern peatlands, Water Resour Res., 39, 1066,
and Kaplan, J. O.: Present state of global wetland extent and https://doi.org/10.1029/2002WR001377, 2003.
wetland methane modelling: conclusions from a model inter- Stamp, I., Baird, A. J., and Heppell, C. M.: The importance of ebul-
comparison project (WETCHIMP), Biogeosciences, 10, 753– lition as a mechanism of methane (CH4 ) loss to the atmosphere in
788, https://doi.org/10.5194/bg-10-753-2013, 2013. a northern peatland, Geophys. Res. Lett., 40, 2087–2090, 2013.
Meredith, M.: Hazards in the bog-real and imagined, Geogr. Rev., Strack, M.: Peatlands and climate change, Jyväskylä, Finland, In-
92, 319–332, 2002. ternational Peat Society, 2008.
Mikhaylov, O. A., Miglovets, M. N., and Zagirova, S. V.: Vertical Strack, M. and Waddington, J. M.: Spatiotemporal variability in
Methane Fluxes in Mesooligotrophic Boreal Peatland in Euro- peatland subsurface methane dynamics, J. Geophys. Res., 113,
pean Northeast Russia, Contemp. Probl. Ecol., 8, 368–375, 2015. G02010, https://doi.org/10.1029/2007JG000472, 2008.
Peltola, O., Raivonen, M., Li, X., and Vesala, T.: Technical note: Strack, M., Kellner, E., and Waddington, J. M.: Dynamics of
Comparison of methane ebullition modelling approaches used biogenic gas bubbled in peat and their effects on peat-
in terrestrial wetland models, Biogeosciences, 15, 937–951, land biogeochemistry, Global Biogeochem. Cy., 19, GB1003,
https://doi.org/10.5194/bg-15-937-2018, 2018. https://doi.org/10.1029/2004GB002330, 2005.
Petrescu, A. M. R., Lohila, A., Tuovinen, J.-P., Baldocchi, D. D., Ström, L., Mastepanov, M., and Christensen, T. R.: Species-specific
Desai, A. R., Roulet, N. T., Vesala, T., Dolman, A. J., Oechel, W. effects of vascular plants on carbon turnover and methane emis-
C., Marcolla, B., Friborg, T., Rinne, J., Matthes, J. H., Merbold, sions from wetlands, Biogeochemistry, 75, 65–82, 2005.
L., Meijide, A., Kiely, G., Sottocornola, M., Sachs, T., Zona, D., Tokida, T., Miyazaki, T., and Mizoguchi, M.: Ebullition of methane
Varlagin, A., Lai, D. Y. F., Veenendaal, E., Parmentier, F.-J. W., from peat with falling atmospheric pressure, Geophys. Res. Lett.,
Skiba, U., Lund, M., Hensen, A., van Huissteden, J., Flanagan, L. 32, L13823, https://doi.org/10.1029/2005GL022949, 2005.
B., Shurpali, N. J., Grünwald, T., Humphreys, E. R., Jackowicz- Tokida, T., Miyazaki, T., Mizoguchi, M., Nagata, O.,
Korczyński, M., Aurela, M. A., Laurila, T., Grüning, C., Corradi, Takakai, F., Kagemoto, A., and Hatano, R.: Falling at-
C. A. R., Schrier-Uijl, A. P., Christensen, T. R., Tamstorf, M. mospheric pressure as a trigger for methane ebullition
P., Mastepanov, M., Martikainen, P. J., Verma, S. B., Bernhofer, from peatland, Global Biogeochem. Cy., 21, GB2003,
C., and Cescatti, A.: The uncertain climate footprint of wetlands https://doi.org/10.1029/2006GB002790, 2007.
under human pressure, P. Natl. Acad. Sci. USA, 112, 4594–4599, Turetsky, M. R., Kotowska, A., Bubier, J., Dise, N. B., Crill,
2015. P., Hornibrook, E. R. C., Minkkinen, K., Moore, T. R.,
Raghoebarsing, A. A., Smolders, A. J., Schmid, M. C., Rijpstra, W. Myers-Smith, I. H., Nykänen, H., Olefeldt, D., Rinne, J.,
I. C., Wolters-Arts, M., Derksen, J., Jetten, M. S., Schouten, S., Saarnio, S., Shurpali, N., Tuittila, E.-S., Waddington, J. M.,
Sinninghe Damsté, J. S., Lamers, L. P., Roelofs, J. G., Op den White, J. R., Wickland, K. P., and Wilmking, M.: A syn-
Camp, H. J., and Strous, M.: Methanotrophic symbionts provide thesis of methane emissions from 71 northern, temperate,
carbon for photosynthesis in peat bogs, Nature, 436, 1153–1156, and subtropical wetlands, Glob. Change Biol., 20, 2183–2197,
2005. https://doi.org/10.1111/gcb.12580, 2014.
Ramirez, J. A., Baird, A. J., and Coulthard, T. J.: The effect of pore Waddington, J. M., Harrison, K., Kellner, E., and Baird, A. J.: Ef-
structure on ebullition from peat, J. Geophys. Res.-Biogeo., 121, fect of atmospheric pressure and temperature on entrapped gas
1646–1656, https://doi.org/10.1002/2015JG003289, 2016. content in peat, Hydrol. Process., 23, 2970–2980, 2009.
Riley, W. J., Subin, Z. M., Lawrence, D. M., Swenson, S. C., Wik, M., Crill, P. M., Varner, R. K., and Bastviken, D.: Multiyear
Torn, M. S., Meng, L., Mahowald, N. M., and Hess, P.: measurements of ebullitive methane flux from three subarctic
Barriers to predicting changes in global terrestrial methane lakes, J. Geophys. Res.-Biogeo., 118, 1307–1321, 2013.
fluxes: analyses using CLM4Me, a methane biogeochemistry Wik, M., Thorton. B. F., Bastviken, D., MacIntyre, S., Verner, R. K.,
model integrated in CESM, Biogeosciences, 8, 1925–1953, and Crill, P. M.: Energy input is primary controller of methane
https://doi.org/10.5194/bg-8-1925-2011, 2011. bubbling in subarctic lakes, Geophys. Res. Lett., 41, 555–560,
https://doi.org/10.1002/2013GL058510, 2014.
Biogeosciences, 16, 2409–2421, 2019 www.biogeosciences.net/16/2409/2019/E. Männistö et al.: Methane ebullition from a boreal bog 2421 Yu, Z., Slater, L. D., Schäfer, K. V. R., Reeve, A. S., and Verner, R. K.: Dynamics of methane ebullition from a peat monolith revealed from a dynamic flux cham- ber system, J. Geophys. Res.-Biogeo., 119, 1789–1806, https://doi.org/10.1002/2014JG002654, 2014. www.biogeosciences.net/16/2409/2019/ Biogeosciences, 16, 2409–2421, 2019
You can also read