Sferic Maps User Guide - Sferic Maps Version 2.8 - Earth Networks
←
→
Page content transcription
If your browser does not render page correctly, please read the page content below

Sferic Maps User Guide

        Sferic Maps
        Version 2.8
        User Guide

          2/9/2021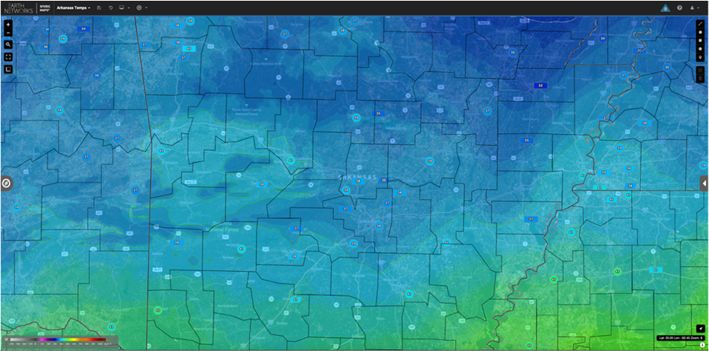
Table of Contents
1     Overview ........................................................................................................................... 4
2     System Requirements ........................................................................................................ 5
    2.1      Firewall Settings Recommendations ....................................................................................... 5
    2.2      Entering a Static IP Into Security Software for Sferic Maps ..................................................... 6
3     Accessing Sferic Maps via a Web Browser ......................................................................... 6
4     Navigating around the Sferic Maps User Interface ............................................................ 8
5     Saving Custom Map Views .............................................................................................. 10
    5.1      To delete a custom map view: .............................................................................................. 13
    5.2      To save map changes to a custom map view after creating a custom map view: ................... 13
6     Working with User Layers ............................................................................................... 14
7     Changing the Custom Base Map ...................................................................................... 17
8     Using the Distance Measuring Tool ................................................................................. 19
9     Using Map Layers ............................................................................................................ 20
    9.1      Sources of Weather Data Available in Sferic Maps ................................................................ 22
10         Map Content in Sferic Maps ......................................................................................... 24
    10.1        Boundaries: ...................................................................................................................... 24
    10.2        Current Observations: ....................................................................................................... 25
    10.3        NDFD Forecast Temp ........................................................................................................ 34
    10.4        Radar & Satellite: .............................................................................................................. 36
    10.5        Lightning ........................................................................................................................... 43
    10.6        Severe Weather ................................................................................................................ 44
    10.7        Tropical............................................................................................................................. 48
    10.8        Alerts ................................................................................................................................ 50
    10.9        Contours ........................................................................................................................... 51
    10.10       Observation Data Points Legend ....................................................................................... 52
11         Working with Map Data .............................................................................................. 53
    11.1        Using the Drawing Tools ................................................................................................... 57
12         Working with Custom Layers........................................................................................ 60
    12.1        Upload Limits to Custom Layers ........................................................................................ 62
    12.2        Editing GeoJSON Code ...................................................................................................... 62
13         Creating Custom Slideshows ........................................................................................ 62

                                                                           2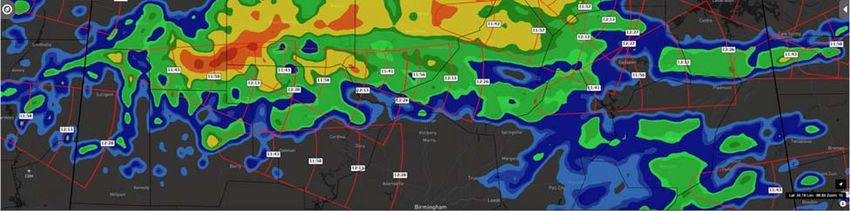
14      Using Broadcast Collaboration Features ...................................................................... 66
15      Customizing Sferic Maps Settings ................................................................................. 69
16      Help for Sferic Maps ..................................................................................................... 70
17      Setting up Alert Notifications in Sferic Maps Alerting ................................................... 70
 17.1        Receive Alerts via Text Message........................................................................................ 75
18      Setting Alert Silence Times ........................................................................................... 76
19      Weather Alert Types Included in Sferic Maps Alerting .................................................. 77
 19.1        Observation ...................................................................................................................... 77
 19.2        Weather Service ............................................................................................................... 77
 19.3        Earth Networks ................................................................................................................. 78
 19.4        Lightning ........................................................................................................................... 80
20      View Alert Locations on Sferic Maps ............................................................................ 80
21      Manage Earth Networks Enterprise Portal Users and Subscriptions ............................. 81
22      Wet Bulb Globe Temperature (WBGT) (Add On) ........................................................... 84
23      Lightning Archive Overview (Add On) ........................................................................... 85
24      Sferic Chat Overview (Add On) ..................................................................................... 89
 24.1        Using Sferic Chat in Sferic Maps ........................................................................................ 89
 24.2        Using Sferic Chat in Sferic Mobile ...................................................................................... 90

                                                                       3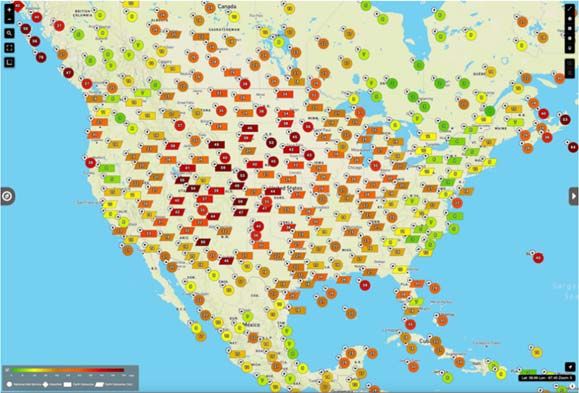
1 Overview
Earth Networks Sferic Maps is an enterprise-class weather visualization dashboard that provides
a fully interactive map experience with a comprehensive collection of exclusive, commercial-
grade weather data. Customers have the ability to monitor near real-time weather observation
data from the Earth Networks weather network and overlay numerous enhanced and exclusive
map layers to stay up-to-date with significant weather events before they develop.

                                               4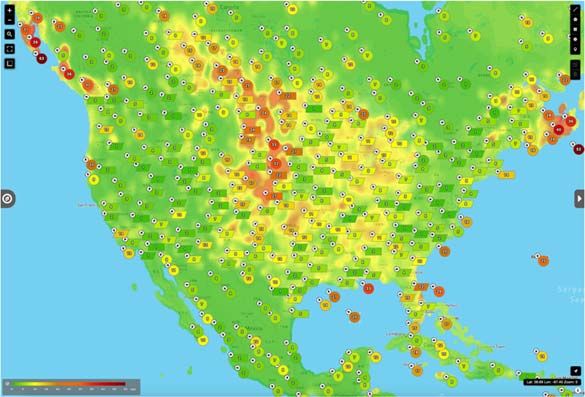
2 System Requirements

Sferic Maps can be accessed on a Windows PC or Mac device using the following web
browsers:

  •      Apple Safari (Mac and iOS)
  •      Google Chrome
  •      Mozilla Firefox
  •      Microsoft Edge (New Chromium-based version)

Mobile devices running iOS or Android can also download Sferic Mobile to access Sferic
Mobile and push notification weather alerts when on the go.

Because Sferic Maps is a web-based product, Sferic Maps can be accessed on other
operating systems such as Google Chrome OS or a distribution of Linux, although
accessing Sferic Maps on a Windows PC or Mac is recommended.

2.1 Firewall Settings Recommendations

Earth Networks recommends whitelisting the following URL’s in the local firewall:

      *.api.earthnetworks.com
      *.tiles.mapbox.com
      *.googleapis.com
      fonts.gstatic.com
      login.earthnetworks.com
      *.bootstrapcdn.com
      pulse.earthnetworks.com
      sfericmaps.enterprise.earthnetworks.com
      sfericmaps.earthnetworks.com
      notification.earthnetworks.com
      profile.earthnetworks.com

                                            5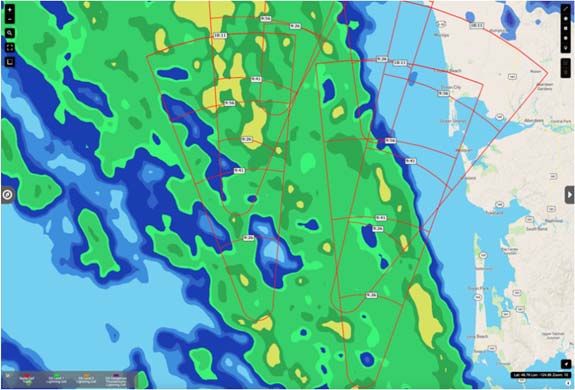
2.2 Entering a Static IP Into Security Software for Sferic Maps

To enter a Static IP into security software to allow Sferic Maps to communicate through
the security software, a proxy can be created on a customer’s network in order to route
data calls through the security software. Sferic Maps is hosted using Amazon Web
Services.

Data can be pulled from the following URL: https://ip-ranges.amazonaws.com/ip-
ranges.json, which can have the IP address ranges pulled into the customer’s firewall for
the Amazon Web Services datacenter region: "us-east-1."

Additionally, customers can whitelist the service name as follows: sns.us-east-
1.amazonaws.com.

Generally, Amazon Web Services recommends whitelisting based on DNS as opposed to
Static IP addresses.

3 Accessing Sferic Maps via a Web Browser

   1. Visit https://Login.EarthNetworks.com.

   2. Sign in with an Earth Networks Enterprise Portal ID (Username is an email
address).

                                            6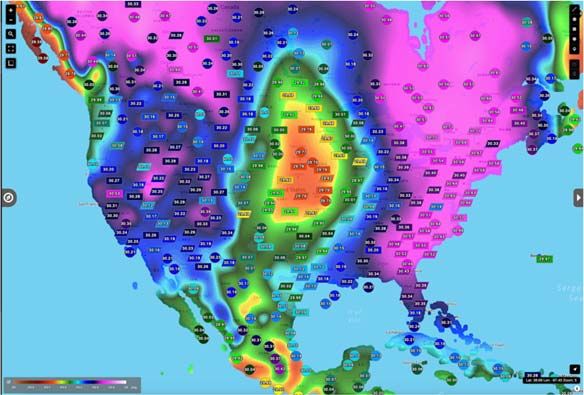
3. On the Earth Networks Enterprise Portal profile screen, select Sferic Maps on the
left-hand sidebar.

   4. Sferic Maps will successfully load.

                                            7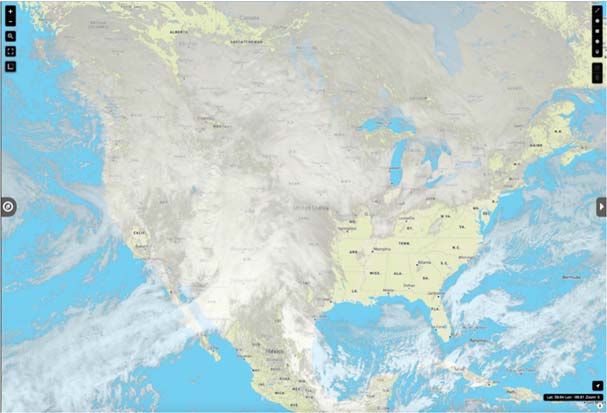
4   Navigating around the Sferic Maps User Interface
To zoom the map view into a more detailed level, select the Zoom In button in the upper
left-hand portion of the screen.

Customers can also more precisely zoom in by using the Select and Zoom button, then
drawing a box around the specific area where the customer wishes to zoom into.

To zoom the map out to a wider level, select the Zoom Out button in the upper left-hand
portion of the screen.

                                           8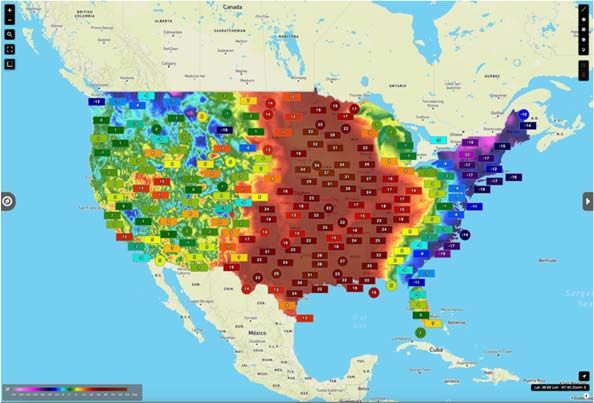
To pan around on the map, left click and drag the mouse around the map.

To view the map in full-screen mode, select the View Full Screen button in the upper
left-hand portion of the screen. To exit full-screen mode, hit the Esc key on the keyboard.

The difference between full-screen mode in Sferic Maps and the web browser’s full-
screen mode is the full-screen mode in Sferic Maps also hides the web browser’s
elements, allowing customers to focus solely on the map and weather data layers in Sferic
Maps. The full-screen mode in the web browser can continue to display the web
browser’s elements. For customers who wish to focus on the map and weather data layers
in Sferic Maps, customers will want to use the full-screen mode in Sferic Maps instead of
the web browser’s full-screen mode.

                                             9
When dragging the mouse cursor around the screen, the Latitude/Longitude of the center
of the map displays in the lower-right corner of the screen. The Latitude/Longitude of the
mouse is labeled with Cursor.

5 Saving Custom Map Views
Sferic Maps customers can save multiple custom map views and easily switch between
them.

   To create a custom map view:

   1. Select the Custom Map Views drop down menu on the main toolbar.

   2. Select Add.

  3. Name the custom map view, then select Save (checkmark) icon to save the custom
map view.

                                            10
A good naming convention to use in Sferic Maps for custom map views is the geographic
location (such as a country, region state, city, county, or location) and one of the map
weather data layers (such as temperatures, radar, or lighting).
To switch between custom map views:
1. Select the Custom Map Views drop down menu on the main toolbar.
2. Select the custom map view.
3. Sferic Maps will switch to custom map view selected.
11To re-arrange custom map views:
1. Select the Custom Map Views drop down menu on the main toolbar.
2. Select and drag Re-Arrange Map View icon next to the custom map views the
customer wishes to re-arrange.
3. The custom map views will be re-arranged in the custom map views drop down
menu to the customer’s preference.
To edit a custom map view’s name:
1. Select the Custom Map Views drop down menu on the main toolbar.
122. Select Edit View Name (pencil) icon next to the custom map view’s name needing
editing.
3. Edit the custom map view’s name, then select the Save (check box) icon to save the
custom map view’s name edits.
5.1 To delete a custom map view:
1. Select the Custom Map Views drop down menu on the main toolbar.
2. Select the Delete View “x” icon next to the custom map view the customer wishes
to delete.
5.2 To save map changes to a custom map view after creating a custom map view:
1. Make the necessary map changes such as zooming, panning, adding, or removing
map layers.
132. Select the Save View icon on the main toolbar.
To undo map changes to a custom map view since previously saving changes to a
custom map view, select the Undo View Changes icon on the main toolbar.
6 Working with User Layers
After customers add various weather data map layers to Sferic Maps, customers can
adjust many of the various weather data map layers using the User Layers panel in the
Workspace. To work with User Layers in Sferic Maps, customers will want to perform
the following steps:
1. Add one or more weather data map layers to the map.
142. Click to expand the Workspace from the right-hand side of the screen.
3. Select the User Layers tab is at the top of the Workspace from the right-hand side
of the screen.
4. To show or hide a weather data map layer without completely removing the layer
from the map, select the Show/Hide icon next to the weather data map layer in the User
Layers tab.
5. To display a legend of the weather data map layer inside the User Layers tab,
select the show legend button next to the weather data map layer in the User Layers tab.
To display the legend of the weather data map layer directly on the map, select the
checkbox next to the weather data map layer’s legend under User Layers.
156. To change the opacity of a weather data map layer, change the number of the
Opacity (from 0 to 100) next to the weather data map layer in the User Layers pane.
7. Some weather data map layers offer the ability to adjust additional options
concerning the weather data map layer using drop down menus. For example, observation
points allow customers to turn the plot symbology (polygons) on or off on the map using
the User Layers pane.
8. Some weather data map layers allow the ability to animate the weather data map
layer. To animate these layers, select the Animate button next to the weather data map
layer in the User Layers pane.
The following map layers can be animated in Sferic Maps:
• Radar
• Forecast Radar
• PulseRad
• Single Site Radar
• Storm Cell Info
• Global IR Satellite
• European IR Satellite
• North America IR Satellite
• North America Visible Satellite
• Lightning
• Lightning Cell Tracks
• Lightning Polygons
169. Weather data map layers can be re-arranged in the User Layers pane, as well as
one weather data map layer can be sent to the top by selecting the arrow.
7 Changing the Custom Base Map
Sferic Maps includes a range of custom high-resolution map backgrounds available to
customers. In order to change the custom base Map in Sferic Maps, complete the
following steps:
1. Select the arrow on the right-hand side of the screen to expand the User Layers
workspace.
172. Select the Change button in the lower right corner.
3. Select one of the custom base map backgrounds and select Done.
4. The custom base map background will change to the customer’s selection.
Each saved custom view can have a custom base map background.
188 Using the Distance Measuring Tool
To use the distance measuring tool in Sferic Maps, customers will want to complete the
following steps:
1. Select the Measure Distances and Areas icon in the upper left-hand portion of the
screen. Select Create a New Measurement.
2. Click anywhere on the map to create the starting point. Click to create the finishing
point. The distance will display in the upper left-hand portion of the screen.
If you click on a third point, the area will be displayed in addition to the distance.
3. Select Finish Measurement. The measurement will move into a popover
connected to the line drawn on the map.
194. When finished with the measurement, select Delete in the measurement popover.
9 Using Map Layers
Sferic Maps offers a range of weather data map layers. To add or remove map layers in
Sferic Maps, customers will want to perform the following steps:
1. Open the Map Layers panel on the left-hand portion of the screen.
202. Select the plus button to expand one of the major categories of weather data map
layers (this example will use the Current Observations major category).
3. To add a weather data map layer to the map, select the checkbox next to the
contours column (most weather data map layers) and/or the points column (Current
Observations and Forecast) next to a weather data map layer.
4. To remove a weather data map layer to the map, de-select the checkbox next to the
contours column (most weather data map layers) and/or the points column (Current
Observations and Forecast) next to a weather data map layer.
5. To see all major categories expanded in the Map Layers panel, select Expand All.
To see all major categories collapsed in the Map Layers panel, select Collapse All.
Customers can also use the search box on the Map Layers panel to search for a particular
weather data map layer.
219.1 Sources of Weather Data Available in Sferic Maps
The sources of weather data available in Sferic Maps include public weather data sources
from the National Weather Services and other international weather agencies, as well as
exclusive data from the Earth Networks network of real-time, commercial-grade weather
stations across the globe.
The Difference Between the Commercial Weather Data Exclusive to Earth Networks in
Sferic Maps and Public Weather Data Available Elsewhere
Some of the weather data exclusive to Earth Networks that is available in Sferic Maps
includes:
• Observations from the Earth Networks weather network; a global network of real-
time, commercial-grade weather stations
• Lightning data from the Earth Networks Global Lightning Network; the world’s
most advanced lightning network capable of detecting both in-cloud and cloud-to-
ground lightning.
• Camera images from the Earth Networks camera network; offering high-definition
views of weather conditions installed at various Earth Networks weather station
locations.
• Earth Networks Dangerous Thunderstorm Alerts; weather alerts generated from
intense lightning activity detected by the Earth Networks Total Lightning Network
as a precursor to major severe weather events.
• PulseRad; a Doppler radar alternative based on lightning intensity from the Earth
Networks Total Lightning Network, useful in areas where traditional Doppler
radar does not reach.
• ENcast; pinpoint accurate forecasts anywhere on the globe using the observation
data from the Earth Networks weather network.
22Refresh Rate for Weather Data in Sferic Maps
Sferic Maps automatically refreshes the map display once every minute. However, map
data layers will update at various intervals depending on the map data layer type:
• Observation data points update based on the station’s update rate. Customers can
force a refresh update of data points by panning the map.
• Observation contours update once every five minutes.
• Radar layers update once every five minutes.
• Satellite layers update once every fifteen minutes for North America and Europe
and once every hour for global IR satellite.
• Snow, ice, and rain layers generally update once every hour, although they can
update on a variable basis.
• River flood layers update about two to four times per day.
• Tropical layers will generally update about four times per day.
• Alert layers update once every minute.
Geographic Coverage of the Data Available in Sferic Maps
The weather data in Sferic Maps includes global geographic coverage spanning six
continents (North America, South America, Europe, Africa, Asia, and Australia). Earth
Networks operates the world’s largest commercial grade weather network in the industry.
For more information concerning the geographic coverage of the Earth Networks weather
network, click here.
Please note that some of the weather data in Sferic Maps is only available in select
geographic regions, and some of the weather data in Sferic Maps is only available in the
United States. The majority of the weather data in Sferic Maps, including weather data
exclusive to Earth Networks, is available across our entire global geographic coverage.
2310 Map Content in Sferic Maps
10.1 Boundaries:
US States: Boundary lines for all fifty United States. Customers can customize the color
(from eight different color choices) and width (from five different width choices) for the
boundary lines.
US Counties: Boundary lines for the counties of all fifty United States. Customers can
customize the color (from eight different color choices) and width (from five different
width choices) for the boundary lines.
2410.2 Current Observations:
Temperature: The current temperatures measured in degrees (available globally,
includes temperature data from the exclusive Earth Networks weather network).
Temperature Rate: The rate of change of the temperature across an hour, measured in
degrees /hour (available globally, includes temperature data from the exclusive Earth
Networks weather network).
25High Temperature: The current day’s high temperatures measured in degrees (available
globally, includes temperature data from the exclusive Earth Networks weather network).
Low Temperature: The current day’s low temperatures measured in degrees (available
globally, includes temperature data from the exclusive Earth Networks weather network).
26Dew Point: The current dew points in which the atmosphere must be cooled to achieve
water vapor saturation measured in degrees (available globally, includes data from the
exclusive Earth Networks weather network).
Dew Point Depression: The difference between the temperature and dew point
normalized to sea level (available globally, includes data from the exclusive Earth
Networks weather network).
27Wet Bulb Approximation: The approximation of the web bulb temperature is the
coolest temperature possible due to evaporation. Note that this is different from the
Wet Bulb Globe temperature, which takes more variables into account, such as sun
and wind (includes data from the exclusive Earth Networks weather network).
Humidity: The current humidity determining the amount of moisture in the atmosphere
measured in percentages (available globally, includes humidity data from the exclusive
Earth Networks weather network).
28Heat Index: The current heat indices factoring humidity into temperature readings to
determine how warm the weather feels during summer weather measured in degrees
(available globally, includes data from the exclusive Earth Networks weather network).
Wind Chill: The current wind chill observations factoring wind into temperature
readings to determine how cold the weather feels measured in degrees (available
globally, includes data from the exclusive Earth Networks weather network).
29Wind Speed and Direction: The current wind speed and direction; measurement varies
by selected unit under Settings (available globally, includes data from the exclusive Earth
Networks weather network).
Hourly Wind Gust and Direction: The past hour’s highest wind speed; measurement
varies by selected unit under Settings (includes data from the exclusive Earth Networks
weather network).
30Daily Wind Guest and Direction: The current day’s highest wind speed; measurement
varies by selected unit under Settings (available globally, includes data from the
exclusive Earth Networks weather network).
Rain Rate: The current rate of rainfall; measurement varies by selected unit under
Settings (generally in a measurement per hour such as inches per hour, available globally,
includes rain data from the exclusive Earth Networks weather network).
31Daily Rain: The current day’s rain totals (starting from midnight); measurement varies
by selected unit under Settings (available globally, includes rain totals from the exclusive
Earth Networks weather network).
Sea Level Pressure: The current sea-level adjusted barometric pressure reading;
measurement varies by selected unit under Settings (available globally, includes data
from the exclusive Earth Networks weather network).
32Sea Level Pressure Rate: The pressure rate normalized to sea level. The pressure rate
used on the Earth Networks weather network is always normalized to sea level (available
globally, includes data from the exclusive Earth Networks weather network).
Pollen: The current pollen count measured on a scale of 0 to 12.5 (United States only,
data sourced from Pollen.com).
33Temperature Deviation from Yesterday: The difference between the temperature from
the previous day to the current day, measured in degrees (available globally, includes
data from the exclusive Earth Networks weather network).
10.3 NDFD Forecast Temp
NDFD Current Temperature Forecast: NWS Forecast information provided by the
National Digital Forecast Database (NDFD).
34NDFD Low/High Forecast Temperatures for Days 1-7: NWS Forecast information for
high and low temperatures provided by the NDFD available as point data and color
contour (from 12 am local time to approximately 8 am local time, the Day 7 low
temperature will be unavailable until the overnight model run is updated).
Temp Deviation: Displays the deviation between forecast temperatures and current
temperatures as point data and color contour. Available in three selections: Current Temp
from Low Temp Forecast, Current Temp from High Temp Forecast, and Current Temp
Forecast from Current Observed.
3510.4 Radar & Satellite:
Radar: The current reflectivity radar mosaic (Level III NEXRAD). Includes winter
precipitation typing differentiating between rain, snow, and wintry mix precipitation.
Winter precipitation typing utilizes temperature data from the exclusive Earth Networks
weather network to more accurately fine-tune the contours between winter precipitation
typing differences (United States and Canada only).
Forecast Radar: The forecast precipitation/reflectivity radar mosaic (data from a
proprietary algorithm using current radar and model data) for the next two hours in ten-
minute intervals. Includes winter precipitation typing differentiating between rain, snow,
and wintry mixed precipitation. Winter precipitation typing utilizes temperature data
from the exclusive Earth Networks weather network to more accurately fine-tune the
contours between winter precipitation typing differences (United States Only).
36Storm ETA: Displays the estimated time or arrival for the core of the storm cell to reach
an area. The forecast polygon displays up to 45 minutes from now with a range ring at
each 15-minute interval. When zoomed in, the range ring displays the local time when the
core will reach that area. Red displays ETAs from NWS SCIT vectors and NWS Doppler
Radar SCIT storm tracks. Green through Purple displays lightning storm tracks from the
exclusive Earth Networks Total Lightning Network. Green displays Level 1 lightning cell
tracks, Orange displays Level 2 lightning cell tracks, and Purple displays Earth Networks
Dangerous Thunderstorm lightning cell tracks.
PulseRad: The current reflectivity mosaic of the exclusive Earth Networks PulseRad
radar alternative based on lightning intensity from the Earth Networks Total Lightning
Network. PulseRad is especially useful in geographic areas where traditional radar is
difficult or impossible to reach (available globally). More information about PulseRad is
available here.
37Single Site Radar: The current radar data (Level III NEXRAD) available at single radar
sites (United States only). After selecting the Single Site Radar option, one will need to
choose the radar site one wishes to view radar data from. Each radar site name is a four-
letter callsign.
The following single site radar data layers are available in Sferic Maps:
Base Reflectivity: The current reflectivity displaying the intensity of precipitation or a
storm in (measured in DBZ). Unlike the radar mosaic, single site radar data is not
smoothed or filtered but offered in its original format. It also does not display winter
precipitation typing due to the raw nature of the radar data.
Base Velocity: The current radar-indicated winds blowing toward and away from the
radar site, beneficial for detecting wind shear during a severe weather event (measured in
knots).
38Storm Relative Velocity: The current radar-indicated winds blowing toward and away
from the radar site, not including the motion of the storm, additionally beneficial for
detecting wind shear during a severe weather event (measured in knots).
The following SCIT (Storm Cell Identification and Tracking) data layers from the
National Weather Service are available in Sferic Maps:
Storm Tracks: Storm Tracks are generated by the National Weather Service (displayed on
the map as pink arrows) to determine the direction of the storm. Clicking on a Storm
Track displays more information about the storm under Map Data.
39Hail Index: Hail Index indicators determine areas of potential hail occurring in a storm,
as well as the estimated size of the hail (monitored in inches or portions of an inch).
Meso Cyclones: Meso Cyclone indicators determine areas of intense wind shear which
can be a precursor for severe thunderstorms and tornadoes.
TVS/ETVS: TVS (Tornado Vortex Signature) and ETVS (Elevated Tornado Vortex
Signature) indicators determine areas of intense wind shear which can be a precursor for
tornadoes. ETVS indicators determine intense wind shear in upper elevations in the
atmosphere. TVS indicators determine intense wind shear extending to the base of the
storm, a strong indication of the potential for a tornado.
Storm Cell Info: Displays the speed in knots and direction of storm cells associated with
NWS Severe Thunderstorm and Tornado Warnings (Continental United States only).
40Global IR Satellite: The current infrared satellite (available during the day or night),
displaying cloud cover (available globally).
European IR Satellite: The current infrared satellite (available during the day or night),
displaying cloud cover (Europe only).
41North America IR Satellite: The current infrared satellite (available during the day or
night), displaying cloud cover (United States, Canada, Mexico, and Central America
only).
North America Visible Satellite: The current visible satellite (available during the day
only), displaying cloud cover (United States, Canada, Mexico, and Central America
only).
4210.5 Lightning
Lightning: Current lightning data from the exclusive Earth Networks Total Lightning
Network (available globally). Lightning type can be viewed as a Flash or Pulse.
Lightning times can be viewed over the past 1, 5, 15, 30, and 60 minutes. Lightning
classification can be viewed as Cloud To Ground, In Cloud, or Both. More information
about the Earth Networks Total Lightning Network is available here.
Lightning Cell Tracks: The current path and direction of lightning strikes using
lightning data from the exclusive Earth Networks Total Lightning Network. Lightning
flashes per minute are displayed on a color scale ranging from 2.5 to 50 (available
globally).
43Lightning Polygons: A polygon with vertices around the area of the severe weather for
the duration of the alert. The alerted area’s severe weather is related to a lightning cell
with various rates of lightning (available globally).
10.6 Severe Weather
Rain Water Accumulation
Rain accumulations over the past 1, 3, 6, 12, and 24 hours estimated from radar
(Continental United States only). Layers have different default opacities to allow for
visual distinction when multiple are enabled. Older layers are more transparent.
44Snow Amount
Snow accumulations over the past 1, 3, 6, 12, and 24 hours estimated from radar (Continental
United States only). Layers have different default opacities to allow for visual distinction when
multiple are enabled. Older layers are more transparent.
Snow Amount Forecast
A weather forecast model from the NWS showing snowfall amount possibilities over the next 0-
6, 6-12, 12-18, and 18-24 hours, measured in inches (United States only).
45Snow Probability Forecast
A weather forecast model from the NWS showing the probability of snow over the next 0-24,
25-48, and 49-72 hours in increments greater than 4, 8, or 12 inches, measured in percentages
(United States only).
Freezing Rain Probability Forecast
A weather forecast model showing the probability of freezing rain greater than .25” over the next
0-24, 25-48, or 49-72 hours, measured in percentages (United States only).
Significant River Flood Outlook
A general outlook for significant river flooding (data from the NWS
Hydrometeorological Prediction Center). Red indicates occurring or imminent significant
flooding. Orange indicates likely significant river flooding. Yellow indicates possible
river flooding (United States Only).
46Flash Flood Guidance
Estimates the average number of inches of rainfall for given durations required to
produce flash flooding (data from the NWS River Forecast Centers by county, guidance
is based on current soil moisture conditions). Available for one, three, six, twelve, and
twenty-four-hour durations (United States Only).
Local Storm Reports
Current storm reports from the National Weather Service SKYWARN storm spotter
program (United States only).
47Storm reports can be narrowed down to only display the following categories:
• Coastal
• Severe
• Wind
• Flood
• Temperature
• Winter
• Other
Clicking on a storm report displays additional information concerning the storm report
under Map Data.
10.7 Tropical
Atlantic-Active Storms: A look at the current active tropical-related storms in the
Atlantic from the National Hurricane Center (available in the Atlantic Ocean region
only).
Atlantic-Historical Storms: A look at previous tropical-related storms in the Atlantic
from the National Hurricane Center from this last season (available in the Atlantic Ocean
region only).
48Pacific-Active Storms: A look at the current active tropical-related storms in the Pacific
from the National Hurricane Center (available in the Pacific Ocean region only).
Pacific-Historical Storms: A look at previous tropical-related storms in the Pacific from
the National Hurricane Center from this last season (available in the Pacific Ocean region
only).
4910.8 Alerts
National Weather Service Weather Alerts (United States only)
NWS alerts can be displayed using the following categories:
• Most Recent: Shows the most recently issued alert from the NWS for the location.
Sometimes there are multiple alerts out for locations (the alert layers do not show
more than one alert at a time) so the “most recent” will show the one that was
more recently updated. There is no time frame for how long alerts would show
except the expire time set by NWS.
• Civil Emergency: Alerts related to the overall civil safety of citizens
• Coastal: Alerts related to marine and boating in coastal areas
• Tropical: Alerts related to tropical weather such as Tropical Storms or Hurricanes
• Fire: Alerts related to fire dangers during extreme dry conditions
• Non-Precipitation: Alerts not involving precipitation such as a Lake Wind
Advisory
• Winter: Alerts related to winter weather such as a Winter Weather Advisory or
Winter Storm Warning
• Flood: Alerts related to flooding such as a Flood Advisory
• Severe: Alerts related to severe weather such as a Severe Thunderstorm Warning
or Tornado Warning
• Special Weather Statements: Not alerts. They are meant to inform the public on a
unique weather situation that is not quite reaching alert criteria. They can be on
virtually anything – gusty winds, heavy rain, snow, fog, blowing dust, smoke, etc.
50Earth Networks DTA: Earth Networks Dangerous Thunderstorm Alerts (DTA) are
weather alerts based on the Earth Networks Total Lightning Network providing
approximately 45 minutes of advanced warning to major severe weather events, 50%
faster than traditional severe weather alerts. Displays on the map as purple polygons
(available globally, exclusive to Earth Networks). More information about Earth
Networks DTA is available here.
10.9 Contours
The majority of the weather data map layers available in Sferic Maps are available as
contours, which are graphical representations of various weather data layers. Current
Observation data layers are also available as points, which are numerical representations
of the observation data layers.
5110.10 Observation Data Points Legend
Sferic Maps includes four different sources of observation data points: National Met
Service, MesoNet, Earth Networks, and Earth Networks Cam. Below is a detailed
description of each data source:
National Met Service: The National Met Service includes public weather data sources
from the National Weather Service and other international weather agencies, including:
METAR, SYNOP, BUOY, and C-MAN.
MesoNet: A MesoNet is defined by the National Weather Service as “a regional network
of observing stations (usually surface stations) designed to diagnose mesoscale weather
features and their associated processes.” (Source: NWS Glossary)
Earth Networks: The exclusive Earth Networks weather network, a global, real-time
network of commercial-grade weather stations. Sferic Maps is the only enterprise weather
visualization platform to include access to Earth Networks observations out-of-the-box.
Camera images displayed in the Online Weather Center for an Earth Networks weather
station without a camera will display the active camera closest to the weather station.
Earth Networks Cam: The exclusive Earth Networks weather network, a global, real-
time network of commercial-grade weather stations. Sferic Maps is the only enterprise
weather visualization platform to include access to Earth Networks observations out-of-
the-box. Camera images displayed in the Online Weather Center for an Earth Networks
weather station with a weather camera will display the active camera for the weather
station.
Observations from NWS CWOP/MADIS weather stations may also be available to Sferic
Maps in a future update.
5211 Working with Map Data
Sferic Maps allows customers to select points of weather data map layers (such as
observations, storm tracks, lightning cell tracks, and storm reports) to receive additional
informative map data. To access map data for select points of weather data map layers,
customers will want to perform the following steps:
1. Add a weather data map layer that supports map data to the top of the map layer list
(this example will use temperature points).
2. Click to expand the Workspace from the right-hand side of the screen.
533. Select one of the weather map layer points (this example will select one of the
temperature points).
4. The map data from the selected point will appear in the Map Data tab of the
Workspace on the right-hand side of the screen. Multiple data points can be selected to
add additional map data to the Map Data tab.
5. To export map data points as a CSV file, select Export as CSV from the top of the
Map Data tab on the Workspace at the right-hand side of the screen. To clear all map
data points, select Clear All Map Data from the top of the Map Data tab.
546. To re-arrange map data points, click and drag the re-arrange icon to the
customer’s desired position. To remove an individual map data point, select the remove
map data point icon next to the map data point the customer wishes to remove.
7. Current observation map data points allow to toggle to view or hide extended detail
by clicking the toggle icon next to Detail in the current observation map data point. Note
that this data DOES NOT UPDATE and is static from the time of selection.
Customers can view additional details for a current observation map data point by
clicking on Online Weather Center, which brings up the Online Weather Center page
for the current observation map data point.
55When clicking on a Lightning Cell Track map layer, the Cell Track information
displays in the Map Data tab.
Select the plus button to display a table of additional lightning cell track history.
56Customers can also select History to display a more detailed table, as well as a detailed
chart of lightning cell track history. The table can be copied or exported, and customers
can choose between a line, column, or area chart.
11.1 Using the Drawing Tools
Sferic Maps includes a range of drawing tools available to customers. Customers can
currently use the following drawing tools in Sferic Maps:
• Polyline
• Polygon
• Rectangle
• Circle
• Marker
To use one of the drawing tools in Sferic Maps:
1. Select one of the drawing tools in the upper right-hand portion of the screen (this
tutorial will use the polyline).
572. Click anywhere on the map to start drawing. Drag the mouse and click again to
continue the drawing. Select Finish in the upper right portion of the screen when finished
drawing (The Finish option is not available and not needed for rectangle, circle, or
marker).
To delete a drawing in Sferic Maps:
1. Select the Delete Layers button in the upper right-hand portion of the screen.
2. Select the drawing on the map to delete the drawing. Select Save in the upper right-
hand portion of the screen when finished deleting drawings.
58Drawing tools can also be saved as Custom Layers in Sferic Maps. To learn more about
saving drawing tools as custom layers, see this Earth Networks support video. To learn
more about custom layers, see Working with Custom Layers.
Customers can choose between English and Metric units for displaying the distance
measurements in the drawing tools using the Settings panel in the upper-right portion of
the screen.
5912 Working with Custom Layers
In addition to the weather data map layers included in Sferic Maps, customers can add a
variety of custom layers to Sferic Maps using GeoJSON code, GeoJSON files, or
shapefiles (uploaded in ZIP format). Drawing tools can also be saved as custom layers
(for more information, see Using the Drawing Tools). To add and use custom layers in
Sferic Maps, customers will want to perform the following steps:
1. Click to expand the Map Layers panel on the left-hand portion of the screen.
2. Select the Upload button next to the Custom Layers section of the Map Layers
panel.
3. A traditional computer file manager dialog box will appear, allowing the user to
browse to and select and choose the custom layer file to upload. This dialog box will vary
in design between a Mac and a Windows PC.
604. To view the custom layer on the map, click to select the check box next to the
custom layer. To remove a custom layer from the map, click to de-select the check box
next to the custom layer. Custom layers can also be edited or downloaded from the
Custom Layers panel.
5. To remove a custom layer, select the Delete Layer button next to a custom layer
needing removing. Customers will be prompted to confirm deleting custom layers.
6. Some custom layers can display information in the Map Data panel on the right-
hand portion of the screen by clicking on points in a custom layer.
7. Some custom layers colors, line width, and opacity can be adjusted using the User
Data tab in the workspace (for more information, see Working with User Data).
6112.1 Upload Limits to Custom Layers
The following upload limits apply to custom layers:
• 30 MB for GeoJSON files
• 10 MB for ShapeFile format files
The majority of Sferic Maps customers upload custom layers with file sizes somewhat
smaller than the above upload limits, so Sferic Maps customers should be able to easily
upload custom layers within the upload limits.
12.2 Editing GeoJSON Code
Editing GeoJSON code within Sferic Maps is only available with custom layers created
from the drawing tools.
To edit a custom layer’s GeoJSON code created from an uploaded GeoJSON file, the
customer must download the file, make the edits, and re-upload the file back into Sferic
Maps.
13 Creating Custom Slideshows
Sferic Maps allows customers to create custom slideshows of saved custom views,
allowing customers to automatically transition between custom views using a specified
interval. To create a custom slideshow, customers will want to complete the following
steps:
1. Select the Slideshows button on the main toolbar.
2. Select the Add button in the bottom left-hand portion of the Slideshows dialog box.
623. Name the custom slideshow in the top portion of the Slideshows dialog box.
4. Use the checkboxes next to the saved custom views to select the saved custom
views the customer wishes to include in the slideshow.
5. Use the interval drop down menus next to the saved custom views to select the
desired interval between 10 seconds and 10 minutes to select the interval for which saved
custom views will transition. Each saved custom view can select a different interval if
desired.
636. To re-arrange saved custom views in the slideshow order, click and drag the re-
arrange icon next to a saved custom view to move that view into the order preferred by
the customer.
7. To save a custom slideshow, select the Save button near the bottom of the
Slideshows dialog box.
648. To edit a custom slideshow name, select the Edit Name button near the bottom of
the Slideshows dialog box.
9. To start a custom slideshow, select the Start button near the bottom of the
Slideshows dialog box.
10. To stop a custom slideshow, select the Slideshows button on the main toolbar,
then select the Stop button near the bottom of the Slideshows dialog box.
6511. To delete a custom slideshow, select the Delete button near the bottom of the
Slideshows dialog box.
14 Using Broadcast Collaboration Features
Sferic Maps includes a built-in collaboration feature that allows customers to broadcast
their Sferic Maps screen to other colleagues who are currently signed into a Sferic Maps
account. No additional third-party software is needed, and no software installation is
required to use these features. To use the built-in broadcast collaboration features in
Sferic Maps, customers will want to complete the following steps.
1. The broadcaster will select the Collaboration button on the main toolbar.
662. Click on New Broadcast.
3. An alphanumeric code consisting of four characters appears. Customers will want
to copy the code and give it to other colleagues signed into Sferic Maps who need to join
in the broadcast.
4. Colleagues signed into Sferic Maps who need to join in the broadcast should select
the Collaboration button on the main toolbar, then select View Broadcast.
675. Colleagues will then paste in the four-character alphanumeric code, then select
Start, to join the broadcast.
6. Everything the customer who has initiated the broadcast does in Sferic Maps
(zooming/panning, map layers, animations, etc.) will automatically be mirrored to other
colleagues signed into Sferic Maps who have joined the broadcast.
7. To end the broadcast, select Cancel Broadcast.
Taking Screenshots of Sferic Maps
The collaboration tools included in Sferic Maps are limited to streaming one’s Sferic
Maps screen among colleagues who are currently signed into a Sferic Maps account. In
order to live-stream one’s Sferic Maps screen to a wide audience, as well as to capture
screenshots or screencasts from Sferic Maps, a customer will need to utilize a third-party
solution.
6815 Customizing Sferic Maps Settings
Sferic Maps offers customers the ability to customize specific settings (including
language and units). To customize settings, customers will want to perform the following
steps:
1. Select the User icon in the upper right corner of the screen.
2. Select Settings.
3. Customers can choose from the following settings:
• Language
• Unit Type (English or Metric)
• Date/Time Format (Month/Day/Year Hours:Minutes:Seconds or Day/Month/Year
Hours:Minutes:Seconds)
• Hour Format (twelve or twenty-four hour format)
6916 Help for Sferic Maps
Sferic Maps has articles and training videos accessible within the tool. To access such:
1. Select the question mark to the left of the User icon
2. This will take you to the Support page where articles, documentation, and training
videos may be found.
17 Setting up Alert Notifications in Sferic Maps Alerting
Sferic Maps allows customers to send custom alerts over email, text message (by
formatting the phone number as an email address), or as a push notification to
smartphones running Sferic Mobile. To setup custom alert notifications in Sferic Maps
Alerting, customers will want to complete the following steps:
1. Sign into the Earth Networks Enterprise Portal at
https://profile.earthnetworks.com. Select Alerting on the left-hand sidebar.
702. Under the Notification Configuration screen, click to ensure the Manage
Locations screen is selected. Select Add New Location. Customers can add multiple
locations to the Manage Locations screen.
3. Enter the location name in the Name Location text box. Customers can enter
locations either as an Address or as a Lat/Lon. Locations entered as a Lat/Lon are
generally more precise (although this tutorial will use an address). Select the radio button
for either Address or Lat/Lon depending on the customer’s preference. Enter in the
address or Lat/Lon coordinates (or click on the map to drop the pin on the location) or
address, then select Create Location.
4. The location is added to the Manage Locations screen. To edit a location, select
the Edit Location button next to the location needing editing. To remove a location,
select the Delete Location button next to the location needing removing. Customers can
also filter the minimum amount of locations that appear on each page of the Manage
Locations screen, as well as search for locations.
715. Select the Manage Delivery tab. Any smartphones logged into the Sferic Mobile
app will automatically appear on the list. If a smartphone logged into the Sferic Mobile
app is not displaying in the list, log out of Sferic Mobile and then log back in, then select
Refresh in Sferic Maps to refresh the list of devices. To add an email address or text
message phone number (by formatting the phone number as an email address), select
Add New Device.
6. Enter a descriptive or recognizable name for the email address (such as a person’s
name) into the Name Device text box. Enter the email address or text message phone
number (by formatting the phone number as an email address) in the Email Address text
box. Select Create Device.
7. The email address is added to the Manage Delivery tab. To edit an email address,
select the Edit Device button next to the email address that needs to be edited. To remove
an email address or a device that was previously signed into Sferic Mobile, select the
Delete Device button next to the email address or device needing removing. Customers
can also filter the minimum amount of email addresses and/or devices that appear on each
page of the Manage Delivery tab, as well as search for email addresses or devices.
728. Select the Manage Rules tab. Select Add New Rule.
9. There are three categories of rules available to Sferic Maps alerting customers:
a. Observation: Observation alerts allow Sferic Maps Alerting customers to
set custom alerts concerning various weather observation parameters from
the exclusive Earth Networks weather network. Customers can choose the
radius distance from the custom location from which to capture weather
stations, as well as the threshold to be exceeded when issuing the alert.
These alerts are available as long as a viable station falls within the radius
distance.
b. Weather Service: Weather Service alerts are issued by the National
Weather Service (United States only), as well as Earth Networks
Dangerous Thunderstorm Alerts (available globally). Earth Networks
Dangerous Thunderstorm Alerts (DTA) are weather alerts based on the
Earth Networks Total Lightning Network providing approximately 45
minutes of advanced warning to major severe weather events, 50% faster
than traditional severe weather alerts. More information about Earth
Networks DTA is available here. Customers can also choose to include
watches in addition to warnings with many of the NWS major weather alert
categories.
c. Lightning: Lightning alerts allow customers to set custom alerts when
lightning occurs within the radius distance of the custom location, as well
as the duration of how long there must be no lightning in the radius till an
all clear is issued. Customers can also choose to send an All Clear message
when lightning has not been detected in the radius distance based on the
duration specified. Lightning alerts are provided by the exclusive Earth
Networks Total Lightning Network. More information about the Earth
Networks Total Lightning Network is available here.
73Customers will need to create a new rule for the major categories of Observation and
Lightning.
10. Enter a name for the rule in the Rule Name text box. Choose a location from the
Choose Location. Choose the emails or devices from the Choose Device to receive the
alert. Customers can choose to send a test notification by selecting the Send Test Alert
button.
11. Choose one of the major categories of rules (Observation, Weather Service, or
Lightning, this tutorial will use the Lightning category). Configure the rule parameters,
then select Add Rule.
12. To enable a rule, click to toggle the Active switch to On. To disable a rule, click
to toggle the Active switch to Off. To export a rule, select a rule via the check box to its
right and then select the Export button for a rule that needs to be exported. To edit a rule,
select the Update Rule button next to the rule under the actions column. To remove a
rule, select the Delete Rule button next to the rule under the actions column. Customers
can also bulk import or export rules, choose how many rules display on each page on the
Manage Rules tab, as well as search for rules.
7417.1 Receive Alerts via Text Message
Sferic Maps Alerting customers can receive configured alerts via text message by having
an email sent to one’s mobile phone as a text message. To do so, setup the email in the
following format based on the mobile carrier of the recipient.
United States Wireless Carriers:
AT&T: phonenumber@txt.att.net
Cricket: phonenumber@mms.cricketwireless.net
Metro by T-Mobile: phonenumber@metropcs.sms.us
Sprint: phonenumber@messaging.sprintpcs.com
T-Mobile: phonenumber@tmomail.net
Verizon: phonenumber@vtext.com
Virgin Mobile: phonenumber@vmobl.com
Example:
Phone number: 123-456-7890
Carrier: Verizon
Email format to use: 1234567890@vtext.com
Note: Some wireless carriers require adding a “1” in front of the number when formatting
the email address. If formatting the email address without the additional “1” fails to send
alert messages, try re-formatting the email address by adding the additional “1” in front
of the number.
Sferic Maps Alerting customers located in international (non-United States) locations will
need to contact their wireless carrier to determine the recommended email format for
setting up text messages by email.
7518 Setting Alert Silence Times
Sferic Maps Alerting customers can set alert silence times for any of the custom alert
rules by selecting Set Silence Times when creating or editing an alert rule at the bottom
of the page using Manage Rules. Silence times are created for each alert rule. There is
not currently a method allowing customers to set a silence time for all alert rules at
once.
Silence time hours are local to the time zone of the alert rule’s location, which may not
be the location from which the customer has signed into Sferic Maps Alerting to set alert
silence times.
Example 1: If a customer does not wish to receive alerts from 8 PM Monday evening
to 9 AM Tuesday morning, the customer would configure the following settings:
Note: Hours do not cross over to the next day. Due to the cross over in this example,
the silence times require two entries (one under each day). Each day is self-contained.
Example 2: If a customer does not wish to receive alerts at all on a particular day; the
silence time for that day would be set from 12 AM to 12 AM:
Example 3: If a customer does not wish receive alerts until 8 AM on weekdays and
does not wish to receive alerts from 7 PM until the following next morning, as well as no
alerts on the weekends, the customer would configure the following settings:
76You can also read