Use of Remote Sensing Data for Climate Monitoring in WMO Regions II and V (Asia and the South-West Pacific) - Prof Yuriy Kuleshov Australian ...
←
→
Page content transcription
If your browser does not render page correctly, please read the page content below
Use of Remote Sensing Data for Climate Monitoring
in WMO Regions II and V (Asia and the South-West Pacific)
                     Prof Yuriy Kuleshov
               Australian Bureau of Meteorology

                   For WMO TT-URSDCM

                         1 June 2017

                         Version 1.0

                                                            1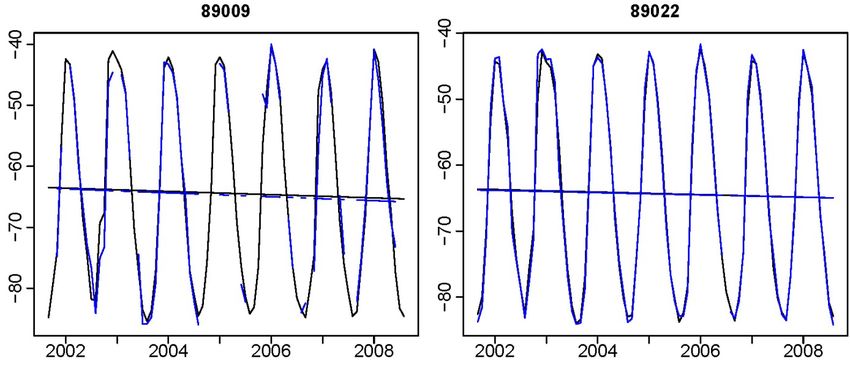
Table of Content

    1. Introduction and scope of this paper…………………………………………………..3
    2. Motivation for using remote sensing data for climatological applications……………3
   3. Encountered challenges………………………………………………………………..6
   4. Activities and experience of the Australian Bureau of Meteorology………………….8
    5. Activities and experience in the Asia-Pacific region……………………………..….11
    6. Summary……………………………………………………………………………..13
    7. Future work…………………………………………………………………………..14
    8. References……………………………………………………………………………15

List of Figures

Figure 1: Location of stations of the Australian Upper Air Network (red triangles) and a
  sample of distribution of GPS RO events (black dots) over the Australasian region for one
  day…………………………………………………………………………………………..5

Figure 2: Map of global lightning strikes for 1998-2013 obtained by OTD and LIS…...……7

Figure 3: Map of average annual lightning ground flash density in the Australian region, Ng
  (flashes km-2 yr-1)…………………………………………………………………………...9

Figure 4: Comparison of atmospheric temperature time series, with trend lines
  superimposed, for in situ 100 hPa RS data (black) and the corresponding GPS RO data
  (blue) at Amundsen-Scott (89009) and Halley (89022) stations…………..……………...10
Figure 5. Himawari’s 36 NMHS users in the Asia-Pacific region…………………………..12
Figure 6. Lightning activity detected over the Western Australia on February 13, 2017 by the
  LMI from FY-4a (left panel) and Western Australia rainfall totals on February 13, 2017
  (right panel)………………………………………………………………………………..12
Figure 7. Field of view from the FY-4A LMI for the Northern
  Hemisphere…...……………………………………………………………………...……13

                                                                                          2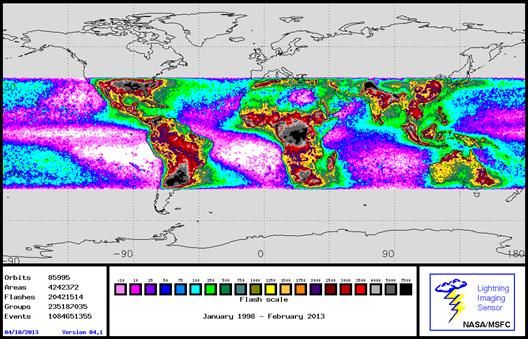
1. Introduction and scope of this paper

   This document provides the information about using remote sensing data for climate
applications in WMO Regions II and V (Asia and the South-Western Pacific).

   2. Motivation for using remote sensing data for climatological applications

        Conventional observations of meteorological variables (atmospheric pressure,
temperature and moisture, precipitation etc.) are collected daily at thousands of
meteorological stations around the world, to be used for weather analysis and forecasting.
Subsequent statistical analysis of the archived data over long-term period (decades and
longer) allows one to derive conclusions about climate (average state of weather) based on
instrumental records obtained at meteorological stations. Conventional observations are well
established and archives of meteorological variables recorded at many National
Meteorological and Hydrological Services (NMHSs) of Members go back for more than a
century. Such continuity of records is crucial for climatological applications, detection of
historical trends in meteorological variables etc. However, conventional records are restricted
to locations of meteorological stations.
       In modern time, data obtained by optical, infrared, radio- and micro-wave remote
sensing instruments revolutionised the science of meteorology and climatology as they
provide potentially global coverage and consequently improved access to areas which have
limited number of meteorological stations (data sparse areas) or not covered by conventional
observations at all. Remote sensing data complement conventional observations and are
widely used in numerical weather prediction, adding value to and improving skill of weather
forecasts etc. It is of particular importance in the Southern Hemisphere where weather
observation stations are much less in numbers than in the Northern Hemisphere. However,
remote sensing data are not fully utilised yet for climate monitoring and analysis. It is critical
for Members to utilise full potential of remote sensing data for climatological applications.
       In this paper, current status of using remote sensing (space- and surface-based) in
WMO Regions II and V (Asia and the South-West Pacific) for monitoring and analysis of
meteorological variables and producing climatologies is presented. Specifically, application
of remote sensing data and methodologies to producing lightning climatology, deriving
atmospheric temperature and moisture profiles and trends, and evaluating prospects of
producing precipitation climatology are presented.

       2.1. Lightning
          Lightning is a dangerous meteorological phenomenon that causes a number of
fatalities each year. A World Meteorological Organization (WMO) Commission for
Climatology international panel was convened to examine and assess the available evidence
associated with five weather-related mortality extremes included lightning. It was concluded
that highest mortality (indirect strike) associated with lightning occurred in Dronka, Egypt,
on 2 November 1994 when 469 people were killed in a lightning-caused oil tank fire [WMO
Assessment, 2017]. Lightning also causes significant economic losses related to considerable
damage to infrastructure in built-up regions, such as power lines etc., as well as damage to
the environment caused by ignition of forest fires. Consequently, lightning monitoring is

                                                                                                3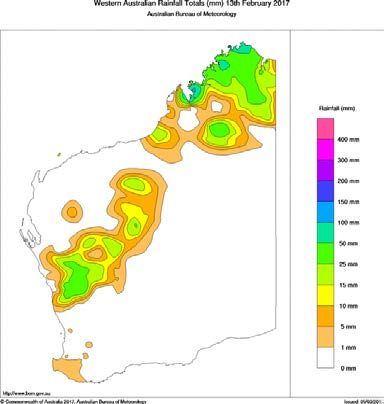
essential component of Climate Risk and Early Warning Systems (CREWS) and the best
available climatology of lightning activity is an important resource for government bodies,
industry, insurance agencies and emergency services.
        Historically, first instrumental records of lightning occurrences have been obtained by
ground-based lightning flash counters (LFCs) [Anderson et al., 1979; Mackerras and
Darveniza, 1994]. While ground-based LFCs can provide good coverage over time for
individual locations, they lack the wide spatial coverage provided by ground-based lightning
location systems (LLS) and satellite-based instruments.
        LLS instruments produce information about lightning strokes occurring within the
geographic bounds of a network of sensors [Betz et al., 2009; Pinto et al., 2007]. For
example, the National Lightning Detection Network (NLDN) produces reliable observations
of lightning occurrence throughout the whole of continental United States [Cummins et al.,
1998]. In some countries, national ground-based lighting detection networks have been
developed, to monitor lighting activity. Examples of well-established LLS in WMO Regions
III (South America), IV (North America, Central America and the Caribbean) and VI
(Europe) include BrazilDAT (https://www.earthnetworks.com/networks/brazil/), US NLDN
(http://www.vaisala.com/en/products/thunderstormandlightningdetectionsystems/Pages/NLD
N.aspx), and LINET (https://www.nowcast.de/en.html), respectively. Lightning data obtained
by LFCs and LLS are routinely used by NMHSs and other organizations of Members for
severe weather warning.
        Data from a global ground-based lightning location network WWLLN
(http://wwlln.net/) are also available [Rodger et al., 2004]; however it should be noted that
detection efficiency of the network is low (~10%) [Rudlosky and Shea, 2013].
         Long-term lightning records obtained by space-based instruments, Optical Transient
Detector (OTD) and Lightning Imaging Sensor (LIS), are valuable for estimating lightning
activities both regionally and globally [e.g., Christian, 1999].
        Recognising importance of monitoring of lighting activity and producing accurate
lightning climatology for numerous applications, a number of global, regional and national
maps of lightning occurrences have been prepared based on remote sensing data.

       2.2. Atmospheric temperature and moisture
       Temperature and moisture are among the key characteristics of the atmosphere.
Radiosondes (RS) are the primary operational source of upper air observations including
pressure, temperature and moisture. RS data are also commonly used for producing upper air
climatology and deriving conclusions about atmospheric temperature trends. This is in turn
used to verify outputs of climate models (e.g. models’ results which indicate warming of the
troposphere and cooling of the lower stratosphere due to impact of greenhouse gases).
        NMHSs of many Members use RS (various types of sensors) for their operations, and
historical RS data are available for several decades which make them suitable for producing
climatology. However, there are still a number of issues with accuracy of deriving
atmospheric characteristics (temperature and moisture) from RS data [e.g., Karl et al., 2006].
In addition, while the land is reasonably well covered by RS network, vast areas of the oceans
and remote areas (e.g. Antarctica, mountains etc.) are covered by a relatively small number of
stations.

                                                                                             4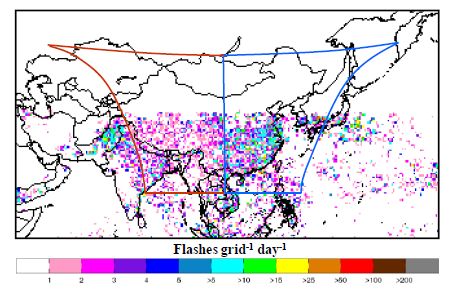
On the other hand, satellite-based measurements provide global coverage and
thousands of atmospheric pressure, temperature and moisture profiles could be obtained daily
over remote areas with limited conventional observations. A number of remote sensing
techniques are used for deriving atmospheric temperature and moisture profiles, including
infrared and microwave radiometry, and GPS radio occultation (RO). Using these remote
sensing techniques, large amount of upper air data is obtained daily. For example, GPS RO
data obtained by FORMOSAT-3/COSMIC mission provides approximately 2,500 daily GPS
RO events globally. This is a comparable amount of atmospheric profiles to those obtained
by the global RS network which has about 2,000 stations worldwide. As for WMO Region V,
for example, on average, the Australasian region obtains over 300 RO events daily (Figure 1)
which is about 10 times more than a number of atmospheric profiles that 38 Australian RS
stations provide [Kuleshov et al., 2016].

Figure 1: Location of stations of the Australian Upper Air Network and a sample of
  distribution of GPS RO events over the Australasian region for one day.

       Atmospheric temperature and moisture profiles derived using remote sensing are
routinely used in NWP models and proved to be useful to increase forecasting skill. Having
long term records of characteristics of the atmosphere obtained by space-based instruments
motivates to explore opportunities to use remote sensing data for producing upper air
climatology.

                                                                                          5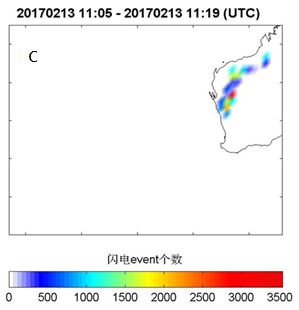
2.3. Precipitation
        Precipitation 1 (specifically, amount of rainfall) is conventionally recorded by rain
gauges. NMHSs of most of Members have established rain gauge networks, and long term
rainfall records are used for producing climatology. However, rainfall is highly variable, both
temporary and spatially, which results in substantial difficulties in preparing accurate
climatology.
        Radar data could be an alternative to gauge data for observation of precipitation, and
for producing climatology. NMHSs of many Members use weather radars for their
operational services. WMO Radar Database provides information about radars installed and
active in the following countries of WMO Region V: Australia (60), Brunei Darussalam (1),
Indonesia (34), Malaysia (12), New Zealand (9) and Singapore (1) (information retrieved
from http://wrd.mgm.gov.tr/db/search-country.aspx?l=en on 1 June 2017). It is possible that
some other countries in WMO Region V also have weather radars installed (e.g. at airports)
but they are not listed in the above mentioned database.
        Radar data could be considered as superior to rain gauge data with regards to
describing the spatio-temporal characteristics of rainfall (accumulated rainfall and rainfall
extremes). In addition, considering the high costs of maintenance of surface-based
meteorological stations, it is likely that the density of rain gauge network will decrease in the
future and radar data will play important role in providing complimentary information about
precipitation. However, a number of studies indicate that there are differences in radar
rainfall and continuous rain gauge accumulations, which means that in addition to blending
radar with gauge data, sophisticated bias correction schemes need to be developed.
Developing scientific methodologies for producing accurate precipitation climatology from
radar data is an important area of climate research.

      3. Encountered challenges

          3.1. Lightning
        Challenges in producing lightning climatology using remote sensing are mainly
related to accuracy of data obtained by different LFCs and LLS and therefore caution is
required when producing climatology. Australian examples are given below.
        In Australia, a network of about 40 LFCs is operated by the Australian Bureau of
Meteorology (ABM) and electric power companies - named the CIGRE-500 (Comité
Internationale des Grands Réseaux Electriques, that is, International Committee on Large
Electric Systems) as described by Anderson et al. [1979]. While CIGRE-500 LFCs detect
occurrence of lightning flashes with high accuracy, the detection radius is limited to 10-30
km, which makes these data suitable only for producing local climatologies.
        A LLS is also operated in Australia, by a commercial provider Global Position and
Tracking System Pty. Ltd. Australia (GPATS) and it covers the whole Australian continent.
In addition to providing broad spatial coverage, the GPATS data also provide high temporal
resolution, making them useful for applications such as examining individual case studies of
lightning activity. However, due to changes over time in GPATS detection efficiency for

1
    The main forms of precipitation include rain, snow, drizzle, sleet, graupel and hail.
                                                                                               6
various different locations throughout the Australian region, such as in relation to increasing
numbers of sensors being installed in recent years and upgrades to data processing methods,
such non-homogeneous data are not recommended for climatological examinations
[Kuleshov et al., 2011].
The above examples indicate that even if lightning data could be available in Member
country, producing accurate lightning climatology still could be a challenge.
As some Members may not have LFCs or LLS operated in their countries, use of
global satellite data could be recommended for producing lightning climatology. As an
example, a map of global lightning strikes for 1998-2013 in presented is Figure 2
(downloaded on 12 September 2016 from NASA website
http://thunder.msfc.nasa.gov/data/data_lis-otd-climatology.html). There are still some
limitations in these data, in terms of geographical coverage as well as detection of lightning
(as they are optical instruments, they detect total flashes, Nt, without separation between
intra-cloud/cloud-to-cloud, Nc, and cloud-to-ground, Ng). However, applying methodology to
relate Nt, Nc and Ng described by Kuleshov et al. [2006] it is possible to overcome some of
these challenges.
Figure 2: Map of global lightning strikes for 1998-2013 obtained by OTD and LIS.
3.2 Atmospheric temperature and moisture
Various space-based instruments (microwave, infrared etc.) for deriving atmospheric
temperature and moisture profiles have been developed over the past five decades.
Satellite-borne Microwave Sounding Unit (MSU) temperature measurements have
been obtained from the troposphere since 1979 when the instrument was included within
NASA weather satellites. However, there are no MSU observations polewards of 82.5
degrees from the NOAA polar orbiting satellites, and consequently temperature changes over
the near-polar area of Antarctica could not be analysed. In addition, intercalibration of MSU
data from various satellites is a challenge which has impact on accuracy of temperature
7retrieval. The Advanced Microwave Sounding Unit (AMSU) is a multi-channel microwave
radiometer installed on meteorological satellites from 1998. The most recent addition – the
Atmospheric Infrared Sounder (AIRS) – was launched in 2002, and together with AMSU
observes the entire atmosphere. AMSU and AIRS temperature and water vapour profiles are
available in real time to weather forecasters.
More recently, obtaining atmospheric profiles over the entire globe with high spatial
and temporal resolution became possible using emerging space-based technique – radio
occultation (RO) - which utilise radio signals of the Global Positioning System (GPS). Space
missions such as CHAMP, GRACE and COSMIC demonstrated usefulness of GPS RO for
deriving atmospheric profiles. GPS RO methodology provides all-weather capability, long-
term measurement stability, high vertical resolution and high-accuracy measurements in the
middle to upper troposphere, stratosphere and ionosphere [e.g. Rocken et al., 1997].
Advanced retrieval algorithms have been developed (e.g. open loop technique etc.) and
accuracy of GPS RO temperature and moisture retrieval has been verified using collocated
RS data. It has been demonstrated that accuracy of temperature retrieval from GPS signals
could be comparable with (or even surpass) accuracy of RS measurements.
3.3. Precipitation
For a comprehensive description of Precipitation, refer to ‘Use of Weather Data for
Climate Data Records in WMO Regions IV and VI’ by L. Keupp, T. Winterrath and R.
Hollmann (3 February 2017).
4. Activities and experience of the Australian Bureau of Meteorology
4.1. Lightning climatology
Long-term lightning data obtained by ground-based LFCs CIGRE-500 and CGR3,
and by NASA satellite-based instruments OTD and LIS have been used by ABM to develop
the first Australian maps of total lightning flash density, Nt, (i.e. cloud-to-ground and intra-
cloud) and of ground flash density, Ng. [Kuleshov et al., 2006], to include the developed
lighting climatology in Australian Standard ‘Lightning Protection [Standards Australia,
2007]. The lightning climatology has been subsequently updated using additional years of
data (Figure 3; Dowdy and Kuleshov, 2014). The peak lightning occurrence is in the north-
western part of the Australian continent with ground flash density (Ng) values varying from
over 6 km-2yr-1 in the northern parts of Australia to about 1 km-2yr-1 and below in the southern
parts. There are significant seasonal and yearly variations in the frequency of lightning flash
density.
The updated lightning climatology for Australia is the most comprehensive to date to
has been developed for this region, with the study period from 1995 to 2012. The use of a
nearly 20 years of data provides a considerably improved degree of confidence in the
climatology, with a reduced influence of features associated with short-term temporal
variability and large-scale modes of variability such as the El Niño-Southern Oscillation
(ENSO). It also allows improved confidence for examining smaller portions of the lightning
climatology (such as for the warm and cool seasons individually) and for examining regions
of very low lightning activity (such as some of the maritime regions near the Australian
continent). The updated lightning climatology is recommended for inclusion in such
applications as a current revision of the Australian / New Zealand standard “Lightning
Protection”, as well as being suitable for use in a range of different applications such as for
8use by insurance agencies and electrical power generators and distributors, as well as by
emergency management authorities such as in relation to forest fires ignited by lightning.
Figure 3: Map of average annual lightning ground flash density in the Australian region, Ng
(flashes km-2 yr-1).
This approach of producing lightning climatology using data from space-based
instruments (e.g. OTD and LIS, as well as a new instrument – Lightning Mapping Imager,
see section 5 for detail) could be recommended to Members which have no ground-based
lightning location networks in their countries.
4.2 Atmospheric temperature and moisture trends
Deriving accurate trends in characteristics of the atmosphere is one of the
fundamental tasks of climatology. Based on a large volume of scientific evidence including
surface- and space-based observations, IPCC provides statements about climate change, as
well as climate projections. The latest IPCC Fifth Assessment Report (AR5) states that
“Warming of the atmosphere and ocean system is unequivocal” [IPCC AR5, 2013]. Remote
sensing data play important role in estimating historical trends, globally and regionally (e.g.
rapid warming of the Polar Regions in recent decades which exceeds rate of global warming
is well documented, thanks to satellite observations). An example of using remote sensing
data at ABM to advance climatology for the data sparse area such as the Antarctic is given
below.
To investigate recent atmospheric temperature trends over the Antarctic, time series of
the collocated GPS RO and RS data were examined at nine standard pressure level for the
seven stations.
First, verification of accuracy of remote sensing data against conventional RS data
was performed. It was found that at all seven stations and all nine pressure levels the
9collocated GPS RO temperatures are generally in good agreement with the corresponding in
situ RS temperatures, in terms of both the actual values and the seasonal cycle (Figure 4).
Then linear trends have been estimated from the collocated GPS RO and RS
temperature series. Strong lower-stratospheric cooling trends have been identified at all levels
from 50 to 300 hPa, with the 7-station-mean stratospheric cooling rates at 100 hPa pressure
level is about -3.2°C (or -3.5°C) per decade from the collocated GPS RO (or RS) data,
respectively [Kuleshov et al., 2016]. In the troposphere (at levels below 300 hPa) both
cooling and warming trends are detected at different stations depending on their geographical
location. For example, for the stations in the Western Antarctica, GPS RO data indicate
warming trends in the upper troposphere at 500 hPa and 700 hPa pressure levels, in
agreement with finding of earlier studies about rapid near-surface warming [Vaughan et al.,
2001].
The derived results are also in agreement with outputs of climate models which
indicate that recent stratospheric cooling and tropospheric warming are expected
consequences of the observed increase in anthropogenic greenhouse gas concentrations
[IPCC AR5, 2013].
Figure 4. Comparison of atmospheric temperature time series, with trend lines superimposed,
for in situ 100 hPa RS data (black) and the corresponding GPS RO data (blue) at
Amundsen-Scott (89009) and Halley (89022) stations.
These findings demonstrate that GPS RO measurements could significantly advance
producing accurate climatology for data sparse areas. It could be recommended to NMHSs of
Members which have limited RS datasets, to explore an opportunity of utilising GPS RO data
for producing upper air climatology for their country / region.
4.3. Precipitation climatology
While weather radar data have been extensively used at ABM for decades for
observation of precipitation and nowcasting, their use for climate applications has begun only
recently, mainly through research projects [Griesser et al., 2015].
10For example, the Coastal Convective Interactions Experiment (CCIE) has been
focused on quantifying hailstorm hotspot activity for the coastal Southeast Queensland (SEQ)
region of Australia and understanding the meteorological conditions which result in the
spatial clustering of hailstorm activity. An automated thunderstorm identification and
tracking technique has been applied to 18 years of radar data and the hailstorm hotpots in the
region have been identified [Soderholm et al., 2015].
There are plans to develop precipitation climatology for the greater Sydney region
based on a mosaic of radars. Currently, a pilot project on developing a 5-year climatology has
been completed. In principle, the developed climatology could be extended to 10 years;
however, some issues with quality of archived data including changes in formatting and
algorithms have to be resolved (D. Jakob, A. Protat; personal communication, September
2016).
5. Activities and experience in the Asia-Pacific region
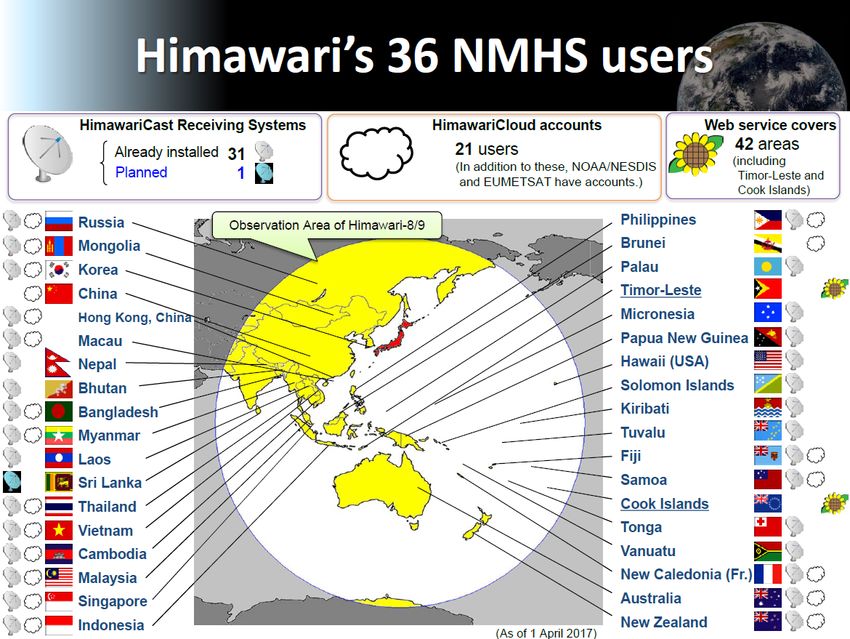
The launch of Himawari-8 on 7 October 2014 marked the start of the replacement of
the global system of geostationary satellites with a new generation of satellites offering
unprecedented capabilities. Its primary instrument, the Advanced Himawari Imager (AHI), is
a 16 channel multispectral instrument to produce full-disk visible and infrared images of the
Asia-Pacific region. Himawari-8 entered operational service on 7 July 2015 and it contributes
significantly to improving the performance of NMHSs in the region for high-quality weather
forecasting and climate monitoring.
The new satellite also brings major challenges for the users due to a large increase
(about 50 times) in data that it delivers compared to the previous satellite. Japan
Meteorological Agency (JMA) puts a lot of efforts in assisting the meteorological centres in
the Asia-Pacific region (Figure 5) with transition from MTSAT-2 to Himawari-8. Thanks to
the HimawariCast project led by WMO and the JMA, 14 countries in the Asia-Pacific can
now access vital meteorological data from the Himawari-8 satellite [WMO News, 2017].
Availability of Himawari-8 data and products will benefit Members of WMO Regions II and
V including improved monitoring of weather and climate extremes.
The first Chinese new-generation geostationary meteorological satellite Feng-Yun-4A
(FY-4A) has been launched on December 11, 2016, with a number of advanced
meteorological instruments including an instrument for lightning detection – Lightning
Mapping Imager (LMI) [Cao et al., 2014]. Currently, FY-4A is under commissioning test and
the satellite’s handover to operational services is expected by the end of June 2017.
Similar to OTD and LIS of NASA satellites, FY-4A LMI is an optical detector and it
will generate Level 2 lightning products (flashes, groups, events) from Level 1c geo-located,
time tagged lightning event data. The National Satellite Meteorological Center, China
Meteorological Administration (CMA), is currently conducting evaluation of performance of
LMI. Initial tests indicate high detection efficiency of the instrument - see an example of
detecting lightning activity over the Western Australia on February 13, 2017 (Figure 6).
Ability to detect lightning from a geostationary satellite during day and night will
significantly improve monitoring of storms on continual basis. Field of view (FOV) from FY-
4A LMI for the Northern Hemisphere is presented in Figure 7. The FOV is superimposed on
11one month (July 2008) of lightning observations from LIS (adopted from Cao et al., 2014).
Lightning detection data for storm monitoring in the Northern Hemisphere will be available
during the months from April to November, and in the Southern Hemisphere – from
December to March. Availability of FY-4A LMI lightning products will benefit Members of
WMO Regions II and V, particularly those which do not have well established networks of
LFCs and LLS.
Figure 5. Himawari’s 36 NMHS users in the Asia-Pacific region.
Figure 6. Lightning activity detected over the Western Australia on February 13, 2017 by the
LMI from FY-4a (left panel) and Western Australia rainfall totals on February 13, 2017
(right panel).
12Figure 7. Field (FOV) of view from the FY-4A LMI for the Northern Hemisphere.
6. Summary
Increasing importance of using remote sensing data for climate applications is well
recognised by Members. Recommendations produced in this report by WMO Task Team on
Use of Remote Sensing Data for Climate Monitoring (TT-URSDCM) are concerned with
three aspects, namely producing lightning climatology, precipitation climatology, and
deriving atmospheric temperature and moisture trends.
Space- and ground-based optical and radio instruments provide long-term records of
lightning activity, globally, regionally and nationally, and lightning climatology has been
produced in many countries helping Members to fulfil their mandates and contribute to
improving protection of life, property and environment from hazards associated with
lightning and severe thunderstorms. In this report, the Task Team provides recommendations
for using satellite remote sensing data to monitor lightning activity and produce lightning
climatology, which could be used by Members not having national lightning detection
networks.
GPS RO technique has been recognized as an emerging technique for Earth’s
atmospheric observation. Atmospheric profiles derived from GPS RO observations provide
valuable information about state of the atmosphere over the oceans where upper air data from
conventional meteorological observations are particularly scarce. With the recent GPS
modernization and new global and regional Global Navigation Satellite Systems (GNSS) in
the near future, next generation RO missions will have opportunity and capability to utilise
signals (in over ten different frequencies) from more than a hundred of GNSS satellites. As a
consequence, the resolution, quantity and quality of the GNSS RO observations will be
improved significantly and the data will have significant impact on various meteorological
and climatological applications. Valuable information derived from GNSS RO atmospheric
13profiles would be utilised to improve accuracy of weather forecasting. It is equally important
for Members to use data from GNSS ground-based stations and space-based observations for
climate studies, to derive accurate climatology of atmospheric temperature and moisture
which could assist with realistic estimations of trends in the atmospheric characteristics and
improving our understanding of the regional climate processes.
While precipitation climatology derived from weather radar data has been produced
to date in a small number of countries, these results are encouraging as they clearly
demonstrate value of such climate products. The Task Team recommends Members to further
expand such efforts, advancing methodologies for re-calibration of radar data, bias correction,
radar-gauge adjustments, data homogenization etc.
Availability of data and products from new generation geostationary satellites
Himawari-8 and FY-4A will benefit Members of WMO Regions II and V including improved
monitoring of weather and climate extremes.
7. Future work
Recognising importance to assist Members, especially in developing and least
developed countries, with using remote sensing data for weather and climate extremes
monitoring it is suggested for the WMO Task Team on the Use of Remote Sensing Data for
Climate Monitoring (TT-URSDCM) to incorporate in the team’s future tasks assistance with
implementation of recommendations of the Space-based Weather and Climate Extremes
Monitoring (SWCEM) workshop organized by WMO in February 2017.
Following the workshop’s recommendation, the 69th WMO Executive Council (EC-
69) in May 2017 made a decision to support a demonstration project on space-based weather
and climate extremes monitoring (SEMDP) starting in 2018 for a two year duration. It is
envisaged to designate a couple of WMO Regional Climate Centres (WMO RCCs) for the
SEMDP and to initially confine the project to space-based monitoring of continual heavy
precipitation events and droughts in short duration on pentad or weekly up to monthly basis.
The Australian Bureau of Meteorology (AuBoM) and the Indonesian Agency for
Meteorology, Climatology and Geophysics (Badan Meteorologi, Klimatologi, dan
Geofisika or simply BMKG) which are contributors to activities of the WMO RCCs in the
Asia-Pacific region (the South-East Asia (SEARCC-Network) and the Pacific Island
Countries and Territories (PIRCC-Network), respectively; both RCCs are in demonstration
phase) expressed their strong support and commitment to work on SEMDP in the Asia-
Pacific region.
In addition to expertise of members of TT-URSDCM, it is suggested to invite other
potential experts to assist with drafting the SEMDP Implementation Plan. The following
experts – participants of the SWCEM workshop – may provide valuable contribution to this
task:
Ralph Ferraro (NOAA/NESDIS; CGMS IPWG)
Ali Behrangi (NASA/JML; WCRP/ETCCDI)
Pingping Xie (NOAA/NWS/CPC)
Riris Adriyanto (BMKG, Indonesia)
148. References
Anderson, R. B., H. R. van Niekerk, S. A. Prentice, and D. Mackerras, 1979: Improved
Lightning Flash Counter, Electra, 66, 85-98.
Betz, H. D., U. Schumann and P. Laroche (Eds), 2009: Lightning: Principles, Instruments and
Applications, Springer Science + Business Media B.V., 641 p.
Cao, D, F. Huang and X. Qie, 2014: Development and evaluation of detection algorithm for
FY-4 geostationary lightning imager (GLI) measurement, Proc. XV International
Conference on Atmospheric Electricity, 15-20 June 2014, Norman, Oklahoma, USA.
Christian, H. J., 1999: Optical Detection of Lightning from Space, Proceedings of the 11th
International Conference on Atmospheric Electricity, Guntersville, Alabama, June 7-
11, 1999, pp. 715-718
Cummins, K. L., E. P. Krider, and M. D. Malone, 1998: The U.S. National Lightning
Detection Network and Applications of Cloud-to-Ground Lightning Data by Electric
Power Utilities, IEEE Transactions on Electromagnetic Compatibility, 40(4), 465-
480.
Dowdy, A.J., and Y. Kuleshov, 2014: Climatology of lightning activity in Australia: spatial
and seasonal variability, Australian Meteorological Oceanographic Journal , 6, 9-14.
Griesser, A., A. Seed and D. Jakob, 2015: Evaluating spatio-temporal characterisitcs of
downscaled rainfall extremes using blended radar/gauge data, CAWCR Report,
Bureau of Meteorology, Melbourne, Australia, 69 pp.
IPCC AR5, 2013: Working Group I Contribution to the IPCC Fifth Assessment Report
Climate Change 2013: The Physical Science Basis. Summary for
Policymakers,http://www.climate2013.org/images/uploads/WGI_AR5_SPM_brochure
.pdf.
Karl, T. R., S. Hassol, C. Miller, and W. Murray, Eds., 2006: Temperature Trends in the
Lower Atmosphere: Steps for Understanding and Reconciling Differences. U.S.
Climate Change Science Program, Synthesis and Assessment Report 1.1, 164 pp.
Kuleshov, Y., D. Mackerras, and M. Darveniza, 2006: Spatial distribution and frequency of
lightning activity and lightning flash density maps for Australia, J. Geophys. Res.,
111, D19105, doi:10.1029/2005JD006982.
Kuleshov, Y., P. Hettrick, D. Mackerras, M. Darveniza, and E.R. Jayaratne, 2011:
Occurrence of positive and negative polarity cloud-to-ground lightning flashes: case
study of CGR4 and GPATS data for Brisbane, Australia, Australian Meteorological
and Oceanographic Journal, 61/2, 107-112.
Kuleshov, Y., S. Choy, E. F. Fu, F. Chane-Ming, Y-A. Liou and A. G. Pavelyev, 2016:
Analysis of Meteorological Variables in the Australasian Region Using Ground- and
Space-based GPS Techniques, Atmospheric Research, 176–177 (2016) 276–289,
doi:10.1016/j.atmosres.2016.02.021
Mackerras, D., and M. Darveniza, 1994: Latitudinal variation of lightning occurrence
characteristics, J. Geophys. Res., 99, 10,813-10,821.
Pinto Jr., O., I. R. C. A. Pinto, and K. P. Naccarato, 2007: Maximum cloud-to-ground
lightning flash densities observed by lightning location systems in the tropical region:
A review, Atmos. Res., 84, 189-200.
15Rudlosky S. D., and D. T. Shea, 2013: Evaluating WWLLN performance relative to
TRMM/LIS. Geophy. Res. Lett., 40, 2344–2348, doi:10.1002/grl.50428.
Rocken C., R. Anthes, M. Exner, D. Hunt, S. Sokolovskiy, R. Ware, et al., 1997: Analysis
and validation of GPS/MET data in the neutral atmosphere. J. Geophys. Res., 102,
29849-29866.
Rodger, C. J., J. B. Brundell, R. L. Dowden, and N. R. Thomson, 2004: Location accuracy of
long distance VLF lightning location network. Ann. Geophys., 22, 747–758,
doi:10.5194/angeo-22-747-2004.
Soderholm, J., H. McGowan, H. Richter, K. Walsh, T. Weckwerth, and M. Coleman, 2015:
The Coastal Convective Interactions Experiment (CCIE): Understanding the role of
sea breezes for hailstorm hotspots in Eastern Australia, BAMS,
doi: http://dx.doi.org/10.1175/BAMS-D-14-00212.1 (Published Online: 18 December
2015)
Standards Australia, 2007: Lightning Protection - Australian Standard/New Zealand Standard
1768:2007, 199pp, Sydney, Australia and Standards Association of New Zealand,
Wellington, New Zealand.
Vaughan, D. G., G. J. Marshall, W. M. Connolley, J. C. King, and R. Mulvaney, 2001:
Climate change: Devil in the detail. Science, 293, 1777-1779,
doi:10.1126/science.1065116.
WMO Assessment, 2017: WMO Assessment of Weather and Climate Mortality Extremes:
Lightning, Tropical Cyclones, Tornadoes, and Hail,
DOI: http://dx.doi.org/10.1175/WCAS-D-16-0120.1
WMO News, 2017: Himawari-8 satellite data addresses Asia-Pacific disaster risk; retrieved
from https://public.wmo.int/en/media/news/himawari-8-satellite-data-addresses-asia-
pacific-disaster-risk
16You can also read


