Prediction of Asthma Hospitalizations for the Common Cold Using Google Trends: Infodemiology Study
←
→
Page content transcription
If your browser does not render page correctly, please read the page content below
JOURNAL OF MEDICAL INTERNET RESEARCH                                                                                                      Sousa-Pinto et al

     Original Paper

     Prediction of Asthma Hospitalizations for the Common Cold Using
     Google Trends: Infodemiology Study

     Bernardo Sousa-Pinto1,2, MD, PhD; Jaana I Halonen3, PhD; Aram Antó4, MSc; Vesa Jormanainen3, MD; Wienczyslawa
     Czarlewski4,5,6, PhD; Anna Bedbrook4,6, BSc; Nikolaos G Papadopoulos7,8, PhD; Alberto Freitas1,2, PhD; Tari Haahtela9,
     MD; Josep M Antó10,11,12,13, PhD; João Almeida Fonseca1,2, MD, PhD; Jean Bousquet6,14,15,16, PhD
     1
      MEDCIDS – Department of Community Medicine, Information and Health Decision Sciences; Faculty of Medicine, University of Porto, Porto, Portugal
     2
      CINTESIS – Center for Health Technology and Services Research; University of Porto, Porto, Portugal
     3
      Finnish Institute for Health and Welfare (THL), Helsinki, Finland
     4
      MASK-air, Montpellier, France
     5
      Medical Consulting Czarlewski, Levallois, France
     6
      MACVIA-France, Montpellier, France
     7
      Allergy Department, 2nd Pediatric Clinic, Athens General Children’s Hospital “P&A Kyriakou”, University of Athens, Athens, Greece
     8
      Division of Infection, Immunity & Respiratory Medicine, Royal Manchester Children’s Hospital, University of Manchester, Manchester, United
     Kingdom
     9
      Skin and Allergy Hospital, Helsinki University Hospital, and University of Helsinki, Helsinki, Finland
     10
          ISGlobal, Barcelona Institute for Global Health, Barcelona, Spain
     11
          Universitat Pompeu Fabra, Barcelona, Spain
     12
          IMIM - Hospital del Mar Medical Research Institute, Barcelona, Spain
     13
          CIBER Epidemiología y Salud Pública - CIBERESP, Barcelona, Spain
     14
          Charité, Universitätsmedizin Berlin, Humboldt-Universität zu Berlin, Berlin, Germany
     15
          Comprehensive Allergy Center, Department of Dermatology and Allergy, Berlin Institute of Health, Berlin, Germany
     16
          University Hospital, Montpellier, France

     Corresponding Author:
     Bernardo Sousa-Pinto, MD, PhD
     MEDCIDS – Department of Community Medicine, Information and Health Decision Sciences; Faculty of Medicine, University
     of Porto
     Rua Dr. Plácido da Costa s/n
     Porto
     Portugal
     Phone: 351 225513600
     Email: bernardosousapinto@protonmail.com

     Abstract
     Background: In contrast to air pollution and pollen exposure, data on the occurrence of the common cold are difficult to
     incorporate in models predicting asthma hospitalizations.
     Objective: This study aims to assess whether web-based searches on common cold would correlate with and help to predict
     asthma hospitalizations.
     Methods: We analyzed all hospitalizations with a main diagnosis of asthma occurring in 5 different countries (Portugal, Spain,
     Finland, Norway, and Brazil) for a period of approximately 5 years (January 1, 2012-December 17, 2016). Data on web-based
     searches on common cold were retrieved from Google Trends (GT) using the pseudo-influenza syndrome topic and local language
     search terms for common cold for the same countries and periods. We applied time series analysis methods to estimate the
     correlation between GT and hospitalization data. In addition, we built autoregressive models to forecast the weekly number of
     asthma hospitalizations for a period of 1 year (June 2015-June 2016) based on admissions and GT data from the 3 previous years.
     Results: In time series analyses, GT data on common cold displayed strong correlations with asthma hospitalizations occurring
     in Portugal (correlation coefficients ranging from 0.63 to 0.73), Spain (ρ=0.82-0.84), and Brazil (ρ=0.77-0.83) and moderate
     correlations with those occurring in Norway (ρ=0.32-0.35) and Finland (ρ=0.44-0.47). Similar patterns were observed in the

     https://www.jmir.org/2021/7/e27044                                                                        J Med Internet Res 2021 | vol. 23 | iss. 7 | e27044 | p. 1
                                                                                                                             (page number not for citation purposes)
XSL• FO
RenderX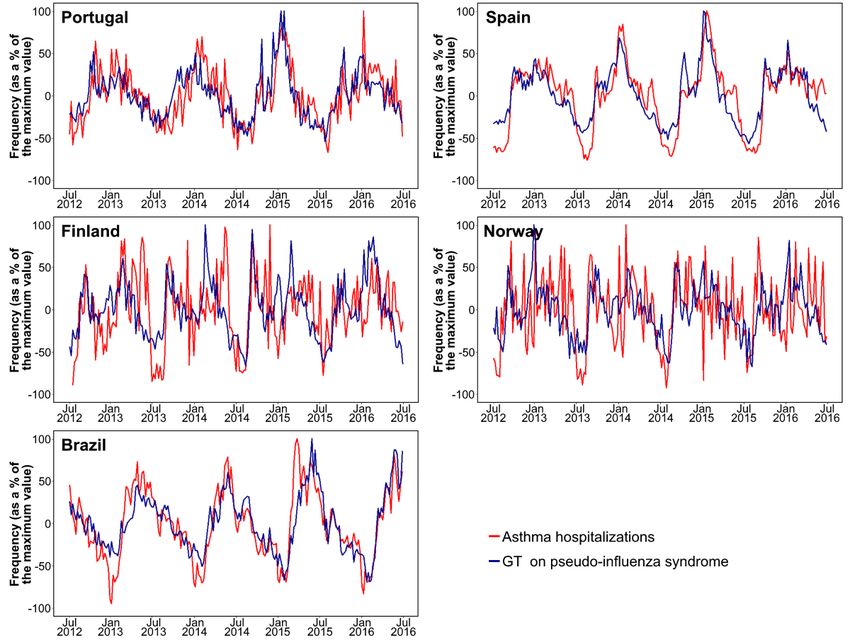
JOURNAL OF MEDICAL INTERNET RESEARCH                                                                                        Sousa-Pinto et al

     correlation between forecasted and observed asthma hospitalizations from June 2015 to June 2016, with the number of forecasted
     hospitalizations differing on average between 12% (Spain) and 33% (Norway) from observed hospitalizations.
     Conclusions: Common cold–related web-based searches display moderate-to-strong correlations with asthma hospitalizations
     and may be useful in forecasting them.

     (J Med Internet Res 2021;23(7):e27044) doi: 10.2196/27044

     KEYWORDS
     asthma; common cold; Google Trends; hospitalizations; time series analysis; mobile phone

     Introduction                                                        Methods
     Background                                                          Study Design
     Asthma poses a substantial burden on health care, with              We conducted an infodemiology study to (1) correlate GT on
     hospitalizations being one of the main drivers of asthma-related    rhinovirus-related search terms with asthma hospitalizations
     costs [1]. The prediction of asthma hospitalization patterns may    for a period of approximately 5 years (2012-2016) in Portugal,
     take into account major risk factors for asthma exacerbations,      Spain, Finland, Norway, and Brazil and (2) assess whether such
     such as occurrence of the common cold (most often due to            GT, along with previous admissions, were able to predict asthma
     rhinovirus infections) [2-4], air pollution, and pollen exposure.   hospitalizations. This study complies with the methodological
     However, although air pollution and pollen peaks can be             framework of Mavragani and Ochoa [12].
     measured (allowing for alert systems to be developed), data on
     rhinovirus infections are more difficult to obtain and thus to be
                                                                         Queries and Data Sources for GT for
     incorporated into prediction models.                                Rhinovirus-Related Search Terms
                                                                         GT topics are groups of search terms that concern the same
     Infodemiology data open new possibilities for the development
                                                                         concept, irrespective of their language [9,12-14]. This is
     of models predicting asthma hospitalizations. Infodemiology
                                                                         particularly relevant, as there are countries with several words
     is defined as “the science of distribution and determinants of
                                                                         and idioms referring to the common cold (a paradigmatic
     information in an electronic medium, specifically the Internet,
                                                                         example is Spain, a country with five official and co-official
     or in a population, with the ultimate aim to inform public health
                                                                         languages) as well as others with ambiguous words referring
     and public policy” [5,6]. Infodemiology comprises supply-based
                                                                         to the common cold (eg, English-speaking countries, in which
     and demand-based approaches, with the latter including the
                                                                         cold has a double meaning). Assessing data from several
     analysis of web-based searches to assess individuals’
                                                                         countries, we found that common cold was listed as a
     health-seeking behavior [6]. Google Trends (GT) is one of the
                                                                         pseudo-influenza syndrome topic (this topic was renamed as
     most frequently used tools to assess trends in web-based
                                                                         common cold at the time of manuscript submission).
     searches. This Google service displays the relative volume of
     searches for which a keyword (or set of keywords) is entered        We then retrieved country-level GT on rhinovirus-related search
     into the Google search engine [7]. Web-based searches on            terms from January 1, 2012, to December 17, 2016, in Portugal,
     asthma and related terms have been assessed in previous studies     Spain, Finland, Norway, and Brazil. The countries were selected
     [8,9]. However, GT for the search term asthma [7] only allows       according to the possibility of having nationwide weekly asthma
     for the easy identification of large outbreaks (such as             hospitalization data available for comparison. To provide a
     thunderstorm-induced asthma) [10] or media coverage–driven          wider perspective, we plotted GT patterns for the
     search peaks [11]. In fact, seasonal variations in pollen           pseudo-influenza syndrome topic, not only in these 5 countries,
     concentrations, which influence the occurrence of asthma            in which asthma hospitalizations were also assessed, but also
     exacerbations, are not reflected in GT for asthma [9]. However,     in 11 additional countries.
     to date, no study has examined the relationship between GT for
                                                                         The assessed time frame was selected considering both GT and
     common cold, the major risk factor for asthma exacerbations,
                                                                         asthma hospitalization data. On the one hand, for periods longer
     and asthma hospitalizations.
                                                                         than 5 years, GT data are presented on a monthly level rather
     Objectives                                                          than on a weekly level (with monthly intervals being
     In this study, we aim to assess whether asthma hospitalizations     insufficiently sensitive for assessing variations in asthma
     could be predicted by GT along with data from previous hospital     hospitalizations). On the other hand, a complete period of 5
     admissions. To do so, we aim (1) to assess and discuss GT for       years was not assessed (with the last 2 weeks of December 2016
     common cold in different countries of the world, (2) to correlate   not being assessed) on account of available asthma
     GT for common cold and hospitalization data, and (3) to build       hospitalization data (see the subsection Asthma Hospitalization
     models forecasting asthma hospitalizations for a period of 1        Data Sources).
     year (based on GT and past hospitalization data), correlating       For each country, we tested two different GT queries: (1) one
     observed and predicted asthma hospitalizations.                     consisting of the pseudo-influenza syndrome topic, and (2)
                                                                         another being a combination of search terms consisting of words
                                                                         for common cold (selected on discussion with native speakers

     https://www.jmir.org/2021/7/e27044                                                          J Med Internet Res 2021 | vol. 23 | iss. 7 | e27044 | p. 2
                                                                                                               (page number not for citation purposes)
XSL• FO
RenderX
JOURNAL OF MEDICAL INTERNET RESEARCH                                                                                          Sousa-Pinto et al

     of each language). The search term combinations were as              Statistical Analysis
     follows:                                                             In brief, we performed two major types of analyses. First, we
     •    Portugal: constipação + resfriado                               assessed the correlations between GT data and asthma
     •    Spain: resfriado + resfrío + catarro + constipado + refredat    hospitalizations in each country after applying time series
          + constipate + arrefriado + hotzeri                             analysis methods. Subsequently, we built models forecasting
     •    Finland: flunssa + nuha + vilustuminen                          asthma hospitalizations for a period of 1 year based on GT and
     •    Norway: forkjølelse + forkjøling + snue + krimsjuke             hospitalization data from the previous 3 years. To test for the
     •    Brazil: resfriado                                               predictive ability of the models, forecasted and observed asthma
                                                                          admissions were compared. Both GT and hospitalization data
     Quotation marks were not used because each keyword consisted         were presented weekly. The performance of analysis on a
     of a single word. Misspellings or nonaccentuated forms were          weekly basis allowed for the detection of short-term variations
     not included in the search term combinations. In Portugal, the       without the large random fluctuations that can be observed when
     words without diacritical marks (ie, constipacao or constipaçao)     data are analyzed on a daily basis.
     have a much lower relative volume of searches (with many
     zero-value observations) than the correct word constipação,          In detail, we calculated Pearson correlation coefficients to assess
     with identical relative search volumes being observed whenever       the correlation between GT data and asthma hospitalizations in
     misspelled words are or are not included in search term              each country. In addition, we performed cross-correlation
     combinations. In Spain, identical relative search volumes are        analysis because (1) for GT data, a relevant trend is expected,
     also observed, whether or not the misspelled word resfrio is         mirroring an increase in Google searches with the passing of
     included in search term combinations. In Norway, the misspelled      years, and (2) GT results are expressed as relative search values
     variants forkjolelse and forkjoling generate negligible results      (ie, percentages in relation to the maximum observed value of
     (ie, all observations with a relative search volume of zero).        the whole period), whereas hospitalizations are expressed as
                                                                          absolute values. The time series can be decomposed into three
     State-level analyses were also performed in Spain and Brazil.        components: trend, seasonal effects, and random errors. We
     For Spain, we performed separate analyses for the three most         removed the trend component for both GT and hospitalization
     populous autonomous communities (Andalusia, Catalonia, and           data and then estimated cross-correlation coefficients between
     Madrid). For Brazil, we separately analyzed data from the most       GT and hospitalization data of the same week and with different
     populous state in three of the five Brazilian geographical regions   week lags (namely, with 1, 2, 3, and 4 weeks of difference
     (as defined by the Brazilian Institute of Geography and              between GT data and hospitalization data, to assess whether
     Statistics): São Paulo (Southeast), Rio Grande do Sul (South),       search volumes displayed better correlation with asthma
     and Bahia (Northeast). For the two other geographical regions        hospitalizations occurring in subsequent weeks than with those
     (North and Central-West), the most populous states had               occurring in the same week).
     low-quality GT data (with many weeks recorded as 0).
                                                                          We built seasonal autoregressive integrated moving average
     GT was accessed via its web interface. Categories and                (ARIMA) models to forecast variations in asthma
     subcategories were not selected in our searches. GT data sources,    hospitalizations over a period of 1 year. We started in the
     other than web searches, have not been used. Searches and data       Northern Hemisphere Summer of 2015 (week of June 21, 2015)
     extraction were performed on January 13, 2020, with a single         and based our models on the trend component of asthma
     data extraction for each country.                                    hospitalizations and on GT data from the 3 previous years
     Asthma Hospitalization Data Sources                                  (weeks of July 1, 2012-June 14, 2015). Seasonal ARIMA models
                                                                          are defined by the parameters (p, d, q)(P, D, Q)s, where p
     In the 5 studied countries, we assessed all hospitalizations with
     asthma as the main diagnosis (ie, International Classification       corresponds to the order of autoregression, d is the degree of
     of Diseases, Ninth Revision, Clinical Modification code 493.x        difference, q is the order of the moving average part, P is the
     or International Classification of Diseases, Tenth Revision, code    seasonal order of autoregression, D is the seasonal integration,
     J45) occurring in public hospitals from January 1, 2012, to          Q is the seasonal moving average, and s is the length of the
     December 17, 2016 (the last 2 weeks of 2016 were not included,       seasonal period [11,15]. We applied seasonal ARIMA
     as we did not have any information on 2017 Portuguese and            (3,0,2)(0,1,1)52 models. Such models were chosen, among others
     Brazilian discharges, and many patients admitted at the end of       with p=3 or p=4 (as suggested by the time series autocorrelation
     2016 were discharged in 2017). Hospitalization data were             function plots) and with other parameters, on account of their
     retrieved from (1) the Hospital Morbidity database (provided         lower corrected Akaike information criteria and nondetection
     by the Portuguese Central Administration of the Healthcare           of correlated residuals (both as assessed by the Ljung-Box test
     System) for Portugal, (2) the Hospital Morbidity Survey              and by the autocorrelation function plots, with no significant
     databases (Encuesta de morbilidad hospitalaria, Instituto            spikes being observed). Asthma hospitalizations and GT data
     Nacional de Estadistica) for Spain, (3) the National Hospital        from July 2012 to June 2015 were used as a training set, with
     Discharge Register (Hoitoilmoitusrekisteri, HILMO) for Finland,      hospitalizations between the weeks of June 21, 2015, and June
     (4) the Norwegian Patient Registry (Norsk Pasientregister) for       19, 2016 being forecasted based on observed GT for that period.
     Norway, and (5) DATASUS data from the Single Health System           The predictive ability of the models was assessed by calculating
     (Sistema Único de Saúde) for Brazil.                                 (1) the correlation coefficients between the predicted variation
                                                                          in hospitalizations and the observed trend in hospitalizations

     https://www.jmir.org/2021/7/e27044                                                            J Med Internet Res 2021 | vol. 23 | iss. 7 | e27044 | p. 3
                                                                                                                 (page number not for citation purposes)
XSL• FO
RenderX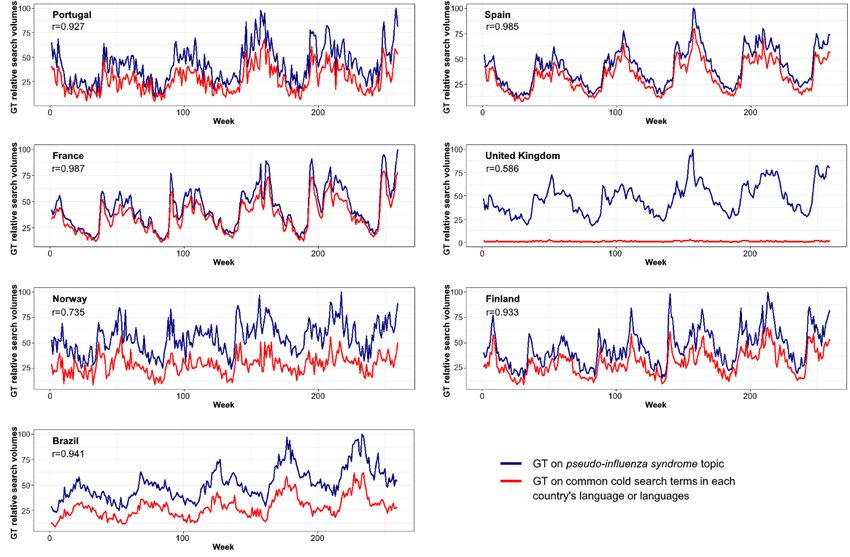
JOURNAL OF MEDICAL INTERNET RESEARCH                                                                                             Sousa-Pinto et al

     for that period, (2) the correlation coefficients between the          with variable correlation between GT on the pseudo-influenza
     predicted variation in hospitalizations and the actual number of       syndrome topic and common cold words (Figure 1). A relatively
     asthma hospitalizations (ie, without time series decomposition)        low correlation coefficient was observed for the United
     for that period, (3) the average weekly difference between the         Kingdom, as we compared the pseudo-influenza syndrome topic
     numbers of predicted and observed hospitalizations, and (4) the        with the search expression common cold, which may not be
     number of weeks whose number of observed asthma                        frequently used, particularly when compared with the term cold.
     hospitalizations fell outside the 95% CI for predicted admissions.     However, we did not query the latter term because of its double
                                                                            meaning.
     Normality was assessed from the skewness and kurtosis of each
     distribution (with values lower than −1 or higher than 1               Between 2012 and 2016, GT data for pseudo-influenza syndrome
     indicating deviation from normality). The 95% CIs of the               presented similar patterns across 16 countries for which GT
     correlation coefficients were computed to assess their precision       data were plotted, with peaks in the winter and valleys in the
     and determine whether they were significantly different from           summer (Figure 2). In the 5 main assessed countries, correlations
     0. All analyses were performed using the R software, version           between untransformed GT on the pseudo-influenza syndrome
     4.0.0 (R Foundation for Statistical Computing).                        topic and asthma hospitalizations varied between 0.10 (in the
                                                                            Brazilian state of Bahia) and 0.69 (in Spain; Table 1). Similar
     Results                                                                values were observed when analyzing the correlations between
                                                                            GT and words for the common cold.
     Overview
     Assessing data from several countries, we observed that common
     cold was listed as pseudo-influenza syndrome topic, although
     Figure 1. Google Trends data on the pseudo-influenza syndrome topic and on common cold search terms in each country’s respective language or
     languages (r: Pearson correlation coefficient). For the United Kingdom, r=0.769 when GT data on pseudo-influenza syndrome and on common cold
     search terms are retrieved separately. GT: Google Trends.

     https://www.jmir.org/2021/7/e27044                                                               J Med Internet Res 2021 | vol. 23 | iss. 7 | e27044 | p. 4
                                                                                                                    (page number not for citation purposes)
XSL• FO
RenderX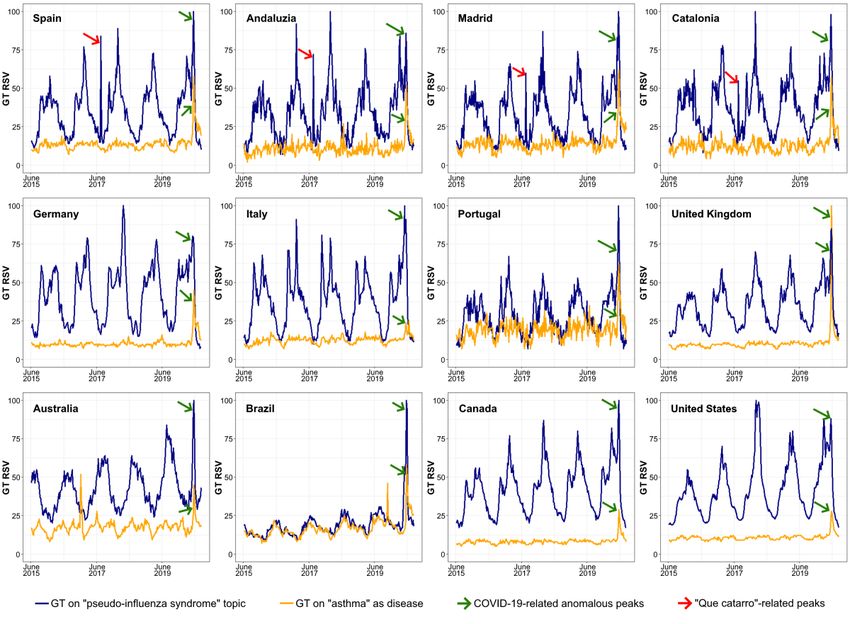
JOURNAL OF MEDICAL INTERNET RESEARCH                                                                                                Sousa-Pinto et al

     Figure 2. Google Trends data on pseudo-influenza syndrome for 16 countries in Europe (blue), North America (green), and the Southern Hemisphere
     (red) for a period of 5 years (2012-2016). GT: Google Trends; RSV: relative search volume.

     https://www.jmir.org/2021/7/e27044                                                                  J Med Internet Res 2021 | vol. 23 | iss. 7 | e27044 | p. 5
                                                                                                                       (page number not for citation purposes)
XSL• FO
RenderX
JOURNAL OF MEDICAL INTERNET RESEARCH Sousa-Pinto et al
Table 1. Correlation and cross-correlation coefficients between common cold Google Trends data (ie, Google Trends data on the pseudo-influenza
syndrome topic and on common cold search terms) and asthma hospitalizations for the period 2012-2016.
Country or region Correlation coefficients Cross-correlation coefficients (95% CI) after removal of the trend component
(95% CI) based on ob-
served data
Week laga-0 Week laga-1 Week laga-2 Week laga-3 Week laga-4
Pseudo-influenza syndrome topic
Portugal 0.54 (0.42 to 0.66) 0.68 (0.54 to 0.81) 0.73 (0.59 to 0.86) 0.67 (0.53 to 0.81) 0.71 (0.57 to 0.85) 0.65 (0.52 to 0.79)
Spain 0.69 (0.57 to 0.81) 0.83 (0.69 to 0.97) 0.84 (0.71 to 0.98) 0.83 (0.69 to 0.96) 0.80 (0.67 to 0.94) 0.76 (0.62 to 0.89)
Andalusia 0.54 (0.42 to 0.66) 0.63 (0.50 to 0.77) 0.68 (0.55 to 0.82) 0.68 (0.54 to 0.81) 0.67 (0.54 to 0.81) 0.66 (0.52 to 0.80)
Catalonia 0.65 (0.53 to 0.78) 0.80 (0.66 to 0.93) 0.80 (0.66 to 0.93) 0.79 (0.65 to 0.93) 0.79 (0.65 to 0.92) 0.74 (0.60 to 0.87)
Madrid 0.63 (0.51 to 0.75) 0.67 (0.53 to 0.80) 0.69 (0.55 to 0.82) 0.65 (0.52 to 0.79) 0.65 (0.52 to 0.79) 0.62 (0.48 to 0.76)
Finland 0.16 (0.04 to 0.29) 0.44 (0.30 to 0.58) 0.44 (0.30 to 0.57) 0.42 (0.29 to 0.56) 0.32 (0.18 to 0.46) 0.25 (0.11 to 0.39)
Norway 0.15 (0.03 to 0.27) 0.32 (0.18 to 0.45) 0.35 (0.21 to 0.49) 0.26 (0.12 to 0.39) 0.18 (0.05 to 0.32) 0.18 (0.05 to 0.32)
Brazil 0.26 (0.14 to 0.39) 0.83 (0.69 to 0.97) 0.77 (0.64 to 0.91) 0.70 (0.57 to 0.84) 0.62 (0.49 to 0.76) 0.54 (0.40 to 0.67)
São Paulo 0.45 (0.33 to 0.57) 0.66 (0.52 to 0.80) 0.58 (0.45 to 0.72) 0.44 (0.30 to 0.58) 0.33 (0.19 to 0.47) 0.28 (0.14 to 0.42)
Rio Grande 0.54 (0.42 to 0.66) 0.67 (0.53 to 0.80) 0.64 (0.50 to 0.77) 0.59 (0.45 to 0.72) 0.57 (0.44 to 0.71) 0.53 (0.40 to 0.67)
do Sul
Bahia 0.10 (−0.02 to 0.22) 0.50 (0.37 to 0.64) 0.49 (0.36 to 0.63) 0.54 (0.40 to 0.68) 0.47 (0.33 to 0.61) 0.40 (0.26 to 0.53)
Common cold search terms
Portugal 0.53 (0.41 to 0.65) 0.63 (0.50 to 0.77) 0.68 (0.54 to 0.82) 0.68 (0.54 to 0.81) 0.65 (0.51 to 0.79) 0.59 (0.45 to 0.72)
Spain 0.69 (0.57 to 0.82) 0.82 (0.69 to 0.96) 0.84 (0.70 to 0.97) 0.82 (0.68 to 0.96) 0.80 (0.66 to 0.94) 0.75 (0.62 to 0.89)
Andalusia 0.55 (0.43 to 0.67) 0.62 (0.48 to 0.76) 0.65 (0.51 to 0.78) 0.66 (0.53 to 0.80) 0.65 (0.52 to 0.79) 0.66 (0.52 to 0.79)
Catalonia 0.67 (0.55 to 0.79) 0.78 (0.65 to 0.92) 0.78 (0.65 to 0.92) 0.78 (0.64 to 0.92) 0.76 (0.62 to 0.90) 0.71 (0.58 to 0.85)
Madrid 0.61 (0.49 to 0.73) 0.63 (0.50 to 0.77) 0.66 (0.52 to 0.80) 0.64 (0.50 to 0.78) 0.64 (0.50 to 0.78) 0.62 (0.48 to 0.76)
Finland 0.24 (0.12 to 0.36) 0.47 (0.34 to 0.61) 0.46 (0.32 to 0.59) 0.40 (0.26 to 0.54) 0.32 (0.19 to 0.46) 0.25 (0.11 to 0.38)
Norway 0.22 (0.10 to 0.35) 0.35 (0.21 to 0.49) 0.33 (0.20 to 0.47) 0.24 (0.11 to 0.38) 0.15 (0.02 to 0.29) 0.15 (0.02 to 0.29)
Brazil 0.37 (0.25 to 0.49) 0.82 (0.69 to 0.96) 0.77 (0.63 to 0.91) 0.69 (0.55 to 0.82) 0.61 (0.47 to 0.74) 0.52 (0.38 to 0.65)
São Paulo 0.46 (0.34 to 0.58) 0.67 (0.54 to 0.81) 0.60 (0.47 to 0.74) 0.46 (0.33 to 0.60) 0.37 (0.24 to 0.51) 0.30 (0.16 to 0.43)
Rio Grande 0.55 (0.43 to 0.67) 0.61 (0.48 to 0.75) 0.57 (0.43 to 0.70) 0.53 (0.40 to 0.67) 0.52 (0.38 to 0.65) 0.46 (0.33 to 0.60)
do Sul
Bahia 0.18 (0.06 to 0.30) 0.40 (0.26 to 0.54) 0.43 (0.30 to 0.57) 0.40 (0.26 to 0.54) 0.35 (0.21 to 0.48) 0.29 (0.15 to 0.43)
a
Week lag corresponds to the week difference between Google Trends and hospitalization data (eg, a week lag of 1 implies that Google Trends data of
a certain week will be correlated with hospitalization data of the following week).
Andalusia. In Brazil, stronger correlations were observed in Rio
Time Series Results Grande do Sul and São Paulo than in Bahia.
In time series analyses, GT on the pseudo-influenza syndrome
topic correlated more strongly with asthma hospitalizations Forecasts for 1-year (June 2015 to June 2016) variations in
occurring in the subsequent week than with those occurring in asthma hospitalizations obtained through seasonal ARIMA
the same week in Portugal (ρ=0.73 vs ρ=0.68), Spain (ρ=0.84 models strongly correlated with actual observed asthma
vs ρ=0.83), and Norway (ρ=0.35 vs ρ=0.32) but not in Finland hospitalizations for the same period in Spain (ρ=0.88-0.91),
(ρ=0.44 in both cases) or Brazil (ρ=0.77 vs ρ=0.83; Table 1; Brazil (ρ=0.87-0.94), and Portugal (ρ=0.69-0.79; Table 2). Such
Figure 3). Similar results were observed with GT on common correlations were moderate for Finland (ρ=0.49-0.55) and
cold search terms (Portugal: ρ=0.68 vs ρ=0.63; Spain: ρ=0.84 Norway (ρ=0.37-0.45). In Spain, the strongest correlations were
vs ρ=0.82; Finland: ρ=0.47 vs ρ=0.46; Norway: ρ=0.32 vs observed for Catalonia (ρ=0.86-0.87), whereas in Brazil, they
ρ=0.35; Brazil: ρ=0.77 vs ρ=0.82). Relevant regional differences were observed for Rio Grande do Sul (ρ=0.89-0.91).
were observed in Spain and Brazil. In Spain, stronger From June 2015 to June 2016, we also forecasted the number
correlations were observed in Catalonia than in Madrid or of asthma hospitalizations occurring each week and compared
it with the number of observed asthma hospitalizations (Table
https://www.jmir.org/2021/7/e27044 J Med Internet Res 2021 | vol. 23 | iss. 7 | e27044 | p. 6
(page number not for citation purposes)
XSL• FO
RenderXJOURNAL OF MEDICAL INTERNET RESEARCH Sousa-Pinto et al
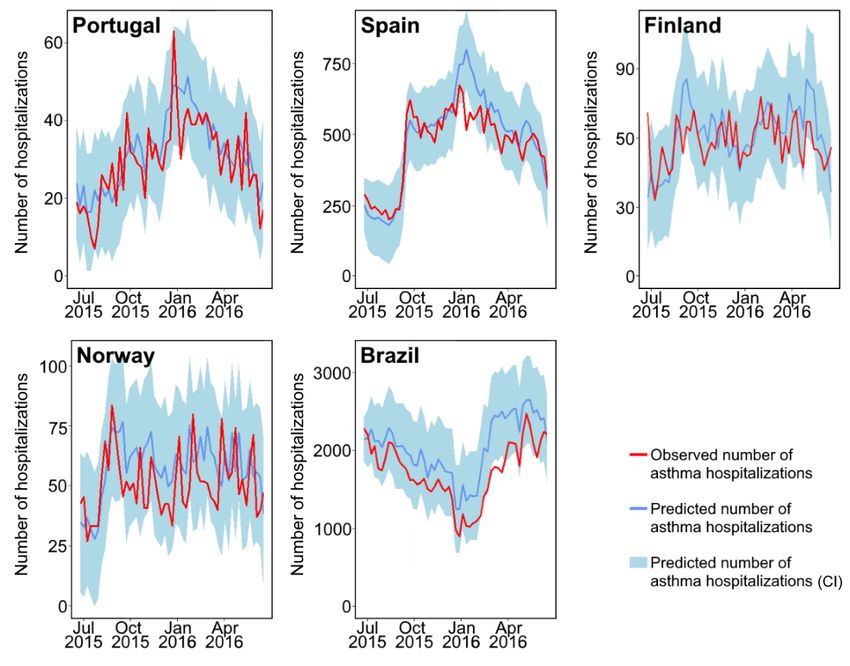
3; Figures 4 and 5). The weekly number of predicted number of weeks in which the absolute frequency of observed
hospitalizations showed, on average, a 12% difference compared asthma hospitalizations did not fall within the predicted 95%
with the number of observed asthma hospitalizations in Spain. CI ranged between 0 (Rio Grande do Sul) and 8 (Brazil as a
This difference was 23% in Portugal, 16%-17% in Finland, whole).
32%-33% in Norway, and 21%-23% in Brazil. In 1 year, the
Figure 3. Google Trends data on pseudo-influenza syndrome and asthma hospitalizations (2012-2016) in Portugal, Spain, Finland, Norway, and Brazil.
The trend component of time series has been plotted after removal of the seasonal effects and random error components. GT: Google Trends.
https://www.jmir.org/2021/7/e27044 J Med Internet Res 2021 | vol. 23 | iss. 7 | e27044 | p. 7
(page number not for citation purposes)
XSL• FO
RenderXJOURNAL OF MEDICAL INTERNET RESEARCH Sousa-Pinto et al
Table 2. Results of forecasts for 1-year variations in asthma hospitalizations: correlation coefficients between predicted variations in asthma hospitalizations
and actually observed asthma hospitalizations over 1 year (June 2015 to June 2016).
Country or region Transformed observed hospitalizationsa, correlation Untransformed observed hospitalizationsb, correla-
coefficient (95% CI) tion coefficient (95% CI)
Pseudo-influenza syndrome topic
Portugal 0.79 (0.67-0.88) 0.74 (0.60-0.84)
Spain 0.90 (0.82-0.95) 0.88 (0.79-0.93)
Andalusia 0.75 (0.61-0.85) 0.75 (0.60-0.85)
Catalonia 0.87 (0.77-0.93) 0.86 (0.77-0.92)
Madrid 0.83 (0.72-0.90) 0.82 (0.70-0.89)
Finland 0.54 (0.26-0.73) 0.49 (0.19-0.71)
Norway 0.37 (0.09-0.60) 0.41 (0.15-0.64)
Brazil 0.93 (0.89-0.96) 0.87 (0.80-0.92)
São Paulo 0.68 (0.45-0.84) 0.67 (0.51-0.79)
Rio Grande do Sul 0.89 (0.83-0.94) 0.91 (0.86-0.95)
Bahia 0.85 (0.74-0.92) 0.81 (0.72-0.89)
Common cold search terms
Portugal 0.76 (0.63-0.85) 0.69 (0.58-0.79)
Spain 0.91 (0.85-0.95) 0.88 (0.77-0.95)
Andalusia 0.79 (0.67-0.87) 0.78 (0.64-0.88)
Catalonia 0.87 (0.81-0.93) 0.86 (0.79-0.92)
Madrid 0.84 (0.74-0.91) 0.83 (0.72-0.90)
Finland 0.55 (0.26-0.75) 0.49 (0.18-0.72)
Norway 0.39 (0.16-0.58) 0.45 (0.19-0.63)
Brazil 0.94 (0.90-0.96) 0.88 (0.82-0.92)
São Paulo 0.73 (0.50-0.88) 0.72 (0.59-0.81)
Rio Grande do Sul 0.89 (0.82-0.94) 0.90 (0.84-0.95)
Bahia 0.85 (0.77-0.92) 0.81 (0.71-0.89)
a
Correlation coefficients between predicted weekly asthma hospitalization trends and actual observed hospitalizations after applying time series analysis
methods (ie, after removing the trend component).
b
Correlation coefficients between predicted weekly hospitalization trends and actual observed raw numbers of weekly asthma hospitalizations.
https://www.jmir.org/2021/7/e27044 J Med Internet Res 2021 | vol. 23 | iss. 7 | e27044 | p. 8
(page number not for citation purposes)
XSL• FO
RenderXJOURNAL OF MEDICAL INTERNET RESEARCH Sousa-Pinto et al
Table 3. Results of 1-year (June 2015-June 2016) forecasts for the number of asthma hospitalizations based on autoregressive integrated moving
average models including common cold–related Google Trends data and asthma hospitalizations of the previous 3 years.
Country or region Correlation (95% CIs) between number Average difference in the absolute num- Weeks with observed hospitalizations
of predicted and observed hospitalizations bers of predicted and observed weekly outside predicted 95% CIs, n (%)
hospitalizations, N (average % difference)
Pseudo-influenza syndrome topic
Portugal 0.79 (0.68-0.87) 5 (23.3) 1 (1.9)
Spain 0.92 (0.85-0.96) 54 (11.6) 4 (7.5)
Andalusia 0.76 (0.62-0.85) 9 (21.5) 5 (9.4)
Catalonia 0.88 (0.80-0.92) 13 (16.3) 5 (9.4)
Madrid 0.80 (0.67-0.88) 15 (21.1) 6 (11.3)
Finland 0.45 (0.16-0.69) 10 (16.7) 4 (7.5)
Norway 0.40 (0.17-0.59) 14 (31.8) 1 (1.9)
Brazil 0.88 (0.80-0.92) 328 (20.6) 7 (13.2)
São Paulo 0.63 (0.40-0.80) 52 (32.3) 3 (5.7)
Rio Grande 0.88 (0.82-0.93) 22 (22.8) 1 (1.9)
do Sul
Bahia 0.79 (0.67-0.87) 63 (24.4) 5 (9.4)
Common cold search terms
Portugal 0.77 (0.65-0.86) 6 (22.5) 1 (1.9)
Spain 0.90 (0.85-0.96) 54 (11.6) 4 (7.5)
Andalusia 0.78 (0.66-0.88) 9 (23.5) 6 (11.3)
Catalonia 0.86 (0.75-0.92) 13 (16.1) 6 (11.3)
Madrid 0.81 (0.68-0.90) 15 (21.4) 7 (13.2)
Finland 0.47 (0.24-0.65) 9 (15.8) 3 (5.7)
Norway 0.40 (0.14-0.59) 15 (32.8) 3 (5.7)
Brazil 0.94 (0.90-0.96) 359 (22.6) 8 (15.1)
São Paulo 0.68 (0.42-0.83) 48 (30) 2 (3.8)
Rio Grande 0.89 (0.84-0.94) 19 (20) 0 (0)
do Sul
Bahia 0.85 (0.77-0.92) 63 (24.3) 5 (9.4)
https://www.jmir.org/2021/7/e27044 J Med Internet Res 2021 | vol. 23 | iss. 7 | e27044 | p. 9
(page number not for citation purposes)
XSL• FO
RenderXJOURNAL OF MEDICAL INTERNET RESEARCH Sousa-Pinto et al
Figure 4. Predicted and observed number of asthma hospitalizations for 1 year in Portugal, Spain, Finland, Norway, and Brazil. Predicted hospitalizations
were estimated based on previous hospitalizations and on Google Trends data for the pseudo-influenza syndrome topic.
https://www.jmir.org/2021/7/e27044 J Med Internet Res 2021 | vol. 23 | iss. 7 | e27044 | p. 10
(page number not for citation purposes)
XSL• FO
RenderXJOURNAL OF MEDICAL INTERNET RESEARCH Sousa-Pinto et al
Figure 5. Predicted (blue; 95% CI in light blue) and observed (red) number of asthma hospitalizations for 1 year in the Spanish Autonomous Communities
of Andalusia (A), Catalonia (B), and Madrid (C), as well as in the Brazilian States of São Paulo (D), Rio Grande do Sul (E), and Bahia (F).
control (with a more effective prevention of respiratory
Discussion infection–related exacerbations) may in part be explained by
Principal Findings the lower correlations between common cold–related GT and
asthma hospitalizations. On the other hand, differences between
In this study, we observed moderate-to-strong correlations Finland and Norway may be explained by the more frequent
between rhinovirus-related GT and asthma hospitalization data fluctuations in Norwegian asthma hospitalizations (even within
in 5 different countries (Portugal, Spain, Finland, Norway, and the same season), which can be explained by geographic or
Brazil). In addition, based on previous admission patterns and climatic reasons: Norway has a long coast along several seas
rhinovirus GT, we built seasonal ARIMA models with good in the Atlantic and Arctic with more than five Köppen climate
capacity to forecast asthma hospitalizations. zones, whereas Finland only lies in the Baltic Sea with three
Although the overall observed correlations were moderate to Köppen climate zones. In fact, for Norway, a stronger
strong, and the forecast models showed good performance, cross-correlation (0.46) was observed when performing analyses
between-country differences should be highlighted. Overall, based on 15-day average values instead of weekly values. These
lower correlations between rhinovirus-related GT and frequent fluctuations also explain why, despite the moderate
hospitalization data were observed in Finland and Norway. In correlations, the observed number of Norwegian hospitalizations
these 2 countries, the analysis of our data indicates that asthma fell within the forecasted 95% CIs in 49-51 out of 52 weeks
hospitalizations have markedly decreased throughout the years. (June 2015-June 2016).
Such a decrease may be partly explained by a focus on the early On the other hand, within-country differences should also be
detection and prevention of exacerbations. Such goals are indeed considered. For example, in Spain, the strongest correlations
stated in the Finnish Asthma Programme 1994-2004 and in the between observed and predicted asthma hospitalizations were
Finnish Allergy Programme 2008-2018, which have both related to the autonomous community of Catalonia. The fact
promoted guided self-management (ie, patients’ identification that correlations were weaker in other areas may be partly
of causes and proactive prevention of exacerbations) as the explained by the seasonal asthma hospitalization peaks observed
primary form of treatment [16,17]. This better overall asthma
https://www.jmir.org/2021/7/e27044 J Med Internet Res 2021 | vol. 23 | iss. 7 | e27044 | p. 11
(page number not for citation purposes)
XSL• FO
RenderXJOURNAL OF MEDICAL INTERNET RESEARCH Sousa-Pinto et al
in Madrid and Andalusia, which had no correspondence with also other factors, such as media coverage or users’ interest or
rhinovirus-related GT data. In fact, such peaks correlate with curiosity [6]. Such factors are particularly evident when
olive pollen peaks, and olive pollen concentrations are much assessing anomalous peaks in pseudo-influenza GT data over
higher in Madrid and Andalusia than in Catalonia [18]. the last 5 years (2015-2020). For example, in all regions of
Differences in pollen exposure may also partly explain the worse Spain (Figure 6; red arrows), but not in other countries, there
results observed in Portugal (when compared with Spain), where was a 1-day peak at the end of June 2017. This peak was
olive trees are abundant throughout all inland regions. In Brazil, probably related to the TV cartoon episode Qué catarro, which
the best results were consistently observed for Rio Grande do was aired at that time across Spain [19,20] (catarro is a Spanish
Sul, a state with only two Köppen climate zones, compared with or Castilian word for common cold). In another example, a larger
seven in São Paulo and nine in Bahia. Therefore, although anomalous pseudo-influenza GT data peak was found in several
rhinovirus-related GT, along with previous hospitalization countries during the COVID-19 outbreak in 2020 (Figure 6;
patterns, may help to forecast trends in asthma hospitalizations, green arrows). Previous studies have shown that GT can be
improved accuracy is to be expected if other variables are also highly influenced by media attention. For example, for several
taken into account. Such variables may include pollen exposure, countries in Europe and America, search peaks on anosmia or
pollution levels, and even meteorological variables. This is in ageusia had a better correlation with media coverage than with
line with the multifactorial nature of asthma exacerbations, in the epidemiological situation of COVID-19 [21]. Media
which viral infections play a major role along with other coverage also appears to have played a decisive role in driving
environmental factors. search peaks for asthma during the COVID-19 pandemic [11].
Although, at first sight, we could believe that media coverage
Strengths and Limitations does not particularly bias GT data in this study (as the common
This study had several important limitations. First, GT provides cold is a frequent and mild condition that does not drive media
information on users’ search behaviors, which reflect not only attention), the previously discussed Spanish anomalous data
the true epidemiological situation of a disease or condition but peak suggests that this factor should not be discarded.
Figure 6. Pseudo-influenza syndrome Google Trends data for the period 2015-2020, with anomalous peaks evidenced (anomalous peaks associated
with COVID-19: green arrows; peaks associated with transmission of the cartoon Que catarro on Spanish television in June 2017: red arrows). GT:
Google Trends; RSV: relative search volume.
Additional limitations include the absence of GT data on the data provided (ie, data expressed as a percentage of the search
actual number of performed searches, with only normalized volume in the period during which the term or expression
https://www.jmir.org/2021/7/e27044 J Med Internet Res 2021 | vol. 23 | iss. 7 | e27044 | p. 12
(page number not for citation purposes)
XSL• FO
RenderXJOURNAL OF MEDICAL INTERNET RESEARCH Sousa-Pinto et al
gathered the most attention). In states or regions with a low require previous hospitalization data, which may not be easily
volume of searches, the quality of the data provided by GT is available in all countries.
not sufficient for analysis. As a result, we were not able to assess
This study had several strengths. In particular, we assessed 5
all Brazilian states (not even the most populous Brazilian state
different countries (4 in Europe and 1 in South America) using
in every region) nor all Spanish autonomous communities.
nationwide data for a period of 5 years. For 2 of these countries,
Nevertheless, we assessed the most populous Brazilian state in
we considered regional differences to assess state-level data. In
three of the five official geographical regions, as well as the
addition, rhinovirus-related GT data were retrieved by two
three most populous Spanish autonomous communities. Another
different strategies—GT data on the pseudo-influenza syndrome
limitation concerns the secular increase in the use of the internet
topic and on search terms regarding the common cold—which
(and therefore of Google searching) between 2012 and 2016,
obtained comparable results. Finally, for data analysis, we
particularly with the generalization of smartphone use. The
applied methods to remove secular trends of GT data and
share of searches using Google may also vary during this period.
hospitalizations and built seasonal ARIMA models with
In Brazil, Google was responsible for 85% of the searches
predictions of hospitalization trends and frequencies that had
performed in 2013, but this percentage increased to over 95%
similar results.
in 2015 [22,23]. To control these secular trends, we applied
time series analysis methods, removing the estimated trend Conclusions
components for both GT and hospitalization data. In this study, we found that rhinovirus-related GT data correlated
Finally, in this study, we solely considered asthma well with asthma hospitalizations in Portugal, Spain, and Brazil
hospitalizations, even though only a minority of exacerbations (with moderate correlations observed for Finland and Norway).
resulted in hospitalization. Although trends in hospitalizations In addition, such GT data, along with previous admission
probably mirror those in exacerbations, an assessment of both patterns, were able to reasonably forecast asthma
hospitalizations and emergency department visits (whose data hospitalizations in the examined countries. Although these
were not currently available for analysis) would probably more results suggest that rhinovirus-related GT data may be helpful
accurately reflect trends in exacerbations. Furthermore, the when building models to predict asthma hospitalizations, future
generalizability of our forecast models is limited, as such models studies should explore the design of more complex models,
taking environmental variables into account and possibly
assessing exacerbations or other outcome variables.
Acknowledgments
The authors wish to thank the Portuguese Ministry of Health for providing access to the hospitalization data managed by the
Portuguese Central Health System Administration (Administração Central do Sistema de Saúde). Data from the Norwegian Patient
Registry were used in this study. The interpretation and reporting of these data are the sole responsibility of the authors, and no
endorsement by the Norwegian Patient Registry is intended nor should it be inferred. Article Processing Charges were funded
by National Funds through FCT-Fundação para a Ciência e a Tecnologia, IP, within CINTESIS, R&D Unit (reference
UIDB/4255/2020).
Conflicts of Interest
None declared.
References
1. Bahadori K, Doyle-Waters MM, Marra C, Lynd L, Alasaly K, Swiston J, et al. Economic burden of asthma: a systematic
review. BMC Pulm Med 2009 May 19;9:24 [FREE Full text] [doi: 10.1186/1471-2466-9-24] [Medline: 19454036]
2. Busse WW, Lemanske RF, Gern JE. Role of viral respiratory infections in asthma and asthma exacerbations. Lancet 2010
Sep 04;376(9743):826-834 [FREE Full text] [doi: 10.1016/S0140-6736(10)61380-3] [Medline: 20816549]
3. Nicholson KG, Kent J, Ireland DC. Respiratory viruses and exacerbations of asthma in adults. Br Med J 1993 Oct
16;307(6910):982-986 [FREE Full text] [doi: 10.1136/bmj.307.6910.982] [Medline: 8241910]
4. Johnston SL, Pattemore PK, Sanderson G, Smith S, Lampe F, Josephs L, et al. Community study of role of viral infections
in exacerbations of asthma in 9-11 year old children. Br Med J 1995 May 13;310(6989):1225-1229 [FREE Full text] [doi:
10.1136/bmj.310.6989.1225] [Medline: 7767192]
5. Eysenbach G. Infodemiology: The epidemiology of (mis)information. Am J Med 2002 Dec 15;113(9):763-765. [doi:
10.1016/s0002-9343(02)01473-0] [Medline: 12517369]
6. Eysenbach G. Infodemiology and infoveillance: framework for an emerging set of public health informatics methods to
analyze search, communication and publication behavior on the internet. J Med Internet Res 2009;11(1):e11 [FREE Full
text] [doi: 10.2196/jmir.1157] [Medline: 19329408]
7. Mavragani A, Sampri A, Sypsa K, Tsagarakis KP. Integrating smart health in the US health care system: infodemiology
study of asthma monitoring in the Google era. JMIR Public Health Surveill 2018 Mar 12;4(1):e24 [FREE Full text] [doi:
10.2196/publichealth.8726] [Medline: 29530839]
https://www.jmir.org/2021/7/e27044 J Med Internet Res 2021 | vol. 23 | iss. 7 | e27044 | p. 13
(page number not for citation purposes)
XSL• FO
RenderXJOURNAL OF MEDICAL INTERNET RESEARCH Sousa-Pinto et al
8. Osborne NJ, Alcock I, Wheeler BW, Hajat S, Sarran C, Clewlow Y, et al. Pollen exposure and hospitalization due to asthma
exacerbations: daily time series in a European city. Int J Biometeorol 2017 Oct;61(10):1837-1848 [FREE Full text] [doi:
10.1007/s00484-017-1369-2] [Medline: 28500390]
9. Bousquet J, Onorato GL, Oliver G, Basagana X, Annesi-Maesano I, Arnavielhe S, et al. Google Trends and pollen
concentrations in allergy and airway diseases in France. Allergy 2019 Oct;74(10):1910-1919. [doi: 10.1111/all.13804]
[Medline: 30942904]
10. Bousquet J, O'Hehir RE, Anto JM, D'Amato G, Mösges R, Hellings PW, et al. Assessment of thunderstorm-induced asthma
using Google Trends. J Allergy Clin Immunol 2017 Sep;140(3):891-893. [doi: 10.1016/j.jaci.2017.04.042] [Medline:
28579375]
11. Sousa-Pinto B, Heffler E, Antó A, Czarlewski W, Bedbrook A, Gemicioglu B, et al. Anomalous asthma and chronic
obstructive pulmonary disease Google Trends patterns during the COVID-19 pandemic. Clin Transl Allergy 2020 Nov
02;10(1):47 [FREE Full text] [doi: 10.1186/s13601-020-00352-9] [Medline: 33292529]
12. Mavragani A, Ochoa G. Google Trends in infodemiology and infoveillance: methodology framework. JMIR Public Health
Surveill 2019 May 29;5(2):e13439 [FREE Full text] [doi: 10.2196/13439] [Medline: 31144671]
13. Bousquet J, Agache I, Anto JM, Bergmann KC, Bachert C, Annesi-Maesano I, et al. Google Trends terms reporting rhinitis
and related topics differ in European countries. Allergy 2017 Aug;72(8):1261-1266. [doi: 10.1111/all.13137] [Medline:
28140507]
14. Bousquet J, Agache I, Berger U, Bergmann K, Besancenot J, Bousquet PJ, et al. Differences in reporting the ragweed pollen
season using Google Trends across 15 countries. Int Arch Allergy Immunol 2018;176(3-4):181-188 [FREE Full text] [doi:
10.1159/000488391] [Medline: 29742519]
15. Song X, Xiao J, Deng J, Kang Q, Zhang Y, Xu J. Time series analysis of influenza incidence in Chinese provinces from
2004 to 2011. Medicine (Baltimore) 2016 Jun;95(26):e3929 [FREE Full text] [doi: 10.1097/MD.0000000000003929]
[Medline: 27367989]
16. Haahtela T, Tuomisto LE, Pietinalho A, Klaukka T, Erhola M, Kaila M, et al. A 10 year asthma programme in Finland:
major change for the better. Thorax 2006 Aug;61(8):663-670 [FREE Full text] [doi: 10.1136/thx.2005.055699] [Medline:
16877690]
17. Haahtela T, Valovirta E, Bousquet J, Mäkelä M, Allergy Programme Steering Group. The Finnish Allergy Programme
2008-2018 works. Eur Respir J 2017 Jun;49(6):1700470 [FREE Full text] [doi: 10.1183/13993003.00470-2017] [Medline:
28642312]
18. SILAM v.5.7: System for Integrated modeLling of Atmospheric coMposition. Finnish Meteorological Institute. 2020. URL:
http://silam.fmi.fi/ [accessed 2020-06-15]
19. Programación Clan TVE. El Mundo. 2017. URL: https://web.archive.org/web/20170630042653/http://www.elmundo.es/
television/programacion-tv/clan-tve.html [accessed 2020-11-01]
20. Tutu: Qué catarro CLAN TVE. 2017. URL: https://www.rtve.es/infantil/ [accessed 2020-11-01]
21. Sousa-Pinto B, Anto A, Czarlewski W, Anto JM, Fonseca JA, Bousquet J. Assessment of the impact of media coverage
on COVID-19-related Google Trends data: infodemiology study. J Med Internet Res 2020 Aug 10;22(8):e19611 [FREE
Full text] [doi: 10.2196/19611] [Medline: 32530816]
22. 85% de participação, Google é o buscardor mais usado no Brasil [With 85% of share, Google is the most used search engine
in Brazil]. G1 Globo. 2013. URL: http://g1.globo.com/tecnologia/noticia/2013/07/
com-85-de-participacao-google-e-o-buscador-mais-usado-no-brasil.html [accessed 2020-06-15]
23. Rocha C. Confira o ranking dos buscadores no Brasil [Check out the ranking of search engines in Brazil]. Olhar Digital.
2015. URL: https://web.archive.org/web/20201023114542/https://olhardigital.com.br/noticia/
ranking-dos-buscadores-no-brasil/46539 [accessed 2020-06-15]
Abbreviations
ARIMA: autoregressive integrated moving average
GT: Google Trends
https://www.jmir.org/2021/7/e27044 J Med Internet Res 2021 | vol. 23 | iss. 7 | e27044 | p. 14
(page number not for citation purposes)
XSL• FO
RenderXJOURNAL OF MEDICAL INTERNET RESEARCH Sousa-Pinto et al
Edited by R Kukafka; submitted 08.01.21; peer-reviewed by A Mavragani, P Satpathy, S Huynh; comments to author 15.02.21; revised
version received 04.03.21; accepted 24.03.21; published 06.07.21
Please cite as:
Sousa-Pinto B, Halonen JI, Antó A, Jormanainen V, Czarlewski W, Bedbrook A, Papadopoulos NG, Freitas A, Haahtela T, Antó JM,
Fonseca JA, Bousquet J
Prediction of Asthma Hospitalizations for the Common Cold Using Google Trends: Infodemiology Study
J Med Internet Res 2021;23(7):e27044
URL: https://www.jmir.org/2021/7/e27044
doi: 10.2196/27044
PMID: 34255692
©Bernardo Sousa-Pinto, Jaana I Halonen, Aram Antó, Vesa Jormanainen, Wienczyslawa Czarlewski, Anna Bedbrook, Nikolaos
G Papadopoulos, Alberto Freitas, Tari Haahtela, Josep M Antó, João Almeida Fonseca, Jean Bousquet. Originally published in
the Journal of Medical Internet Research (https://www.jmir.org), 06.07.2021. This is an open-access article distributed under the
terms of the Creative Commons Attribution License (https://creativecommons.org/licenses/by/4.0/), which permits unrestricted
use, distribution, and reproduction in any medium, provided the original work, first published in the Journal of Medical Internet
Research, is properly cited. The complete bibliographic information, a link to the original publication on https://www.jmir.org/,
as well as this copyright and license information must be included.
https://www.jmir.org/2021/7/e27044 J Med Internet Res 2021 | vol. 23 | iss. 7 | e27044 | p. 15
(page number not for citation purposes)
XSL• FO
RenderXYou can also read


