MindSphere app SIMATIC Energy Manager - Introduction Structure of the app User profile Variable declarations Data analysis KPI calculations (KPIs) ...
←
→
Page content transcription
If your browser does not render page correctly, please read the page content below
Introduction              1

                                Structure of the app      2

                                User profile              3

                                Variable declarations     4
MindSphere app SIMATIC Energy                             5
                                Data analysis
Manager
                                KPI calculations (KPIs)   6
Application Manual

                                Energy media analysis     7

                                Creating dashboards       8

                                Widget views              9

07/2020
A5E49285137-AC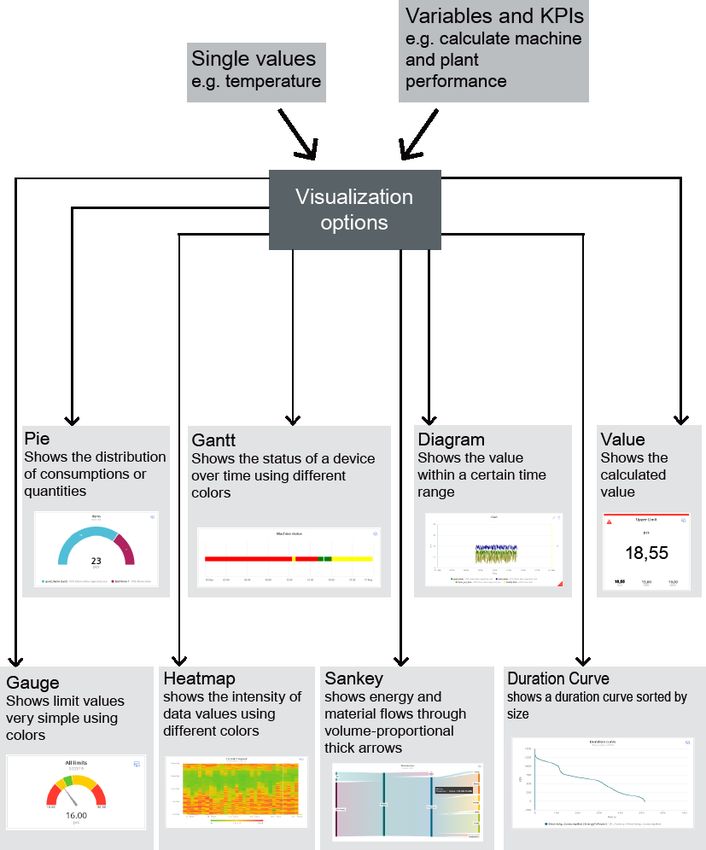
Legal information
Warning notice system
             This manual contains notices you have to observe in order to ensure your personal safety, as well as to prevent
             damage to property. The notices referring to your personal safety are highlighted in the manual by a safety alert
             symbol, notices referring only to property damage have no safety alert symbol. These notices shown below are
             graded according to the degree of danger.

                    DANGER
              indicates that death or severe personal injury will result if proper precautions are not taken.

                    WARNING
              indicates that death or severe personal injury may result if proper precautions are not taken.

                    CAUTION
              indicates that minor personal injury can result if proper precautions are not taken.

              NOTICE
              indicates that property damage can result if proper precautions are not taken.
             If more than one degree of danger is present, the warning notice representing the highest degree of danger will be
             used. A notice warning of injury to persons with a safety alert symbol may also include a warning relating to property
             damage.
Qualified Personnel
             The product/system described in this documentation may be operated only by personnel qualified for the specific
             task in accordance with the relevant documentation, in particular its warning notices and safety instructions. Qualified
             personnel are those who, based on their training and experience, are capable of identifying risks and avoiding
             potential hazards when working with these products/systems.
Proper use of Siemens products
             Note the following:

                    WARNING
              Siemens products may only be used for the applications described in the catalog and in the relevant technical
              documentation. If products and components from other manufacturers are used, these must be recommended or
              approved by Siemens. Proper transport, storage, installation, assembly, commissioning, operation and
              maintenance are required to ensure that the products operate safely and without any problems. The permissible
              ambient conditions must be complied with. The information in the relevant documentation must be observed.

Trademarks
             All names identified by ® are registered trademarks of Siemens AG. The remaining trademarks in this publication
             may be trademarks whose use by third parties for their own purposes could violate the rights of the owner.
Disclaimer of Liability
             We have reviewed the contents of this publication to ensure consistency with the hardware and software described.
             Since variance cannot be precluded entirely, we cannot guarantee full consistency. However, the information in this
             publication is reviewed regularly and any necessary corrections are included in subsequent editions.

             Siemens AG                             A5E49285137-AC                                       Copyright © Siemens AG 2020.
             Division Digital Factory               Ⓟ 07/2020 Subject to change                          All rights reserved
             Postfach 48 48
             90026 NÜRNBERG
             GERMANY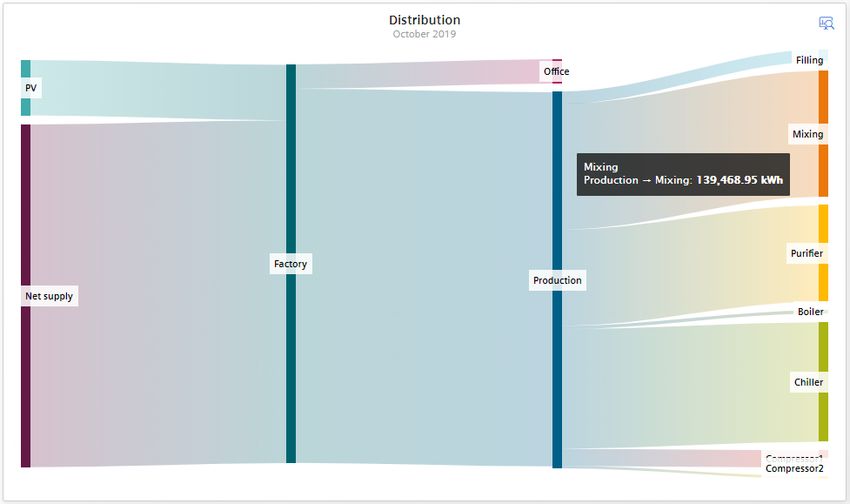
Table of contents

1      Introduction...................................................................................................................................................5
       1.1                Security information .................................................................................................................5
       1.2                Note on EU General Data Protection Regulation.....................................................................5
       1.3                Function overview ....................................................................................................................6
       1.4                What's new in Energy Manager? .............................................................................................8
2      Structure of the app ......................................................................................................................................9
3      User profile .................................................................................................................................................11
4      Variable declarations ..................................................................................................................................13
       4.1                Introduction to variable declarations ......................................................................................13
       4.2                Variable declarations on the asset .........................................................................................14
       4.3                Enable the "Activate notifications" function for variables and KPI instances .........................15
       4.4                Variable declaration in the widget ..........................................................................................17
       4.5                "Counter" acquisition category ...............................................................................................17
       4.5.1              Introduction to the "Counter" acquisition category .................................................................17
       4.5.2              Counting method of the "Up" counter.....................................................................................18
       4.5.3              "Up & Down" counting method of the counter........................................................................19
       4.6                Aggregation functions ............................................................................................................19
       4.6.1              Introduction to the aggregation functions ...............................................................................19
       4.6.2              Aggregation functions in combination with the "The value is aggregated" function: ..............21
5      Data analysis ..............................................................................................................................................27
       5.1                Introduction to data analysis (widgets)...................................................................................27
       5.2                Visualizing correlations in the diagram (Diagram)..................................................................31
       5.3                Visualizing individual values (Value) ......................................................................................33
       5.4                Visualizing machine statuses (Gantt).....................................................................................35
       5.5                Creating status mappings for the "Gantt" widget ...................................................................36
       5.6                Visualizing the violation of limit values (gauge)......................................................................37
       5.7                Visualizing the distribution of consumptions or quantities (Pie chart) ....................................39
       5.8                Visualizing the intensity of data values (Heatmap) ................................................................41
       5.9                Visualizing energy flows (Sankey) .........................................................................................43
       5.10               Visualizing a chart sorted by size (Duration curve) ................................................................44
6      KPI calculations (KPIs) ...............................................................................................................................47
       6.1                Introduction to KPI calculations..............................................................................................47
       6.2                Creating KPI types .................................................................................................................49

MindSphere app SIMATIC Energy Manager
Application Manual, 07/2020, A5E49285137-AC                                                                                                                          3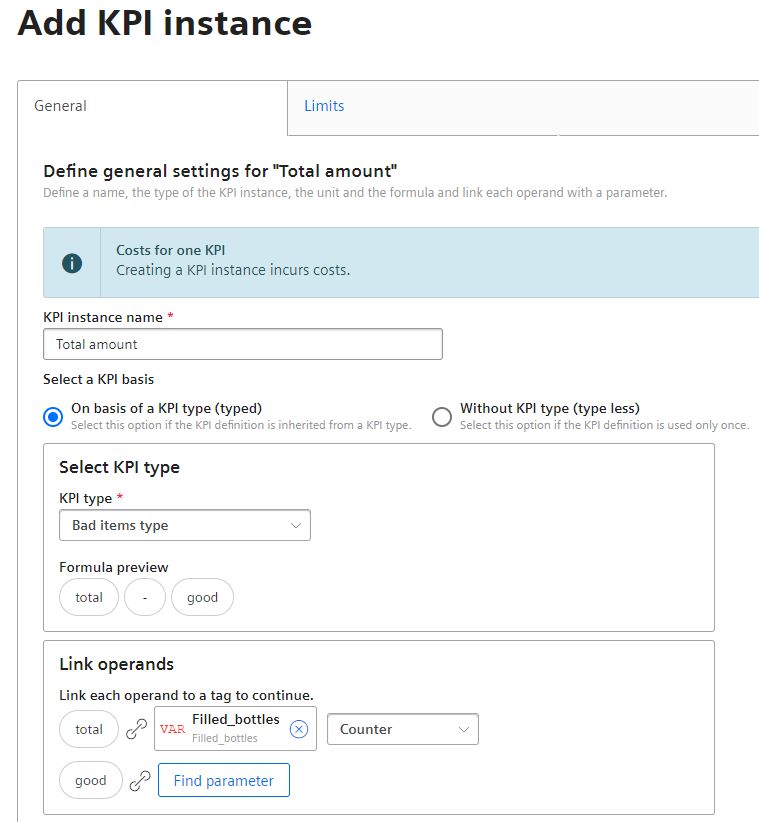
Table of contents

      6.3                Creating and deleting KPI instances ......................................................................................49
7     Energy media analysis ...............................................................................................................................53
      7.1                Introduction to the energy media analysis..............................................................................53
      7.2                Configuration of the energy media analysis ...........................................................................56
      7.3                Creating energy media...........................................................................................................58
      7.4                Defining energy media for an asset .......................................................................................58
      7.5                Defining contract information for energy media .....................................................................60
      7.6                Displaying the energy media analysis....................................................................................61
8     Creating dashboards ..................................................................................................................................63
      8.1                Structure of the dashboards...................................................................................................63
      8.2                Setting the time period in dashboards and widgets ...............................................................64
9     Widget views ..............................................................................................................................................65
      9.1                Detail view..............................................................................................................................65
      9.2                Histogram...............................................................................................................................66
      9.3                Regression analysis ...............................................................................................................66

                                                                                                              MindSphere app SIMATIC Energy Manager
4                                                                                                         Application Manual, 07/2020, A5E49285137-AC
Introduction 1
1.1 Security information
Security information
Siemens provides products and solutions with industrial security functions that support the
secure operation of plants, systems, machines and networks.
In order to protect plants, systems, machines and networks against cyber threats, it is
necessary to implement - and continuously maintain - a holistic, state-of-the-art industrial
security concept. Siemens’ products and solutions constitute one element of such a concept.
Customers are responsible for preventing unauthorized access to their plants, systems,
machines and networks. Such systems, machines and components should only be connected
to an enterprise network or the internet if and to the extent such a connection is necessary and
only when appropriate security measures (e.g. firewalls and/or network segmentation) are in
place.
For additional information on industrial security measures that may be implemented, please
visit:
https://www.siemens.com/industrialsecurity (https://new.siemens.com/global/en/company/
topic-areas/future-of-manufacturing/industrial-security.html)
Siemens’ products and solutions undergo continuous development to make them more secure.
Siemens strongly recommends that product updates are applied as soon as they are available
and that the latest product versions are used. Use of product versions that are no longer
supported, and failure to apply latest updates may increase customer’s exposure to cyber
threats.
To stay informed about product updates, subscribe to the Siemens Industrial Security RSS
Feed under:
https://www.siemens.com/industrialsecurity (https://new.siemens.com/global/en/company/
topic-areas/future-of-manufacturing/industrial-security.html)
1.2 Note on EU General Data Protection Regulation
Data protection
Siemens observes the principles of data protection, in particular the principle of data
minimization (privacy by design). For the SIMATIC Energy Manager product, this means: the
product processes / stores the following personal data: User name (first name and last name),
email address, user role and app usage data (number of users; number of KPI instances;
number of assets showing a media analysis).
No private or intimate data is processed or stored.
MindSphere app SIMATIC Energy Manager
Application Manual, 07/2020, A5E49285137-AC 5Introduction
1.3 Function overview
The above data are required for the login, the billing function and for the internal user
administration (administrator can see the role and the status of other users). The storage of
data is appropriate and limited to what is necessary, as it is essential to identify the authorized
operators. The data needs to be maintained manually by you and if necessary, these can also
be deleted. If you need support, please contact customer support.
The above data will not be stored anonymously or pseudonymized, because the purpose
(identification of the operating personnel) cannot be achieved otherwise.
The above data is protected against loss of integrity and confidentiality by state-of-the-art
security measures.
1.3 Function overview
Introduction
The MindSphere app SIMATIC Energy Manager provides you with information about how
much energy has been consumed at any time online:
● You have access to the consumption data of machines and plants worldwide.
● Transparent energy management data to ISO 50001
● With individual KPI types and user-specific dashboards, you are creating a complete
overview of the energy consumption of your machines, plants or entire production facilities
from which you can subsequently derive measures for energy efficiency.
● In addition to the KPI type and KPI instance application in combination, you can also create
a KPI instance directly at the asset in the SIMATIC Energy Manager without having defined
a KPI type beforehand.
● In the detail view of the widgets, you can quickly create media analyses.
● Transparent listing of energy costs, energy consumption and CO2 emissions of individual
machines and all your production facilities around the globe. (Energy media analysis)
● You obtain valuable information on peaks in energy consumption, for example, to make
informed decisions regarding optimization of energy efficiency and reducing energy costs.
The SIMATIC Energy Manager will help you make the transition from energy transparency to
energy efficiency. The recorded energy data will provide you with more planning reliability. You
optimize processes and plants by analyzing and documenting the energy consumption
together with the process data, such as temperatures, pressures, etc. Use the collected energy
data to make your procurement process even more precise.
If your plant is already energy-efficient, you can use the SIMATIC Energy Manager to ensure
that it will stay this way. For example, you can quickly detect whether a filter is contaminated
and replace it.
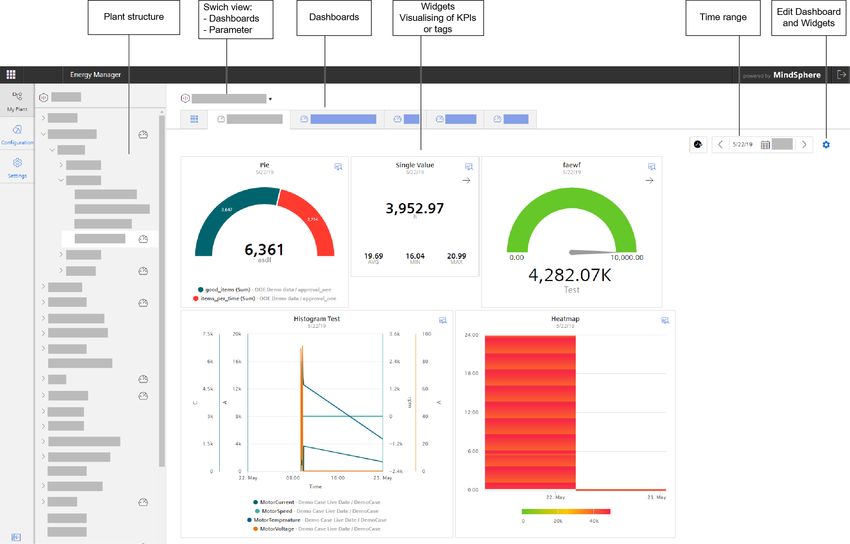
A dashboard is available for data analysis and energy data management; depending on your
needs, you can use a variety of widget types on the dashboard:
MindSphere app SIMATIC Energy Manager
6 Application Manual, 07/2020, A5E49285137-ACIntroduction
1.3 Function overview
Browser recommendation
You require an HTML5-capable Internet browser to run the app.
The Google Chrome and Microsoft Edge browsers are supported. Google Chrome is
recommended. You should preferably use 1920x1080 resolution.
The app can run on any mobile device with an HTML5-enabled browser. Tablets are
recommended.
MindSphere app SIMATIC Energy Manager
Application Manual, 07/2020, A5E49285137-AC 7Introduction
1.4 What's new in Energy Manager?
1.4 What's new in Energy Manager?
You can find all important new features in Energy Manager here: New features in Energy
Manager (https://sie.ag/whatsnew_energymanager)
MindSphere app SIMATIC Energy Manager
8 Application Manual, 07/2020, A5E49285137-ACStructure of the app 2
Views in the app
The SIMATIC Energy Manager app has the following tabs:
My Plant Energy media assignments, costs and the CO2 equiv‐
alent of an energy medium can be configured in the
Asset configuration.
My Plant is imported from the Asset Manager. You can
find additional information on the Asset Manager here:
Asset Manager System manual (https://
documentation.mindsphere.io/resources/html/asset-
manager/en-US/index.html)
You can create dashboards and widgets for the indi‐
vidual elements of My Plant.
Configuration In the Configuration, you manage the KPI types, ener‐
gy media and status mappings. The actual status map‐
ping to a variable or a KPI type takes place during the
configuration of the Gantt widget.
In addition, you can also delete all KPI instances that
are not in use here, for example, because the corre‐
sponding asset has been deleted.
MindSphere app SIMATIC Energy Manager
Application Manual, 07/2020, A5E49285137-AC 9Structure of the app
Settings In the settings, you manage the
● User information (e.g. the language region and the
user roles)
● Usage information (e.g. the number of users, the
KPI instances and the assets that show a media
analysis)
● User list
Symbol in My Plant This symbol indicates that there is at least one dash‐
board within the asset.
MindSphere app SIMATIC Energy Manager
10 Application Manual, 07/2020, A5E49285137-ACUser profile 3
User information
Here you can see your user information and set both the interface language and the language
region of the app. The selection of the language region affects all numbers, such as decimal
separators, and dates in dashboards and widgets within the app and can be selected
regardless of the interface language.
User roles
If you are logged on as a user or administrator in MindSphere, you have the following options:
Activities Users Administrator
Create and instantiate KPI types - x
(typed)
Create KPI instances (typeless) - x
Create, edit and delete dash‐ - x
boards
Create, edit and delete widgets - x
Displaying dashboards x x
Display widgets x x
Create, edit and delete status - x
mappings
Energy data management - x
Define limit values for tags and - x
KPI instances and enable the
"Activate notifications" function
Note
For use in subtenants
Users of a subtenant can only see the dashboards and widgets that belong to an asset of their
subtenant.
Administrators are currently not supported in the subtenant.
MindSphere app SIMATIC Energy Manager
Application Manual, 07/2020, A5E49285137-AC 11User profile
Note
General information on tenants and subtenants
A tenant is the digital representation of a real company in MindSphere. A tenant includes users,
data, assets, locations and other properties.
You can also create and manage subtenants in a tenant. The subtenants form a self-contained
subarea so that users of this subtenant can only access the contents of this area.
Assets can also be shared by one tenant with another tenant. (Cross tenancy)
You can find more on this topic in the documentation for MindSphere Settings.
Usage information
In the Usage information, you can view the number of assets that show a media analysis, the
number of KPI instances and the number of users logged on to the Tenant with the "Energy
Manager" role for specific months (mdsp:wccop:energymanager.admin).
If the maximum number of users is reached, purchase an additional user license or remove the
role "Energy Manager" from another user.
Note
Automatically created KPI instances for energy media analysis
The automatically created KPI instances are not taken into account in the number of KPI
instances because they do not result in additional costs.
Adding/deleting users (as an administrator)
As an administrator, you can manage the "Energy Manager" roles of administrator and user for
a user in the MindSphere settings as follows:
1. Open the MindSphere settings in the overview page of the MindSphere applications.
2. Select the required user in the "Users" menu. The assigned roles are displayed.
3. Click "Edit direct assignment".
4. Add the "mdsp:wccop:energymanager.admin" role or delete the role and close the dialog.
Deleting users
To free up a user license, you can deregister yourself as a user from the Energy Manager app:
1. Open the "Settings" menu.
2. You can deregister from the Energy Manager app under "User information > User account".
MindSphere app SIMATIC Energy Manager
12 Application Manual, 07/2020, A5E49285137-ACVariable declarations 4
4.1 Introduction to variable declarations
Description
The variables that are available on any asset were transferred from the plant to MindSphere
using the Asset Manager. My Plant with all existing variables is mapped on this basis in the
SIMATIC Energy Manager.
The name, aspect name and the unit of each variable are transferred from MindSphere.
See also
Variable declarations on the asset (Page 14)
Variable declaration in the widget (Page 17)
MindSphere app SIMATIC Energy Manager
Application Manual, 07/2020, A5E49285137-AC 13Variable declarations
4.2 Variable declarations on the asset
4.2 Variable declarations on the asset
Description
You can extend the declaration of each variable directly on the asset in the "Parameter" area
by the following properties:
● Unit: You can either apply the unit transferred from MindSphere or specify your own unit.
● Acquisition category:
You use the acquisition category to determine how the value was acquired and stored in
MindSphere. In addition, the acquisition category is linked directly to an aggregation
function. As soon as you use the variable in a widget, the respective aggregation function
is automatically selected:
– ProcessValue => aggregation function: Average
– Power => aggregation function: Average
– Energy => aggregation function: Sum
– Flow => aggregation function: Average
– Amount => aggregation function: Sum
– Counter => aggregation function: Counter
When you select the acquisition category "Counter", you can define additional settings
for each counter used.
Additional information on the counting method of the individual counters can be found
here: Introduction to the "Counter" acquisition category (Page 17)
– Status value (State)
● Activate the "The value is aggregated" function:
If the value is not aggregated, the values are continuously (actual values) transferred to
MindSphere when the value changes. The currently transferred value is valid until the next
value is transferred to MindSphere. When the value is aggregated, the value is always valid
for the last cycle, e.g. 15 minutes.
We recommend that you activate the function for the energy data management.
You can find additional information on the aggregation functions here: Introduction to the
aggregation functions (Page 19)
Note
Data gaps
Data gaps occur, for example, when the connection to the network is interrupted. No data from
the plant is transferred to MindSphere during the interruption.
When you have activated the "The value is aggregated" function and are using an acquisition
category with the "Sum" aggregation function, data gaps will distort the final result.
MindSphere app SIMATIC Energy Manager
14 Application Manual, 07/2020, A5E49285137-ACVariable declarations
4.3 Enable the "Activate notifications" function for variables and KPI instances
Procedure
To extend the declaration of a variable on the asset, follow these steps:
1. Click on the required asset and open the "Parameter" area.
2. Next to the variable, click on the "Edit" icon.
3. Select the desired properties.
4.3 Enable the "Activate notifications" function for variables and KPI
instances
Description
For each variable of the "Integer" data type, you can define high and low limits that trigger a
notification when these limits are exceeded or not reached. This notification is displayed in the
SIMATIC Notifier MindSphere app and sent directly to the desired mobile device.
You can also define limits for KPI instances.
Note
Defining limits
You can only define limits for user-defined KPI instances.
The limits defined here for the tag or KPI instance are applied by default in the widget as soon
as the tag or KPI instance is used. You can adapt the limits in the widget if necessary.
MindSphere app SIMATIC Energy Manager
Application Manual, 07/2020, A5E49285137-AC 15Variable declarations
4.3 Enable the "Activate notifications" function for variables and KPI instances
Procedure
To enable the "Activate notifications" function, proceed as follows:
1. Click on the required asset and open the "Parameter" area.
2. Click the "Edit" icon next to the desired variable or KPI instance, or create a new KPI
instance.
3. Click on the "Limits" tab.
You can select the check box for the respective notification next to the fields "Low limit alarm/
warning" and "High limit alarm/warning". As soon as the function is activated and the
specified high or low limit has been violated, a notification is triggered and sent to the mobile
device.
4. You can also select the following settings in the "Notification" section:
– For variables:
Select whether the raw data or the aggregated data should be validated.
If you want to validate the raw data, a fixed calculation cycle of 10 seconds is used.
If you want to validate the aggregated data, you need to select a calculation cycle and an
aggregate function. The following calculation cycles are available:
10 sec, 30 sec, 1 min, 10 min, 15 min, 30 min, 1 hour, 2 hour, 8 hour, 1 day
The calculation cycle always starts at 00:00 UTC time (Universal Time Coordinated),
e.g. 00:00:00; 00:15:00; ...
For example, if you define a calculation cycle of 15 minutes, the system checks every 15
minutes whether or not a high or low limit has been violated and sends a notification if
necessary.
The following aggregation functions are available: Introduction to the aggregation
functions (Page 19)
– For KPI instances:
Select a calculation cycle:
10 sec, 30 sec, 1 min, 10 min, 15 min, 30 min, 1 hour, 2 hour, 8 hour, 1 day
The calculation cycle always starts at 00:00 UTC time (Universal Time Coordinated),
e.g. 00:00:00; 00:15:00; ...
For example, if you define a calculation cycle of 15 minutes, the system checks every 15
minutes whether or not a high or low limit has been violated and sends a notification if
necessary.
MindSphere app SIMATIC Energy Manager
16 Application Manual, 07/2020, A5E49285137-ACVariable declarations
4.5 "Counter" acquisition category
4.4 Variable declaration in the widget
Description
When you create a widget, you can select one of the following aggregation functions for a
variable in step 3 "Parameter":
● None (Only with diagram)
● Average
● Min
● Max
● Sum
● Last
● Counter
● Timer
● EnergyToPower
● PowerToEnergy
● AmountToFlow
● FlowToAmount
You can find additional information on the individual aggregation functions here: Introduction to
the aggregation functions (Page 19)
4.5 "Counter" acquisition category
4.5.1 Introduction to the "Counter" acquisition category
Description
You can define properties for each counter:
● Installation date
● Installation time
● Counter constant (value by which the counter is counted up or down, e.g. 1 kWh.)
● Counter types
– Up counter = The counter can only count up. As soon as a subsequent counter value is
less than the current one, it is treated as an overflow and the counter is restarted.
– Up & Down counter = The counter can count up and down. You can not only calculate
the energy consumption of an energy medium, for example, but you can also detect
when energy is fed back.
MindSphere app SIMATIC Energy Manager
Application Manual, 07/2020, A5E49285137-AC 17Variable declarations
4.5 "Counter" acquisition category
● Reset behavior (Only for an Up counter: You can specify whether the counter is reset daily
or by an event, such as a defined overflow limit.)
● Overflow limit (If you have not activated the reset behavior, the counter is automatically
reset when it reaches the specified count limit.)
● Value at installation (Here you can specify the actual value at which the counter is to start.
If the counter is not to start with the start value of the limit range.)
● Value at replacement of the counter
4.5.2 Counting method of the "Up" counter
Description
Only positive changes in value are recorded. The sum of the positive value changes between
two points in time is output in each case. If the value remains the same between two points in
time or is reduced, the value is not counted.
Depending on the settings you select for a counter, you will see different counter values as a
result. By default, the "The value is aggregated" function is activated:
Settings Explanation
Start and end of the limit range is not de‐
fined.
Result: + 2 + 2 + 0 + 2 + 2 + 0 = 8
When you change the counter, you can
define different settings for each counter.
This example shows the transition from
one counter to the next:
Counter for the year Counter for the year
2018 2019
00:00 - 00:25 00:25 - 01:00
Counter constant: 1 Counter constant: 2
End of the limit Start of the limit
range: 8 range: 0
Result: + 2 + 2 = 4 Result: + 4 + 4 + 0 +
4 = 12
Final result: 4 + 12 = 16
MindSphere app SIMATIC Energy Manager
18 Application Manual, 07/2020, A5E49285137-ACVariable declarations
4.6 Aggregation functions
4.5.3 "Up & Down" counting method of the counter
Description
Depending on the settings you select for a counter, you will see different counter values as a
result. By default, the "The value is aggregated" function is activated. You cannot define any
limit ranges for the "Up & Down" counter.
Settings Explanation
Result: + 2 + 2 - 4 + 2 + 2 - 4 = 0
When you change the counter, you can de‐
fine different settings for each counter. This
example shows the transition from one
counter to the next:
Counter for the year Counter for the year
2018 2019
00:00 - 00:25 00:25 - 01:00
Counter constant: 1 Counter constant: 2
Result: + 2 + 2 = 4 Result: + 4 + 4 - 8 =
0
Final result: 4 + 0 = 4
4.6 Aggregation functions
4.6.1 Introduction to the aggregation functions
Description
You use an aggregation function to select which value is to be output for a variable.
● Output the last read value with "Last".
● Use the other functions to gather summary information from the read values, for example,
the sum of all read values.
MindSphere app SIMATIC Energy Manager
Application Manual, 07/2020, A5E49285137-AC 19Variable declarations
4.6 Aggregation functions
The following aggregation functions are available:
Function Meaning
Average Calculates the time-weighted average value of the read values.
Min Outputs the smallest read value.
Max Outputs the largest read value.
Sum Adds all read values.
Last Outputs the last read value.
Counter The sum of the positive value changes between two points in time is output in
each case.
Timer The Timer calculates the time interval in which the variable was not 0. Unit =
milliseconds.
EnergyToPower A consumption value can be converted into power.
This aggregation function can only be selected in combination with the acquisi‐
tion category consumption value (Energy) and Counter.
PowerToEnergy Power can be converted into a consumption value.
This aggregation function can only be selected in combination with the acquisi‐
tion category power value (Power).
AmountToFlow An amount (per hour) can be converted directly into a flow value.
This aggregation function can only be selected in combination with the acquisi‐
tion category amount value (Amount) and Counter.
FlowToAmount A flow value (amount/h) can be converted directly into an amount value.
This aggregation function can only be selected in combination with the acquisi‐
tion category flow value (Flow).
Note
Activating the interval in the first step of the Widget wizard
For this function to be executed, the aggregation function of the variable must not be set to
"None" because the values are displayed directly in the widget without further processing in this
case.
MindSphere app SIMATIC Energy Manager
20 Application Manual, 07/2020, A5E49285137-ACVariable declarations
4.6 Aggregation functions
4.6.2 Aggregation functions in combination with the "The value is aggregated" function:
Description
For each variable and thus for each aggregation function, you can activate the "The value is
aggregated" function:
"The value is aggregated" = not activated "The value is aggregated" = activated
When the "The value is aggregated" function is not When the "The value is aggregated" function is
activated, actual values are transferred to Mind‐ activated, no actual values are transferred but the
Sphere every 10 minutes, for example. The re‐ value that has already been calculated or pro‐
spective actual value is valid for 10 minutes until cessed in the last 10 minutes is transferred to
the next actual value is transferred to MindSphere. MindSphere.
If the time of the last reading operation is identical Application example:
to the end of the specified period, the last value is
A temperature measured value is recorded in the
not read.
plant every minute, and an average value of the
recorded values is then transferred to MindSphere
every 10 minutes.
Result:
Different results are calculated for the same time range, depending on the initial situation of how you
want to collect data.
Only the values marked in green are taken into account for the calculation of the result.
"Counter" aggregation function
"The value is aggregated" = not activated "The value is aggregated" = activated
Calculation example: Calculation example:
The calculation period is from 00:10 to 00:50. The calculation period is from 00:10 to 00:50.
Result: 1 + 1 + 1 + 1 = 4 Result: 1 + 1 + 1 + 1 = 4
"Timer" aggregation function
The timer calculates the time interval in which the variable was not "0". Unit = milliseconds.
For the timer, the "The value is aggregated" function is always = False.
MindSphere app SIMATIC Energy Manager
Application Manual, 07/2020, A5E49285137-AC 21Variable declarations
4.6 Aggregation functions
Calculation example:
The calculation period is from 00:00 to 01:00.
Result: 10 Min + 10 Min + 10 Min = 30 Min => 30 * 60 * 1000 ms => 1,800,000 ms
"Average" aggregation function
"The value is aggregated" = not activated "The value is aggregated" = activated
Calculation example: Calculation example:
The calculation period is from 00:10 to 00:50. The calculation period is from 00:10 to 00:50.
(10 + 20 + 30 + 40) / 40 = 2.5 (average value across (20 + 30 + 40 + 50) / 40 = 3.5 (average value across
the calculation period) the calculation period)
The aggregation function determines the weighted average depending on the time interval (every 10
minutes). If the time interval changes within a period, e.g. from 10 minutes to 12 minutes, then the values
with the time interval 10 minutes are first added and divided by the number of read values. The values
are then added together with the time interval 12 minutes and divided by the number of values read. The
weighted average is formed from the two results of the two time intervals (result1 + result2)/2=x.
MindSphere app SIMATIC Energy Manager
22 Application Manual, 07/2020, A5E49285137-ACVariable declarations
4.6 Aggregation functions
"Min", "Max" and "Last" aggregation functions
"The value is aggregated" = not activated "The value is aggregated" = activated
Calculation example: Calculation example:
The calculation period is from 00:10 to 00:50. The calculation period is from 00:10 to 00:50.
Min: 1 Min: 2
Max: 4 Max: 5
Load: 4 Load: 5
"Sum" aggregation function
"The value is aggregated" = not activated "The value is aggregated" = activated
Calculation example: Calculation example:
The calculation period is from 00:10 to 00:50. The calculation period is from 00:10 to 00:50.
1 + 2 + 3 + 4 = 10 2 + 3 + 4 + 5 = 14
MindSphere app SIMATIC Energy Manager
Application Manual, 07/2020, A5E49285137-AC 23Variable declarations
4.6 Aggregation functions
"AmountToFlow" aggregation function
"The value is aggregated" = not activated "The value is aggregated" = activated
Calculation example: Calculation example:
The calculation period is from 00:00 to 01:00. The calculation period is from 00:00 to 01:00.
Sum: 0 + 1 + 2 + 3 + 4 + 5 = 15 Sum: 1 + 2 + 3 + 4 + 5 + 6 = 21
AmountToFlow: Sum / time in hours = 15 / 1 = 15 AmountToFlow: Sum / time in hours = 21 / 1 = 21
"EnergyToPower" aggregation function
"The value is aggregated" = not activated "The value is aggregated" = activated
Calculation example: Calculation example:
The calculation period is from 00:00 to 01:00. The calculation period is from 00:30 to 01:00.
Sum: 0 + 1 + 2 + 3 + 4 + 5 = 15 Sum: 3 + 4 + 5 = 12
AmountToFlow: Sum / time in hours = 15 / 1 = 15 AmountToFlow: Sum / time in hours = 12 / 0.5 = 24
MindSphere app SIMATIC Energy Manager
24 Application Manual, 07/2020, A5E49285137-ACVariable declarations
4.6 Aggregation functions
Example of process tags of BOOL data type
This example only applies when the "The value is aggregated" function is not activated:
● Only the values = "1" are added.
● Time intervals are only recorded when the new value = "1" (Timer).
● One value is read every 10 minutes between 10:00 a.m. and 11:00 a.m., i.e. six in total. One
value is read every 12 minutes between 11:00 a.m. and 12:00 a.m., i.e. five in total. Because
the last reading operation takes place at 12:00 a.m. and the evaluation period also ends at
12:00 a.m, the last value is not read. To evaluate the last value at 12:00 a.m., you must set
the end of the evaluation period to at least 12:01 a.m.
Time Sum (BOOL) INT Timer (BOOL) In minutes
10:00 1 1 1 + 10
10:10 1 2 1 + 10
10:20 1 3 1 + 10
10:30 1 4 1 + 10
10:40 1 1 1 + 10
10:50 1 2 1 + 10
11:00 0 0 0
11:12 1 3 1 + 12
11:24 1 4 1 + 12
11:36 1 5 1 + 12
11:48 1 2 1 + 12
12:00 1 0 1 + 12
Result 10 27 108 (1 h 48
min)
Aggregation func‐ Sum Sum Timer Timer
tion
Evaluation:
● The "Sum" aggregation function returns the result = 10
All values = "1" between 10:00 a.m. and 11:48 a.m. are added.
● The "Timer" aggregation function returns the result = 108 minutes (1 hour 48 minutes)
The sum of all time intervals with the state "1" is recorded. The value "1" is read six times
between 10:00 and 10:50, with 10-minute intervals between each read. This results in a sum
of 60 minutes. No value is read at 11:00. The value "1" is read four times between 11:12 and
12:00. The time interval is 12 minutes each. This results in a sum of 48 minutes. The total
is a sum of 108 minutes or 1 hour 48 minutes or 6,480,000 milliseconds.
MindSphere app SIMATIC Energy Manager
Application Manual, 07/2020, A5E49285137-AC 25Variable declarations
4.6 Aggregation functions
MindSphere app SIMATIC Energy Manager
26 Application Manual, 07/2020, A5E49285137-ACData analysis 5
5.1 Introduction to data analysis (widgets)
Description
The following widget are available for data analysis:
Widget type Description
Displays the value of variables or KPI calculations as a dia‐
gram over time.
You can find additional information here: Visualizing correla‐
tions in the diagram (Diagram) (Page 31)
Displays the current value of a variable or a KPI.
You can find additional information here: Visualizing individ‐
ual values (Value) (Page 33)
The Gantt widget shows you the status of a device at a glance
using different color codes. For example, the status can rep‐
resent the current state or the state within a specific time
range.
This allows you to see at a glance, for example:
● When the device started up and how long it was in the
"RUN" operating state.
● When it switched to the "STOP" operating state and how
long it remained in this state.
You can find additional information here: Visualizing machine
statuses (Gantt) (Page 35)
MindSphere app SIMATIC Energy Manager
Application Manual, 07/2020, A5E49285137-AC 27Data analysis
5.1 Introduction to data analysis (widgets)
Widget type Description
Using the gauge, you can display limit values very simply
using colors and thus recognize at a glance whether limit
values are exceeded.
You can find additional information here: Visualizing the vio‐
lation of limit values (gauge) (Page 37)
Using the pie chart, you can display the distribution of con‐
sumption or quantities very simply. Clicking on a segment
highlights the segment and displays the corresponding value.
You can find additional information here: Visualizing the dis‐
tribution of consumptions or quantities (Pie chart) (Page 39)
Using the Heatmap, you can visualize the intensity of data
values. You can, for example, display the energy consump‐
tion (green = low consumption; red = high consumption).
You can find additional information here: Visualizing the in‐
tensity of data values (Heatmap) (Page 41)
MindSphere app SIMATIC Energy Manager
28 Application Manual, 07/2020, A5E49285137-ACData analysis
5.1 Introduction to data analysis (widgets)
Widget type Description
In the Sankey diagram, energy and material flows can be
displayed as arrows whose width is proportional to the flow
rate. This makes it easy for you to recognize, for example,
how energy is flowing through your plant.
You can find additional information here: Visualizing energy
flows (Sankey) (Page 43)
By using the duration curve, you can visualize a chart sorted
by size.
You can find additional information here: Visualizing a chart
sorted by size (Duration curve) (Page 44)
Requirement
To visualize and calculate the data from the plant, such as production figures, machine
operating times or water consumption, using KPIs, these figures must be transferred from the
plant to MindSphere using the Asset Manager. The data structure of your plant is then
automatically displayed in the app.
At least one dashboard is created on the desired asset.
Widget configuration
A wizard will guide you through the individual steps when creating a widget. However, the first
four steps are identical for all widget types:
● Step 1: Select the widget type
● Step 2: Define details
● Step 3: Select parameters
● Step 4: Define general display options
● Step 5: Define widget-specific display options
MindSphere app SIMATIC Energy Manager
Application Manual, 07/2020, A5E49285137-AC 29Data analysis
5.1 Introduction to data analysis (widgets)
Procedure for creating the general steps of a widget
To create a widget, follow these steps:
1. Either click "Create first widget" or click and "New widget" and select a widget type.
2. Assign a name and define the date settings:
Define date settings:
With the date settings you define the time range from which the values are to be visualized.
You can apply the dashboard date settings to a widget or define your own date settings for
this widget.
The following variants are available for setting your own date:
– Default: "Use the date settings from the dashboard" to use the time range that is defined
in the dashboard.
– You disable "Use the date settings from the dashboard" to define a specific time range.
You have the following options to do this:
Default: "Use current date" and enter the duration (e.g. week) under "Time range". The
start and end time are given by the predefined time ranges (day, week, month, year, etc.).
If you prefer, you can also disable "Use current date" and enter the start date and start
time manually. The end time is calculated based on the duration under "Time range".
Under "Offset", you can enter the number of days, weeks, months or years by which the
start time should be postponed. The start time can be either in the future or in the past.
If you use the dashboard date settings for the widget, all changes to the date settings are
displayed directly in all widgets of the dashboard.
Define interval:
You can also specify an interval at which the values are to be displayed, e.g., every 5
minutes, every 2 hours, etc..
3. You can select either a variable or a KPI type as parameter. Up to 10 parameters can be
defined.
For each variable you can select one of the aggregation functions (Average, Min, Max, Sum,
Last, Counter, Timer, EnergyToPower, PowerToEnergy, AmountToFlow, FlowToAmount).
You can find additional information on the aggregation functions here: Introduction to the
aggregation functions (Page 19)
In this step, you can also directly create KPI instances and link the operands with the desired
parameters.
You can find additional information on KPI instances here: Introduction to KPI calculations
(Page 47)
4. In the general display options, you can assign an alternative label for the variable or KPI
type. This label is then displayed in the legend in the detail view instead of the asset and the
aspect name of a parameter.
In this step, you can also enter the limit values for warnings and alerts.
– Red = the alert limit was violated
– Yellow = the warning limit was violated
The limit values are also displayed in the detail view as dashed lines.
You can also specify the number of decimal places and a color for each parameter in which
the graph is displayed in the detail view.
If you have already defined limits for the variable or KPI used, these are displayed in the
widget as pre-setting. However, these limits can be overwritten at any time.
MindSphere app SIMATIC Energy Manager
30 Application Manual, 07/2020, A5E49285137-ACData analysis
5.2 Visualizing correlations in the diagram (Diagram)
Editing widgets and adding more widgets
To edit existing widgets or add more widgets in a dashboard, click .
Error display in the widget
If a network error occurs or an operand required to display the widget has been deleted, for
example, the error symbol is shown in the bottom right corner of the widget.
See also
Detail view (Page 65)
Histogram (Page 66)
5.2 Visualizing correlations in the diagram (Diagram)
Description
Displays the value of variables or KPI calculations as a diagram over time. The following
diagram types are available:
● Line graph (Line)
● Bar graph (Bar); the bars of multiple parameters can also be stacked
● Area graph (Area)
● Spline curve
● Scatter diagram (Scatter)
The following views are also available in the diagram:
● Detail view
● Histogram
● Regression
MindSphere app SIMATIC Energy Manager
Application Manual, 07/2020, A5E49285137-AC 31Data analysis
5.2 Visualizing correlations in the diagram (Diagram)
Procedure
To define widget-specific display options for a bar graph, follow these steps:
1. In the last step, select a diagram type. You can also specify whether the value should be
visible and/or stacked (in the case of a bar graph).
2. A Y-axis is created for each unit that a parameter provides. A maximum of 5 Y-axes can be
defined per widget.
Each parameter is automatically assigned to a Y-axis. However, you can also manually
assign the parameters to a different Y-axis.
You can define a low and high limit for each Y-axis. This means that you can only display a
section between specific values in the widget.
Result
As a result, you see a line graph:
In the detail view, you can see the graphs of the parameters "Gas_Consumption",
"Water_Consumption" and "Electricity_Consumption" in the colors that you have defined in the
display options:
MindSphere app SIMATIC Energy Manager
32 Application Manual, 07/2020, A5E49285137-ACData analysis
5.3 Visualizing individual values (Value)
In the histogram, you can see the frequency distribution of the parameter
"Electricity_Consumption":
In the regression analysis, you can see the correlation between the two parameters
"Gas_Consumption" and "Electricity_Consumption":
5.3 Visualizing individual values (Value)
Description
Displays the value of a specific time range. The value is derived either from a variable with a
corresponding aggregation function or from a KPI result.
MindSphere app SIMATIC Energy Manager
Application Manual, 07/2020, A5E49285137-AC 33Data analysis
5.3 Visualizing individual values (Value)
The following views are also available for Value:
● Detail view
● Histogram
Procedure
To define widget-specific display options, follow these steps:
1. In the last step, you select whether the statistics (average, minimum, maximum) should be
displayed or not.
Result
As a result, you see an individual value that violated the warning limit. A yellow bar and the
warning symbol are therefore displayed.
The arrow shows you the tendency of the displayed value.
The statistical data of average, minimum and maximum are displayed in the bottom line if they
were activated in the last step.
Note
Values of the statistical data
The displayed statistics is calculated from the calculated values in the cycle that is specified in
the widget configuration.
View of the detail view with activated limit values:
MindSphere app SIMATIC Energy Manager
34 Application Manual, 07/2020, A5E49285137-ACData analysis
5.4 Visualizing machine statuses (Gantt)
5.4 Visualizing machine statuses (Gantt)
Description
The Gantt widget shows you the status of a device at a glance using different color codes. For
example, the status can represent the current state or the state within a specific time range.
This allows you to see at a glance, for example:
● When the device started up and how long it was in the "RUN" operating state.
● When it switched to the "STOP" operating state and how long it remained in this state.
in addition to the complete overview, you can also see all status displays broken down
individually in the detail view.
Procedure
To define widget-specific display options, follow these steps:
1. In the last step, select a status mapping from the drop-down list. If no status mapping exists
yet, you can create one with "Create new status mapping".
Result
The result shows the machine status:
● Red: Machine in STOP state (Value = 0)
● Green: Machine in RUN state (Value = 1)
● Yellow: An error has occurred (Value = 2)
The tooltips offer more information extending beyond the selected time range of the widget. For
example, you can see in the figure below that the time range from 24 June to 1 July was
selected for the widget. The tooltip also provides the information that the machine status with
the color "Red" has been present since 20 June.
MindSphere app SIMATIC Energy Manager
Application Manual, 07/2020, A5E49285137-AC 35Data analysis
5.5 Creating status mappings for the "Gantt" widget
The individual values are still displayed itemized in the detail view:
5.5 Creating status mappings for the "Gantt" widget
Description
Using a status mapping, you can display changes in the value of a variable at a glance in the
"Gantt" widget.
Status mappings
You can either create status mappings directly when creating a Gantt widget or you can create
a new status mapping in the "Configuration" (Configuration) tab. This tab also shows you a list
of the existing status mappings.
Creating and editing a status mapping
To create a status mapping, follow these steps:
1. Open "Configuration" > "Status mapping".
2. Click "New status mapping" (New status mapping).
MindSphere app SIMATIC Energy Manager
36 Application Manual, 07/2020, A5E49285137-ACData analysis
5.6 Visualizing the violation of limit values (gauge)
3. Assign a unique name and a description.
4. You can assign a color, a label and a description for each value that a variable can assume.
If a value that is not defined in the status mapping table occurs in the variable, it is displayed
with the status "not defined" and the color white in the Gantt widget.
You use the created status mapping in connection with the "Gantt" widget. The order of each
state mapping is reflected in the Gantt widget in the same way as shown in the table. You can
change the order using drag-and-drop.
5.6 Visualizing the violation of limit values (gauge)
Description
Using the gauge, you can display limit values very simply using colors and thus recognize at a
glance whether limit values are exceeded.
The following views are also available in the gauge:
● Detail view
● Histogram
Procedure
To define widget-specific display options, follow these steps:
1. The final step is to apply the limit values from the general display options if you have already
defined them there. In addition, you specify the value with which the gauge scale starts and
ends.
MindSphere app SIMATIC Energy Manager
Application Manual, 07/2020, A5E49285137-AC 37Data analysis
5.6 Visualizing the violation of limit values (gauge)
Result
The gauge shows you that the gas consumption per unit is in the acceptable range (green):
The arrow at the top right shows you the tendency of the displayed value.
In the detail view, you see the graph of the KPI instance "GasUnitConsumption" in the color that
you have defined in the display options:
In the histogram, you can see the frequency distribution of the KPI instance
"GasUnitConsumption":
MindSphere app SIMATIC Energy Manager
38 Application Manual, 07/2020, A5E49285137-ACData analysis
5.7 Visualizing the distribution of consumptions or quantities (Pie chart)
5.7 Visualizing the distribution of consumptions or quantities (Pie chart)
Description
Using the pie chart, you can display the distribution of consumption or quantities very simply.
Clicking on a segment highlights the segment and displays the corresponding value.
The following views are also available in the pie chart:
● Detail view
● Histogram
● Regression
Procedure
To define widget-specific display options, follow these steps:
1. In the last step, you specify whether the values are to be displayed as absolute or
percentage values.
Result
The pie chart shows you the percentage values of the parameters "Filling", "Purifier", "Mixing"
and "Utilities":
MindSphere app SIMATIC Energy Manager
Application Manual, 07/2020, A5E49285137-AC 39Data analysis
5.7 Visualizing the distribution of consumptions or quantities (Pie chart)
In the detail view, you can see the graphs of all four parameters in the colors that you have
defined in the display options:
In the histogram, you can see the frequency distribution of the parameter "Filling":
In the regression analysis, you can see the correlation between the two parameters "Filling"
and "Purifier":
MindSphere app SIMATIC Energy Manager
40 Application Manual, 07/2020, A5E49285137-ACData analysis
5.8 Visualizing the intensity of data values (Heatmap)
5.8 Visualizing the intensity of data values (Heatmap)
Description
Using the Heatmap, you can visualize the intensity of data values over time. You can, for
example, display the energy consumption (red = high energy consumption; green = low energy
consumption), temperatures or production quantities in a specific time range.
The following additional views are also available in the Heatmap:
● Detail view
● Histogram
Procedure
To define widget-specific display options, follow these steps:
1. In the last step, you define the following settings:
– Whether the data is displayed in the day view or the week view.
– The color in which the different intensities are going to be displayed.
– You can enter a fixed range for the color scaling.
If you do not define fixed values, the lowest and the highest measured value is used for
the color scale. This may result in a distorted picture displayed by the heatmap in case
of extreme peaks.
MindSphere app SIMATIC Energy Manager
Application Manual, 07/2020, A5E49285137-AC 41Data analysis
5.8 Visualizing the intensity of data values (Heatmap)
Result
The Heatmap shows the energy consumptions for the entire month of October (y-axis), broken
down by each day (x-axis). You can see at a glance that frequent energy peaks occurred
between 0:00 and 12:00 o'clock and that energy consumption was lower in the afternoon and
evening.
In the detail view, you can see the graph of the "Electricity_Consumption" parameter in the color
that you have defined in the display options:
MindSphere app SIMATIC Energy Manager
42 Application Manual, 07/2020, A5E49285137-ACYou can also read


