ADVANCED RECEIVER AUTONOMOUS INTEGRITY MONITORING PERFORMANCE ANALYSIS REPORT
←
→
Page content transcription
If your browser does not render page correctly, please read the page content below
Satellite Navigation Branch, ANG-E66

ADVANCED RECEIVER AUTONOMOUS INTEGRITY
MONITORING PERFORMANCE ANALYSIS REPORT

                         June 2021

                           Report #3
         Reporting Period: July 1 to September 30, 2020

            FAA William J. Hughes Technical Center
      Atlantic City International Airport, New Jersey 08405
                     http:/www.nstb.tc.faa.gov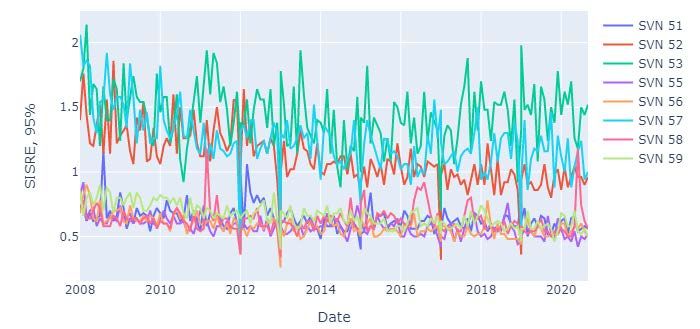
ARAIM Performance Analysis Report

            DOCUMENT VERSION CONTROL

VERSION      DESCRIPTION OF CHANGE                           DATE

  0.1                  Initial Draft                       05/17/2021

  0.2                   Tech Edit                          05/27/2021

  0.3     Added Appendix B and Additional Edits            06/07/2021

  0.4                 Peer Review                          06/21/2021

  1.0                 Final Report                         06/21/2021

                               ii                               June 2021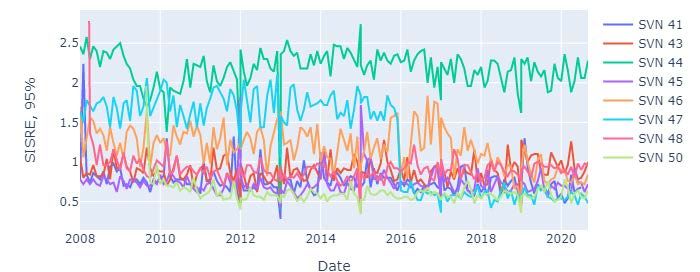
ARAIM Performance Analysis Report

                                     EXECUTIVE SUMMARY

This is the third quarterly report of 2020 by the United States Federal Aviation Administration
(FAA) documenting the performance of the Global Positioning System (GPS) for use in Advanced
Receiver Autonomous Integrity Monitoring (ARAIM). ARAIM will be used during aircraft flight
operations to assure integrity of the satellite signals, which will permit aircraft to safely navigate
worldwide in all phases of flight, including precision landing. The results in this report are intended
for further discussion and validation of ARAIM standards. They are not intended for comparison
to GPS performance commitments at this time.

This report is produced by the FAA William J Hughes Technical Center, Satellite Navigation
Branch, ANG-E66. The Satellite Navigation Branch also provides monitoring and reporting
services on U.S. GPS performance and the FAA Wide Area Augmentation System (WAAS) in the
GPS Standard Positioning Service Performance Analysis Report (PAN) and the WAAS PAN
report, respectively.

For ARAIM, a global array of GPS receivers is used to monitor signals from every GPS satellite,
and those signals are analyzed to determine performance. Standards for ARAIM are evolving, and
performance requirements will be published in the near future. In support of those requirements,
signal monitoring is required to ensure that performance meets the standards, and to calculate the
integrity parameters used to characterize the system. This report provides the current results of that
monitoring.

ARAIM PAN Report #3 includes data and analysis for July 1, 2020 through September 30, 2020.
Also presented, for historical comparison and long-term trend analysis, are performance data from
January 1, 2008 to September 30, 2020. The report presents measured accuracy and integrity
parameters and provides analysis to support the development of the GPS Integrity Support
Message (ISM).

The following parameters are currently under consideration for ARAIM user calculation of service
integrity: tcorrel, bnom0, γnom, Rsat, Pconst, mean fault duration (MFD), service level, and mask. In this
report, the parameters Rsat, Pconst, and MFD are considered to be most mature, and are included. As
standards mature, a complete definition of these parameters and their use will be available, and the
report will provide the full complement of ARAIM parameters.

In this quarter, GPS continued to perform well, and there were no faults detected. The specified
probability of a single satellite fault (Rsat) is currently 10-5, the probability of multiple common
cause faults (Pconst) is currently 10-8, and the MFD is currently 1 hour; all of these values are
consistent with GPS Constellation Service Provider (CSP) commitments.

                                                   iii                                        June 2021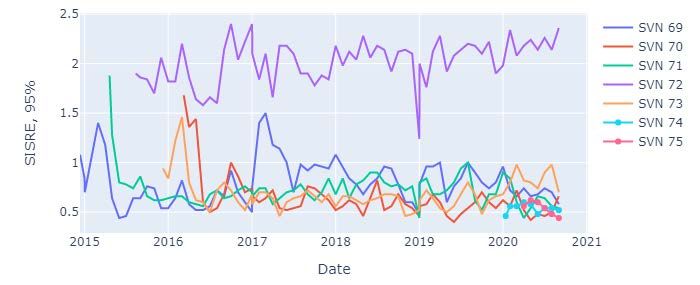
ARAIM Performance Analysis Report

The maximum mean, 68%, and 95% values of the aggregated instantaneous Signal-in-Space
Range Error (SISRE) across 200 user locations in this quarter were 0.336 m on SVN 63, 1.22 m
on SVN 65, and 2.42 m on SVN 65, respectively.

Nominal clock and ephemeris errors for all satellites were conservatively described by the GPS
broadcast user range accuracy (URA). In this quarter, URAs overbounded all nominal range errors
with the maximum scale factor of 0.468 on SVN 65. The URA value of 2.4 m was broadcast
93.191% of the time, in line with historical performance.

The monthly mean and 95% value of the aggregated instantaneous SISREs in this quarter, of all
satellites across 200 user locations, were consistent with historical performance, with the majority
of the means under 0.1 m and the majority of the 95% values under 1 m. The highest mean was
0.224 m on SVN, and the highest 95% value was 2.560 m on SVN 65.

                                                 iv                                      June 2021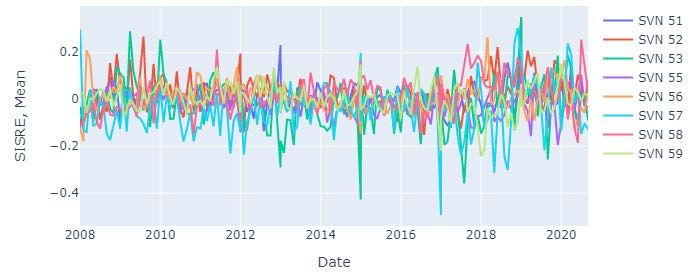
ARAIM Performance Analysis Report

                                                 TABLE OF CONTENTS

1.      INTRODUCTION .............................................................................................................. 1
        1.1       System Overview .................................................................................................... 1
        1.2       Purpose.................................................................................................................... 1
        1.3       Scope ....................................................................................................................... 1
        1.4       Report Layout ......................................................................................................... 2
2.      GPS ISM PARAMETER MONITORING ......................................................................... 2
        2.1       Data ......................................................................................................................... 4
                  2.1.1      Data Source and Rate .................................................................................. 4
                  2.1.2      Data Collection and Cleansing.................................................................... 4
                  2.1.3      Error Computation and Anomaly Detection ............................................... 4
                  2.1.4      Data Partitioning ......................................................................................... 8
                  2.1.5      Data Limitations........................................................................................ 10
                  2.1.6      Data Analysis ............................................................................................ 10
        2.2       Nominal Accuracy and URA Bounding ............................................................... 11
                  2.2.1      Broadcast URA ......................................................................................... 11
                  2.2.2      Nominal Accuracy .................................................................................... 16
                  2.2.3      URA Bounding of Nominal Accuracy ...................................................... 31
                  2.2.4      URA Bounding of Nominal Position Accuracy........................................ 46
        2.3       Fault Probability.................................................................................................... 49
                  2.3.1      List of Events ............................................................................................ 51
APPENDIX A: GLOSSARY AND ACRONYMS ...................................................................... 55

                                                                     v                                                            June 2021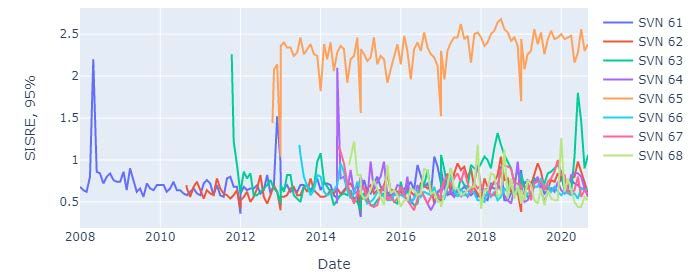
ARAIM Performance Analysis Report

                                                     LIST OF FIGURES

Figure 2-1. 200 User Locations ...................................................................................................... 5
Figure 2-2. Satellite Data, 3rd Quarter 2020................................................................................... 7
Figure 2-3. Relative Frequency of URA, January 1, 2008 to September 30, 2020 ...................... 12
Figure 2-4. Relative Frequency of URA, 3rd Quarter 2020 ......................................................... 14
Figure 2-5. Radial, Cross-Track, Along-Track, and SISRE Errors Box Plot,
           3rd Quarter 2020 ......................................................................................................... 19
Figure 2-6. Radial, Cross-Track, Along-Track, and SISRE Errors (PDF),
           3rd Quarter 2020 ......................................................................................................... 20
Figure 2-7. Monthly Mean SISRE for SVN 41 to SVN 50, January 1, 2008 to
           September 30, 2020 .................................................................................................... 21
Figure 2-8. Monthly Mean SISRE for SVN 51 to SVN 59, January 1, 2008 to
           September 30, 2020 .................................................................................................... 21
Figure 2-9. Monthly Mean SISRE for SVN 61 to 68, January 1, 2008 to
           September 30, 2020 .................................................................................................... 22
Figure 2-10. Monthly Mean SISRE for SVN 69 to 75, January 1, 2008 to
           September 30, 2020 .................................................................................................... 22
Figure 2-11. Monthly 95% SISRE for SVN 41 to SVN 50, January 1, 2008 to
           September 30, 2020 .................................................................................................... 23
Figure 2-12. Monthly 95% SISRE for SVN 51 to SVN 59, January 1, 2008 to
           September 30, 2020 .................................................................................................... 23
Figure 2-13. Monthly 95% SISRE for SVN 61 to SVN 68, January 1, 2008 to
           September 30, 2020 .................................................................................................... 24
Figure 2-14. Monthly 95% SISRE for SVN 69 to SVN 75, January 1, 2008 to
           September 30, 2020 .................................................................................................... 24
Figure 2-15. Monthly Mean SISRE for SVN 41 to SVN 50, 3rd Quarter 2020 .......................... 26
Figure 2-16. Monthly Mean SISRE for SVN 51 to SVN 59, 3rd Quarter 2020 .......................... 26
Figure 2-17. Monthly Mean SISRE for SVN 61 to SVN 68, 3rd Quarter 2020 .......................... 27
Figure 2-18. Monthly Mean SISRE for SVN 69 to SVN 75, 3rd Quarter 2020 .......................... 27
Figure 2-19. Monthly 95% SISRE for SVN 41 to SVN 50, 3rd Quarter 2020 ........................... 28
Figure 2-20. Monthly 95% SISRE for SVN 51 to SVN 59, 3rd Quarter 2020 ........................... 28
Figure 2-21. Monthly 95% SISRE for SVN 61to SVN 68, 3rd Quarter 2020 ............................ 29

                                                                  vi                                                     June 2021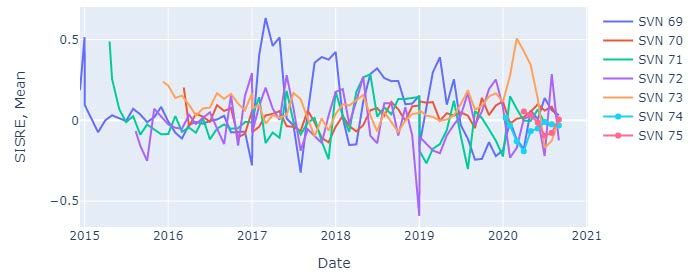
ARAIM Performance Analysis Report

Figure 2-22. Monthly 95% SISRE for SVN 69 to SVN 75, 3rd Quarter 2020 ........................... 29
Figure 2-23. PDF Normalized MPE Composite, 3rd Quarter 2020 ............................................. 32
Figure 2-24. 1-CDF Normalized MPE for SVN 41 to SVN 50, 3rd Quarter 2020 ...................... 33
Figure 2-25. 1-CDF Normalized MPE for SVN 51 to SVN 59, 3rd Quarter 2020 ...................... 34
Figure 2-26. 1-CDF Normalized MPE for SVN 61 to 68, 3rd Quarter 2020 ............................... 35
Figure 2-27. 1-CDF Normalized MPE for SVN 69 to SVN 75, 3rd Quarter 2020 ...................... 36
Figure 2-28. 1-CDF Normalized MPE by Block Type, 3rd Quarter 2020 ................................... 37
Figure 2-29. PDF Normalized SISRE Composite, 3rd Quarter 2020 ........................................... 38
Figure 2-30. 1-CDF Normalized SISRE for SVN 41 to SVN 50, 3rd Quarter 2020.................... 39
Figure 2-31. 1-CDF Normalized SISRE for SVN 51 to SVN 59, 3rd Quarter 2020.................... 40
Figure 2-32. 1-CDF Normalized SISRE for SVN 61 to SVN 68, 3rd Quarter 2020.................... 41
Figure 2-33. 1-CDF Normalized SISRE for SVN 69 to SVN 75, 3rd Quarter 2020.................... 42
Figure 2-34. 1-CDF Normalized SISRE by Block Type, 3rd Quarter 2020................................. 43
Figure 2-35. Ratio of Bounding Sigma for URA = 2.4 m, 3rd Quarter 2020 ............................... 46
Figure 2-36. 1-CDF Chi-Square of Normalized SISREs, 3rd Quarter 2020 ................................ 48
Figure 2-37. Estimated Satellite Narrow Fault Rate ..................................................................... 51

                                                           vii                                                June 2021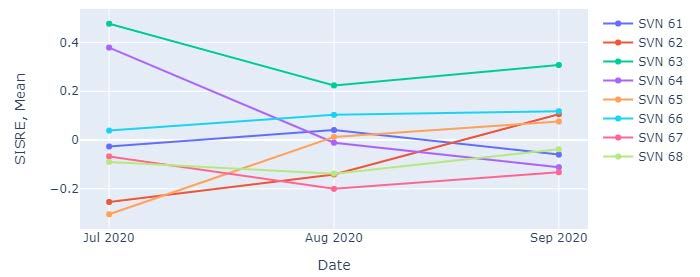
ARAIM Performance Analysis Report

                                                        LIST OF TABLES

Table 2-1. GPS SPS Instantaneous User Range Error Integrity Standards .................................... 3
Table 2-2. Satellite Data, 3rd Quarter 2020 .................................................................................... 8
Table 2-3. PRN Assignment by SVN ............................................................................................. 9
Table 2-4. Relative Frequency of URA, January 1, 2008 to September 30, 2020 ....................... 13
Table 2-5. Relative Frequency of URA, 3rd Quarter 2020........................................................... 15
Table 2-6. Radial, Cross-Track, Along-Track, and SISRE Errors, 3rd Quarter 2020 .................. 17
Table 2-7. Monthly Mean and 95% SISRE, January 1, 2008 to September 30, 2020.................. 25
Table 2-8. Monthly Mean and 95% SISRE, 3rd Quarter 2020 ..................................................... 30
Table 2-9. Ratio of Bounding Sigma to URA, 3rd Quarter 2020 ................................................. 45
Table 2-10. GPS Faults from January 1, 2008 to September 30, 2020......................................... 49
Table 2-11. Events ........................................................................................................................ 52

                                                                    viii                                                       June 2021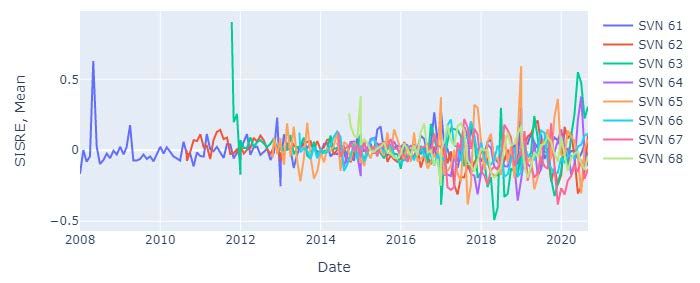
ARAIM Performance Analysis Report

1.     INTRODUCTION

This report documents the performance of the Global Navigation Satellite System (GNSS), which
supports Advanced Receiver Autonomous Integrity Monitoring (ARAIM) for worldwide flight
operations. ARAIM uses signals, validated for safety-of-flight use, from multiple satellite
constellations without the use of an external augmentation system. ARAIM has the potential to
reduce costs for service providers and aircraft operators. In its mature state, it will be able to
provide worldwide precision approach capability to any location on earth and support expanded
service to remote and unimproved areas.

This report is produced by the United States (US) Federal Aviation Administration (FAA) William
J Hughes Technical Center, Satellite Navigation Branch, ANG-E66, in Atlantic City, New Jersey.
The Satellite Navigation Branch also provides monitoring and reporting services on US Global
Positioning System (GPS) performance and the FAA Wide Area Augmentation System (WAAS).
These reports are titled Global Positioning System Standard Positioning Service Performance
Analysis Report and Wide Area Augmentation System Performance Analysis Report, respectively.

1.1    System Overview

ARAIM is intended to support navigation for en route, terminal, and approach flight operations by
detecting hazardous faults in the underlying GNSS without the use of external augmentation
systems. Making use of the increasing number of available ranging satellites, ARAIM determines
the probabilities of one or more simultaneous fault occurrences and calculates an integrity level.
ARAIM updates are contained in the Integrity Support Message (ISM), provided by ground
monitoring networks that maintain continuous worldwide GNSS coverage. A more detailed
operational description is found in ARAIM Concept of Operation [1].

1.2    Purpose

The purpose of this report is to document the ARAIM-related performance parameters of the core
constellations that will support ARAIM flight operations and to provide that information to users,
operators, and regulators.

1.3    Scope

This report currently focuses on the ARAIM-related performance parameters of GPS and the
ability to support worldwide flight operations using ARAIM. For future reports, operational use
of ARAIM is planned to be implemented in phases, first for horizontal navigation and later
expanded to include vertical navigation.

                                                1                                      June 2021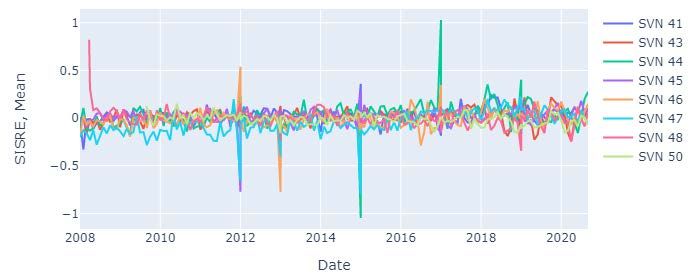
ARAIM Performance Analysis Report

1.4        Report Layout

This report presents several types of ARAIM performance information, including nominal GPS
accuracy and statistical distributions, satellite faults and estimated fault rates, historical
performance, and verification of some of the underlying assumptions of the defining algorithms.

Data is presented in Section 2.1, including the data source, data cleansing, processing, and analysis.
This section also discusses the partitioning of the data and some of the data limitations.

Nominal GPS performance is presented in Section 2.2, including nominal errors and user range
accuracy (URA), along with statistical error distributions and URA bounding analysis. This section
also provides correlation analysis of the nominal error at each user position.

Satellite faults are presented in Section 2.3, including estimated fault rates and historical fault
information. Section 2.3 also contains a list with descriptions of any significant or unusual events,
such as satellite or monitoring system failures or other unexpected events that impact performance.

2.         GPS ISM PARAMETER MONITORING

The ARAIM ISM parameter offline monitoring effort provides for the monitoring of the safety
parameters that will be communicated to users through the ISM, including:

      1.   An overbound of the probability or rate of single satellite faults (Psat or Rsat).
      2.   An overbound of the probability or rate of multiple simultaneous faults (Pconst or Rconst).
      3.   An overbound of nominal range errors (URA).
      4.   A URA-independent overbound of nominal range bias errors (bnom0).
      5.   A URA-dependent overbound of nominal range bias errors (γnom).
      6.   An overbound of the mean fault duration (MFD).
      7.   tCORREL, the correlation time constant.
      8.   Service Level.
      9.   Mask.

These parameters are based on Constellation Service Provider (CSP) commitments and
performance history. They must conservatively describe the true satellite behavior in order to be
used to predict integrity. Constellation performance is monitored continually to ensure consistency
with those commitments.

The results of offline monitoring of the γnom, tCORREL, bnom0, service level, and satellite mask will
be included in future reports, if required, as standards evolve.

Table 2-1 is a copy of the integrity guarantee as defined in the GPS Standard Positioning Service
Performance Standard (SPS PS) [2]. The SPS PS states that the probability of a satellite fault will

                                                     2                                        June 2021
ARAIM Performance Analysis Report
be no greater than 10-5 per hour. The commitment further states that users will be notified of major
service failures, or the space vehicle (SV) will be removed from service, on average, within 1 hour.
Table 2-1. GPS SPS Instantaneous User Range Error Integrity Standards
Signal-in-Space (SIS) Integrity Standard Conditions and Constraints
• Each SPS SIS Component Combination • Applies to any trackable and healthy SPS
per Table 2.2-2 in the GPS SPS SIS
Performance Standard [2]:
• SPS SIS URE NTE tolerance defined to
• ≤1x10 Probability Over Any Hour of the
-5
be 4.42 times the relevant Integrity
SPS SIS Instantaneous User Range Error Assured User Range Accuracy (IAURA)
(URE) Exceeding the Not-To-Exceed value currently broadcast by the satellite
(NTE) Tolerance Without a Timely Alert
• Given that the maximum SPS SIS
instantaneous URE did not exceed the
NTE tolerance at the start of the hour
• Unalerted Misleading Signal Information
(UMSI) occurs if no timely alert issued
after SPS SIS URE NTE tolerance
exceeded
• Worst case for delayed alert is 6 hours
• Neglecting single-frequency (SF)
ionospheric delay model errors
Instantaneous Psat and Pconst Conditions and Constraints
• ≤ 1x10 Fraction of Time When the SPS
-5
• Applies across all trackable and healthy
SIS Instantaneous URE Exceeds the NTE SPS SIS
Tolerance Without a Timely Alert (Psat) • SPS SIS URE NTE tolerance defined to
be ±4.42 times the relevant IAURA value
• ≤ 1x10⁻⁸ Fraction of Time When the SPS currently broadcast by the satellite
SIS Instantaneous URE from Two or • Average case for delayed alert is 1 hour
More Satellites Exceeds the NTE • Neglecting SF ionospheric delay model
Tolerance Due to a Common Cause errors
Without a Timely Alert (Pconst)
3 June 2021ARAIM Performance Analysis Report
2.1 Data
2.1.1 Data Source and Rate
The offline analysis in this report uses two sources of input data: the GPS broadcast navigation
data and post-processed precise data. The broadcast navigation data consists of satellite orbit and
clock parameters and includes URA values that indicate the expected level of accuracy. The
precise data consists of GPS ephemerides and clock parameters. It is used as the truth reference
and has an accuracy of approximately 10 centimeters [3].
A subset of the GPS broadcast legacy navigation (LNAV) data is available from the International
GNSS Service (IGS) in Receiver Independent Exchange (RINEX) navigation file format [4].
Precise GPS ephemerides and clock are available from the National Geospatial-Intelligence
Agency (NGA) in the Standard Product #3 (SP3) format [3].
This report includes historical GPS constellation performance from January 1, 2008 to September
30, 2020. Data were analyzed for every 15-minute interval from January 1, 2008 to February 26,
2012 and every 5-minute interval from February 26, 2012 until September 30, 2020. All available
data were analyzed during the period. The data intervals are determined by capabilities of the IGS
and NGA data sources.
2.1.2 Data Collection and Cleansing
A customized tool is used to automate the data downloads on a daily basis. All data are protected
by checksums and other basic integrity checks. GPS broadcast navigation data is downloaded from
the two IGS archive sites: The Crustal Dynamics Data Information System (CDDIS) [5] and the
Scripps Orbit and Permanent Array Center (SOPAC) [6]. Precise data is downloaded from the
NGA server [7].
The broadcast navigation data, as received in RINEX format from IGS, sometimes contains defects
such as duplications, inconsistencies, discrepancies, and errors that can cause false anomalies. A
cleansing algorithm is applied to the IGS data to generate “validated” navigation messages, which
have as many of these defects removed as possible. This process is based on the algorithm
described by Heng [8].
2.1.3 Error Computation and Anomaly Detection
For each time step where precise data is available, the most recent prior validated broadcast
navigation data is used to propagate the satellite orbits and clocks. To account for clock offset in
the precise product, at each epoch, the clock residuals between healthy precise and broadcast
products are filtered for outliers, then a mean correction is applied to the NGA precise clock
estimate. At each data point for which both sources indicate a healthy signal and valid data within
the fit interval, the satellite position error is determined by calculating the difference between the
4 June 2021ARAIM Performance Analysis Report
NGA-derived reference value and the calculated, propagated satellite position, in Earth-Centered,
Earth-Fixed (ECEF) coordinates. The errors are segregated into radial, along-track, and cross-track
(RAC) errors. The satellite position error is also projected onto Earth at each epoch to produce the
maximum projected error (MPE), and projected along the lines of sight to individual user locations
on Earth to produce User Projected Error (UPE). MPE and UPE are two forms of signal-in-space
range error (SISRE) that are used to evaluate the error distributions.
In this report, 200 evenly distributed user locations around the globe were used to calculate UPE.
This density was determined to be sufficient such that a value within 2 cm of the actual MPE will
be observed at one or more of the user locations [9]. MPE is computed for each satellite, at each
epoch. UPE is computed for each of the 200 user locations, for each satellite in view, for each
epoch. A mask angle of 5 degrees is used for MPE and UPE computations. UPEs across satellites
are also combined to create a position error at each of the 200 user locations, at each epoch, and a
sum of squared residuals statistic is computed. Figure 2-1 shows the 200 user locations.
Figure 2-1. 200 User Locations
The GPS SPS PS considers an integrity error has occurred if the SISRE is greater than 4.42* URA
(see Table 2-1). This report uses a conservative criterion, MPE, to determine if an error has
occurred. A potential signal-in-space (SIS) anomaly is reported when MPE exceeds the 4.42* URA
threshold.
Figure 2-2 shows an overview of data availability for the individual months in this quarter. The
vertical axis identifies each satellite by their space vehicle number (SVN) and block type. Each
horizontal line indicates health and status for an individual satellite. Green indicates that the
5 June 2021ARAIM Performance Analysis Report
vehicle was set healthy, broadcast ephemeris were received, and a valid comparison to the precise
ephemeris was obtained. Blue indicates that the vehicle was set unhealthy; therefore, no
comparison was available. Purple indicates that no broadcast ephemeris was obtained from the
IGS database, and orange indicates that the precise ephemeris was not obtained. In each of those
cases, the state of the vehicle was undetermined. The final case, shown by a red circle, indicates
that a fault anomaly was detected, and the event will be described in Table 2-11.
6 June 2021ARAIM Performance Analysis Report
Figure 2-2. Satellite Data, 3rd Quarter 2020
7 June 2021ARAIM Performance Analysis Report
Table 2-2 shows the sample counts and the percentages of satellite data for this quarter. A total of
796,972 samples were evaluated this quarter with no fault detected. The data that were not
evaluated corresponded to satellites flagged “Unhealthy.” During the quarter, SVN 41 (pseudo-
random noise (PRN)14) was set unhealthy and decommissioned on July 9 (see NANU2020034).
Also, several satellites were set to "Unusable" for short periods of time. These include: SVN 57
(PRN29) on July 9 (see NANU2020032); SVN 74 (PRN04) on July 14 (See NANU2020036);
SVN 56 (PRN16) on August 6 (see NANU2020038); SVN 43 (PRN13) on August 21 (see
NANU2020040); SVN 74 (PRN4) on September 20 (see NANU2020043); SVN 70 (PRN32) on
September 22 (see NANU2020044).
Table 2-2. Satellite Data, 3rd Quarter 2020
Number of Percentage of
Data Evaluation
Samples Total
Valid Data Evaluation 796972 99.952%
No Evaluation due to SV Unhealthy 381 0.048%
No Evaluation due to Exceeding 4-hour Fit Interval 0 0.000%
No Evaluation due to Precise Data Event Flag 3 0.000%
No Evaluation due to Broadcast Data Unavailable 0 0.000%
No Evaluation due to Precise Data Unavailable 0 0.000%
Faults 0 0.000%
2.1.4 Data Partitioning
Performance is analyzed and presented using several data partitions to show various dependencies.
These include time, the individual satellite, the satellite block type, the URA value, or
combinations of these. Individual satellites may be identified using either an SVN or a PRN
number. SVN, or sometimes SV, is an unambiguous number that is assigned when the spacecraft
is built. PRNs are reused as vehicles are retired or added to the operational on-orbit constellation.
This report uses the SVN to uniquely identify the individual SV. See Table 2-3 for the current
PRN assignments this quarter, which are used in this report.
8 June 2021ARAIM Performance Analysis Report
Table 2-3. PRN Assignment by SVN
PRN SV Block Type
1 63 IIF
2 61 IIR
3 69 IIF
4 74 III
5 50 IIR-M
6 67 IIF
7 48 IIR-M
8 72 IIF
9 68 IIF
10 73 IIF
11 46 IIR
12 58 IIR-M
13 43 IIR
14 77 III
15 55 IIR-M
16 56 IIR
17 53 IIR-M
18 75 III
19 59 IIR
20 51 IIR
21 45 IIR
22 47 IIR
23 76 III
24 65 IIF
25 62 IIF
26 71 IIF
27 66 IIF
28 44 IIR
29 57 IIR-M
30 64 IIF
31 52 IIR-M
32 70 IIF
9 June 2021ARAIM Performance Analysis Report
2.1.5 Data Limitations
SIS anomalies are listed in Table 2-11. There are some limitations of SIS anomaly reporting due
to potential errors in the source data or missing source data. Some limitations include:
1. False SIS anomalies may be reported due to errors in the precise ephemerides/clock or
errors in the validated navigation messages.
2. Short-duration SIS anomalies may not be reported if they happen to fall within the 5- or
15-minute gaps of the precise ephemerides/clocks.
3. True SIS anomalies may not be detected if the precise ephemerides/clocks, or LNAV data,
are temporarily missing or incorrect, for any reason.
2.1.6 Data Analysis
The goal of the data analysis process is to determine whether the behavior of the observed data is
consistent with the underlying assumptions and the CSP commitments.
The first step in the process is to remove, as completely as possible, any errors which have been
introduced by the data collection process itself. These include transmission errors, incomplete data
sets from an individual source, conflicting data from separate sources, or any other known error
type.
The next step is the nominal performance analysis, to ensure that the nominal observed error
distributions are Gaussian and bounded by the URA, as defined in the SPS PS. The error
characteristic is observed in the probability density function (PDF) plots of the RAC, clock, and
SISRE errors.
A sigma overbounding and the ratio of the minimum overbounding sigma to the broadcast URA
and the Gaussian curve are computed. A PDF of SISREs is used to observe the core of the error
distribution, and a cumulative distribution function (CDF) is used to observe the tail behavior.
Correlation of errors is also checked to ensure that the individual ranging errors do not combine to
form unexpectedly large position errors. The sum of the squares of the URA-normalized residuals
is computed for each time step and user, and all samples are combined in a single distribution.
Correlated residuals will be indicated by a sum of square residuals distribution that exceeds a chi-
square distribution.
After the signal performance analysis, any potential faults are analyzed. That analysis will provide,
at a minimum, the date, time, and duration of the fault, as well as the overall effect on fault rates
and probabilities. A description of the potential fault will be provided, as well as the basis used to
identify it. If possible, the initial cause of the fault will also be determined and described, along
with any associated maintenance action taken.
10 June 2021ARAIM Performance Analysis Report
The data in this report are presented using different views and data partitions to describe
performance more completely. The different types of views include statistical plots, such as
probability, residual error over time, histograms, one minus CDF (1-CDF) plots, and data tables,
partitioned by satellite, block types, and composite. These views show: overbounding of the
measured data by the integrity parameters, comparison of residuals (based on an independent
reference) of orbital and clock parameters, presentation of range error in different units and
coordinate systems, projected user errors, and comparison to historical performance.
2.2 Nominal Accuracy and URA Bounding
GPS satellites broadcast URA values to indicate the expected level of accuracy. The URA
represents a 1-sigma value that conservatively characterizes the nominal signal accuracy. Offline
monitoring of the URA parameter assesses the integrity of the ephemeris and clock data in the
broadcast navigation messages, by evaluating the URA bounding performance of nominal, fault-
free range errors. The observed error distributions are examined to evaluate how well the URA
describes them.
2.2.1 Broadcast URA
Broadcast URA values are shown in Figure 2-3 and Table 2-4 for data from January 1, 2008 to
September 30, 2020, and Figure 2-4 and Table 2-5 for the 3rd Quarter 2020. The figures and tables
show the relative frequency of different broadcast values by satellite, block type, and across the
whole constellation.
The URA index of 1, corresponding to 2.4 m, is the most common URA value since January 1,
2008. This value was sent 92.064% of the time for all satellites, and the next most common index
value of 2, corresponding to 3.4 m, was sent 7.214% of the time; both values combined accounted
for 99.278% of all broadcast URA.
For this quarter, the URA value of 2.4 m is sent 93.191% of the time and 3.4 m is sent is 6.182%
of the time; both values combined accounted for 99.373% of all broadcast URA.
11 June 2021ARAIM Performance Analysis Report
Figure 2-3. Relative Frequency of URA, January 1, 2008 to September 30, 2020
12 June 2021ARAIM Performance Analysis Report
Table 2-4. Relative Frequency of URA, January 1, 2008 to September 30, 2020
Relative Frequency (%) of Broadcast URA Values (m)
Block/SVN
2.4 (m) 3.4 (m) 4.85 (m) 6.85 (m)
ALL 92.064 7.214 0.685 0.028
BLOCK IIF 92.964 6.834 0.169 0.018
BLOCK IIR-A 90.424 8.057 1.476 0.037
BLOCK IIR-B 91.104 7.756 1.099 0.037
BLOCK IIR-M 93.041 6.625 0.298 0.028
BLOCK III 96.579 3.321 0.100 N/A
41 92.750 6.952 0.250 0.032
43 94.350 5.567 0.061 0.012
44 69.944 22.869 7.173 0.010
45 92.429 6.129 1.400 0.042
46 90.397 8.193 1.287 0.121
47 81.323 15.638 2.986 0.049
48 93.242 5.253 1.416 0.086
50 97.834 2.078 0.066 0.011
51 96.953 2.939 0.086 0.015
52 93.960 5.593 0.401 0.031
53 85.483 14.438 0.055 0.009
55 96.173 3.782 0.029 0.016
56 96.211 3.712 0.043 0.029
57 88.853 11.043 0.082 0.013
58 96.009 3.928 0.036 0.028
59 97.026 2.911 0.029 0.028
61 94.957 4.723 0.282 0.035
62 95.955 3.958 0.074 0.009
63 94.653 5.161 0.164 0.011
64 94.708 5.224 0.049 0.018
65 74.611 25.013 0.354 0.021
66 95.907 4.078 0.008 0.007
67 97.956 1.920 0.063 0.035
68 96.281 3.633 0.047 0.021
69 91.378 7.651 0.887 0.041
70 95.179 4.631 0.087 0.038
71 94.818 5.087 0.046 0.013
72 89.478 10.256 0.248 0.009
73 98.299 1.692 0.009 N/A
74 99.091 0.900 0.009 N/A
75 92.978 6.793 0.229 N/A
13 June 2021ARAIM Performance Analysis Report
Figure 2-4. Relative Frequency of URA, 3rd Quarter 2020
14 June 2021ARAIM Performance Analysis Report
Table 2-5. Relative Frequency of URA, 3rd Quarter 2020
Relative Frequency (%) of Broadcast
Block/SVN URA Values (m)
2.4 (m) 3.4 (m) 4.85 (m) 6.85 (m)
ALL 93.191 6.182 0.614 0.014
BLOCK IIF 91.646 8.270 0.049 0.035
BLOCK IIR-A 90.459 6.616 2.925 N/A
BLOCK IIR-B 98.236 1.764 N/A N/A
BLOCK IIR-M 94.789 5.206 0.005 N/A
BLOCK III 97.626 2.361 0.013 N/A
41 99.762 0.238 N/A N/A
43 99.057 0.943 N/A N/A
44 57.341 24.849 17.810 N/A
45 96.101 3.899 N/A N/A
46 94.746 5.254 N/A N/A
47 99.740 0.260 N/A N/A
48 96.954 3.046 N/A N/A
50 99.762 0.238 N/A N/A
51 99.668 0.332 N/A N/A
52 97.222 2.778 N/A N/A
53 87.153 12.847 N/A N/A
55 98.770 1.230 N/A N/A
56 94.996 5.004 N/A N/A
57 85.929 14.033 0.038 N/A
58 97.709 2.291 N/A N/A
59 97.037 2.963 N/A N/A
61 97.932 2.068 N/A N/A
62 95.192 4.808 N/A N/A
63 77.653 22.320 0.026 N/A
64 94.531 5.469 N/A N/A
65 65.357 34.171 0.472 N/A
66 96.116 3.884 N/A N/A
67 96.637 3.363 N/A N/A
68 99.555 0.445 N/A N/A
69 99.645 0.355 N/A N/A
70 98.703 0.787 0.091 0.420
71 94.943 5.057 N/A N/A
72 81.805 18.195 N/A N/A
73 99.626 0.374 N/A N/A
74 99.268 0.705 0.027 N/A
75 95.992 4.008 N/A N/A
15 June 2021ARAIM Performance Analysis Report
2.2.2 Nominal Accuracy
Orbit, clock, and projected range errors are shown in this section, first for the current quarter and
then for the historical data for GPS beginning January 1, 2008. The errors consist of RAC, clock,
and the aggregated SISREs across 200 user locations, for the quarter. Table 2-6 shows the mean,
68%, and 95% values for RAC, clock, and SISRE errors by satellite, block type, and the aggregated
total. The maximum SISRE mean was 0.336 m on SVN 63, the maximum SISRE 68% value was
1.220 m on SVN65, and the maximum SISRE 95% was 2.420 m on SVN 65.
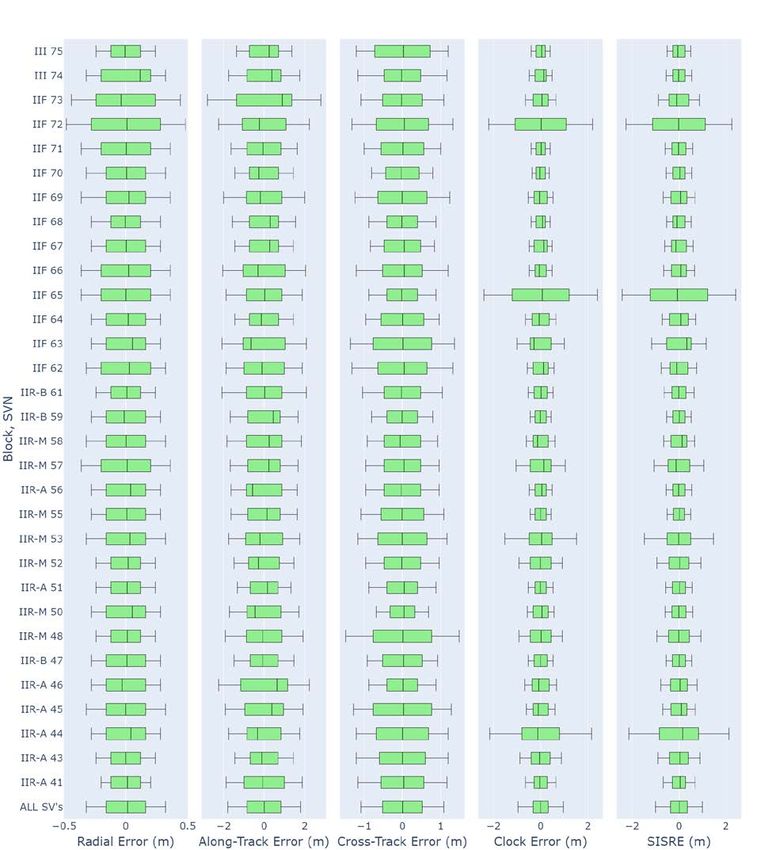
Figure 2-5 shows plots of the same values by satellite and in composite. The green segment
represents the (68%) area of the error distribution, and the upper and lower fences represent the
(95%) area of the error distribution. The center tick value is the mean of the nominal error
distribution (satellite range errors exceeding 4.42 times URA are excluded from this nominal
assessment.) The scale for each parameter is adjusted to focus on the range of most interest.
Figure 2-6 shows the aggregated PDF of the same errors. For this quarter, the majority of the errors
appear nearly Gaussian, with the radial errors as the smallest and along-track errors as the largest.
The aggregated SISRE across 200 user locations and clock errors agree fairly well. There seems
to be a small subset of data with larger variance than the overall dataset taken as a whole,
particularly for the clock errors, below the 10-3 level. There are significantly larger errors below
the 10-5 level. These are consistent with the SPS PS, which guarantees performance to the 10-5
level.
16 June 2021ARAIM Performance Analysis Report
Table 2-6. Radial, Cross-Track, Along-Track, and SISRE Errors, 3rd Quarter 2020
Radial Along-track Cross-Track Clock SISRE
SVN Block
Mean 68% 95% Mean 68% 95% Mean 68% 95% Mean 68% 95% Mean 68% 95%
41 0.014 0.120 0.200 -0.062 1.000 1.880 0.040 0.560 1.160 -0.045 0.280 0.640 0.061 0.280 0.680
43 0.000 0.120 0.240 -0.120 0.680 1.440 0.007 0.600 1.200 -0.051 0.400 0.880 0.050 0.400 0.900
44 0.041 0.160 0.280 -0.329 0.840 1.760 0.009 0.680 1.200 -0.127 0.800 2.160 0.166 0.840 2.140
BLOCK
45 0.000 0.160 0.320 0.380 0.960 1.920 0.033 0.760 1.280 -0.108 0.320 0.600 0.108 0.340 0.700
IIR-A
46 -0.031 0.160 0.280 0.634 1.160 2.240 0.022 0.400 0.880 -0.088 0.360 0.680 0.057 0.360 0.780
51 0.011 0.120 0.240 0.167 0.680 1.320 0.051 0.400 0.880 -0.018 0.240 0.520 0.028 0.280 0.560
56 0.039 0.160 0.280 -0.568 0.880 1.640 -0.034 0.480 0.960 0.057 0.240 0.480 -0.020 0.260 0.540
47 0.010 0.160 0.280 -0.062 0.680 1.480 0.034 0.520 0.920 0.000 0.280 0.520 0.009 0.280 0.540
BLOCK
59 -0.012 0.160 0.280 0.450 0.800 1.680 -0.004 0.400 0.800 -0.023 0.240 0.440 0.011 0.260 0.520
IIR-B
61 0.009 0.120 0.240 0.037 0.880 2.080 -0.022 0.480 1.040 0.024 0.280 0.520 -0.015 0.300 0.640
48 0.013 0.120 0.240 -0.078 0.880 1.920 0.017 0.760 1.480 0.026 0.440 0.920 -0.015 0.440 0.940
50 0.052 0.160 0.280 -0.448 0.840 1.720 0.047 0.320 0.680 0.063 0.320 0.560 -0.012 0.300 0.580
52 0.019 0.120 0.240 -0.285 0.760 1.480 -0.011 0.480 0.960 -0.018 0.440 0.920 0.037 0.420 0.940
BLOCK
53 0.033 0.160 0.320 -0.211 0.920 1.760 0.001 0.640 1.160 0.050 0.480 1.520 -0.017 0.500 1.480
IIR-M
55 0.009 0.160 0.280 0.147 0.800 1.640 -0.004 0.560 1.080 -0.007 0.240 0.440 0.015 0.240 0.500
57 0.012 0.200 0.360 0.238 0.800 1.680 0.046 0.480 0.960 0.138 0.440 1.040 -0.126 0.460 1.060
58 0.003 0.160 0.320 0.251 0.880 1.840 -0.063 0.480 0.920 -0.136 0.320 0.600 0.140 0.340 0.660
17 June 2021ARAIM Performance Analysis Report
Radial Along-track Cross-Track Clock SISRE
SVN Block
Mean 68% 95% Mean 68% 95% Mean 68% 95% Mean 68% 95% Mean 68% 95%
62 0.029 0.200 0.320 -0.111 1.000 1.880 0.050 0.640 1.320 0.127 0.320 0.560 -0.099 0.380 0.760
63 0.053 0.160 0.280 -0.641 1.040 2.080 0.019 0.760 1.360 -0.284 0.440 1.000 0.336 0.520 1.160
64 0.020 0.160 0.280 -0.146 0.720 1.440 0.011 0.560 0.960 -0.069 0.360 0.640 0.088 0.400 0.720
65 0.001 0.200 0.360 0.037 0.880 1.880 -0.014 0.400 0.880 0.075 1.200 2.400 -0.073 1.220 2.420
66 0.024 0.200 0.360 -0.306 1.040 2.040 0.052 0.520 1.200 -0.063 0.240 0.480 0.086 0.320 0.660
67 BLOCK 0.004 0.160 0.280 0.278 0.720 1.440 0.051 0.480 0.840 0.137 0.280 0.480 -0.133 0.320 0.600
68 IIF -0.003 0.120 0.280 0.301 0.720 1.560 -0.010 0.400 0.880 0.085 0.200 0.400 -0.089 0.260 0.520
69 0.025 0.160 0.360 -0.194 0.880 2.000 0.000 0.640 1.240 -0.053 0.280 0.520 0.078 0.340 0.680
70 0.007 0.160 0.320 -0.266 0.720 1.440 -0.034 0.440 0.800 -0.041 0.200 0.360 0.049 0.260 0.540
71 0.005 0.200 0.360 -0.044 0.840 1.640 0.018 0.560 1.000 0.029 0.200 0.400 -0.024 0.300 0.580
72 0.010 0.280 0.480 -0.239 1.080 2.240 0.054 0.680 1.320 0.028 1.080 2.200 -0.019 1.120 2.260
73 -0.038 0.240 0.440 0.900 1.360 2.800 -0.018 0.520 1.080 0.062 0.320 0.640 -0.101 0.420 0.880
74 BLOCK 0.118 0.200 0.320 0.378 0.840 1.760 -0.016 0.480 1.160 0.138 0.240 0.480 -0.022 0.260 0.540
75 III -0.005 0.120 0.240 0.250 0.720 1.360 0.031 0.720 1.200 0.052 0.200 0.400 -0.056 0.260 0.500
18 June 2021ARAIM Performance Analysis Report
Figure 2-5. Radial, Cross-Track, Along-Track, and SISRE Errors Box Plot,
3rd Quarter 2020
19 June 2021ARAIM Performance Analysis Report
Figure 2-6. Radial, Cross-Track, Along-Track, and SISRE Errors (PDF), 3rd Quarter 2020
Historical performance data are presented for all available data since January 1, 2008. Monthly
mean and 95% error bounds on SISRE errors are shown in Figure 2-7 through Figure 2-10. They
show the monthly mean trend by satellite for this period, and the 95% error bounds are shown in
Figure 2-11 to Figure 2-14. Table 2-7 shows the absolute value of the minimum and maximum of
the monthly means and 95% values. The monthly means were mostly under 0.5 m with the high
value of 1.048 m on SVN 44; and the monthly 95% values were mostly under 2.5 m with the high
value of 2.780 m on SVN 44.
place
20 June 2021ARAIM Performance Analysis Report
Figure 2-7. Monthly Mean SISRE for SVN 41 to SVN 50,
January 1, 2008 to September 30, 2020
Figure 2-8. Monthly Mean SISRE for SVN 51 to SVN 59,
January 1, 2008 to September 30, 2020
21 June 2021ARAIM Performance Analysis Report
Figure 2-9. Monthly Mean SISRE for SVN 61 to 68, January 1, 2008 to September 30, 2020
Figure 2-10. Monthly Mean SISRE for SVN 69 to 75, January 1, 2008 to
September 30, 2020
22 June 2021ARAIM Performance Analysis Report
Figure 2-11. Monthly 95% SISRE for SVN 41 to SVN 50,
January 1, 2008 to September 30, 2020
Figure 2-12. Monthly 95% SISRE for SVN 51 to SVN 59,
January 1, 2008 to September 30, 2020
23 June 2021ARAIM Performance Analysis Report
Figure 2-13. Monthly 95% SISRE for SVN 61 to SVN 68,
January 1, 2008 to September 30, 2020
Figure 2-14. Monthly 95% SISRE for SVN 69 to SVN 75,
January 1, 2008 to September 30, 2020
24 June 2021ARAIM Performance Analysis Report
Table 2-7. Monthly Mean and 95% SISRE, January 1, 2008 to September 30, 2020
Mean (m) 95% (m)
SVN
Max Min Max Min
41 0.360 0.000 2.240 0.280
43 0.242 0.000 1.280 0.460
44 1.048 0.000 2.740 0.400
45 0.772 0.000 1.820 0.420
46 0.774 0.000 1.840 0.440
47 0.803 0.002 2.100 0.360
48 0.821 0.000 2.780 0.360
50 0.158 0.000 1.960 0.340
51 0.338 0.000 1.160 0.400
52 0.267 0.000 1.860 0.320
53 0.427 0.001 2.140 0.700
55 0.195 0.000 0.920 0.420
56 0.265 0.000 0.900 0.260
57 0.493 0.000 2.060 0.400
58 0.254 0.000 1.180 0.340
59 0.244 0.000 0.900 0.400
61 0.629 0.002 2.200 0.320
62 0.312 0.000 1.040 0.380
63 0.904 0.002 2.260 0.400
64 0.379 0.001 2.100 0.400
65 0.592 0.005 2.680 1.040
66 0.217 0.001 1.180 0.480
67 0.383 0.000 1.160 0.400
68 0.381 0.001 1.260 0.420
69 0.633 0.001 1.500 0.440
70 0.203 0.001 1.680 0.400
71 0.488 0.002 1.880 0.440
72 0.592 0.002 2.400 1.240
73 0.508 0.002 1.460 0.460
74 0.191 0.010 0.600 0.460
75 0.095 0.005 0.620 0.440
Monthly mean and 95% SISREs for each satellite for this quarter are shown in Figure 2-15 to
Figure 2-22, and the minimum and maximum values are shown in Table 2-8 All of the means were
under the absolute value of 0.5 m, with the high value of 0.477 m on SVN 63. The majority of
95% values were under 2.5 m with the high value of 2.560 m on SVN 65.
25 June 2021ARAIM Performance Analysis Report
Figure 2-15. Monthly Mean SISRE for SVN 41 to SVN 50,
3rd Quarter 2020
Figure 2-16. Monthly Mean SISRE for SVN 51 to SVN 59,
3rd Quarter 2020
26 June 2021ARAIM Performance Analysis Report
Figure 2-17. Monthly Mean SISRE for SVN 61 to SVN 68,
3rd Quarter 2020
Figure 2-18. Monthly Mean SISRE for SVN 69 to SVN 75,
3rd Quarter 2020
27 June 2021ARAIM Performance Analysis Report
Figure 2-19. Monthly 95% SISRE for SVN 41 to SVN 50,
3rd Quarter 2020
Figure 2-20. Monthly 95% SISRE for SVN 51 to SVN 59,
3rd Quarter 2020
28 June 2021ARAIM Performance Analysis Report
Figure 2-21. Monthly 95% SISRE for SVN 61to SVN 68,
3rd Quarter 2020
Figure 2-22. Monthly 95% SISRE for SVN 69 to SVN 75,
3rd Quarter 2020
29 June 2021ARAIM Performance Analysis Report
Table 2-8. Monthly Mean and 95% SISRE, 3rd Quarter 2020
Mean (meters) 95% (meters)
SVN
Min Max Min Max
41 0.061 0.061 0.680 0.680
43 0.009 0.107 0.800 1.000
44 0.024 0.276 2.060 2.280
45 0.061 0.182 0.620 0.740
46 0.040 0.147 0.720 0.840
47 0.005 0.084 0.480 0.600
48 0.009 0.087 0.900 0.980
50 0.007 0.073 0.540 0.640
51 0.024 0.066 0.560 0.580
52 0.029 0.076 0.900 0.960
53 0.017 0.090 1.440 1.520
55 0.026 0.104 0.480 0.520
56 0.034 0.058 0.500 0.600
57 0.103 0.147 0.940 1.240
58 0.032 0.254 0.560 0.740
59 0.007 0.025 0.500 0.560
61 0.027 0.060 0.580 0.660
62 0.106 0.254 0.600 0.860
63 0.224 0.477 0.900 1.460
64 0.011 0.379 0.560 0.800
65 0.013 0.304 2.300 2.560
66 0.039 0.118 0.640 0.660
67 0.067 0.200 0.560 0.640
68 0.038 0.138 0.440 0.560
69 0.032 0.138 0.580 0.740
70 0.001 0.084 0.460 0.660
71 0.018 0.029 0.540 0.640
72 0.124 0.286 2.140 2.360
73 0.003 0.170 0.700 0.980
74 0.010 0.032 0.520 0.540
75 0.005 0.095 0.440 0.540
30 June 2021ARAIM Performance Analysis Report
2.2.3 URA Bounding of Nominal Accuracy
Nominal range error distribution is examined to evaluate how well the URA described the
observed error distribution and to ensure that the Gaussian assumption is valid. MPE and UPE
error distributions are evaluated in this section.
The MPE can take on the value of zero if the three orbital errors and the clock error are all
simultaneously zero. The MPE can also sometimes switch rapidly between positive and negative
values as the corresponding projections change. As a result, the MPE distribution is bimodal with
a notch at zero and is not expected to be Gaussian even if all the underlying distributions were
Gaussian. However, the UPE distribution will be Gaussian, both at each individual user location
and aggregated across all user locations, if the underlying errors are Gaussian. Although the MPE
distribution is not expected to be Gaussian, it is well suited to describe the tail behavior. MPE and
UPE PDF and CDF are used to assess the error distribution [9].
Figure 2-23 shows the PDF MPE normalized by the URA across the constellation. The notch at
zero is expected, as described above. Figure 2-24 to Figure 2-27 show 1-CDF of the normalized
MPE errors by satellite, and they are shown by block type in Figure 2-28. The thick red line shows
the expected value corresponding to the normal distribution with zero-mean and unit variance.
This line is only extended down to the 10-5 probability level, which is the specified satellite fault
rate in the GPS SPS PS. Gaussian bounding below this line is not required.
31 June 2021ARAIM Performance Analysis Report
Figure 2-23. PDF Normalized MPE Composite, 3rd Quarter 2020
32 June 2021ARAIM Performance Analysis Report
Figure 2-24. 1-CDF Normalized MPE for SVN 41 to SVN 50, 3rd Quarter 2020
33 June 2021ARAIM Performance Analysis Report
Figure 2-25. 1-CDF Normalized MPE for SVN 51 to SVN 59, 3rd Quarter 2020
34 June 2021ARAIM Performance Analysis Report
Figure 2-26. 1-CDF Normalized MPE for SVN 61 to 68, 3rd Quarter 2020
35 June 2021ARAIM Performance Analysis Report
Figure 2-27. 1-CDF Normalized MPE for SVN 69 to SVN 75, 3rd Quarter 2020
36 June 2021ARAIM Performance Analysis Report
Figure 2-28. 1-CDF Normalized MPE by Block Type, 3rd Quarter 2020
Figure 2-29 shows the PDF of the composite normalized SISREs, which combines the
instantaneous SISREs of all satellites at all 200 locations in the GPS constellation. Figure 2-30 to
Figure 2-33 show the 1-CDF of the normalized SISRE errors combined across all 200 locations
by satellite, and they are shown by block type in Figure 2-34. The thick red line represents the
normal distribution with zero-mean and unity variance. This line is only extended down to the
37 June 2021ARAIM Performance Analysis Report
10-5 probability level, which is the specified satellite fault rate in the GPS SPS PS. Gaussian
bounding below this line is not required.
In this quarter, the nominal SISRE errors were conservatively described by the broadcast URA.
Figure 2-29. PDF Normalized SISRE Composite, 3rd Quarter 2020
38 June 2021ARAIM Performance Analysis Report
Figure 2-30. 1-CDF Normalized SISRE for SVN 41 to SVN 50, 3rd Quarter 2020
39 June 2021ARAIM Performance Analysis Report
Figure 2-31. 1-CDF Normalized SISRE for SVN 51 to SVN 59, 3rd Quarter 2020
40 June 2021ARAIM Performance Analysis Report
Figure 2-32. 1-CDF Normalized SISRE for SVN 61 to SVN 68, 3rd Quarter 2020
41 June 2021ARAIM Performance Analysis Report
Figure 2-33. 1-CDF Normalized SISRE for SVN 69 to SVN 75, 3rd Quarter 2020
42 June 2021ARAIM Performance Analysis Report
Figure 2-34. 1-CDF Normalized SISRE by Block Type, 3rd Quarter 2020
The overbounding sigma and the ratio of the overbound sigma to the broadcast URA are examined
to evaluate how well the nominal errors are bounded by the broadcast URA, and to what degree of
margin. This evaluation attempts to separate the effect of quantization of the URA values from the
ground system’s ability to estimate the internal quantized value. Previous work has found that GPS
increases the URA faster than the error actually increases; therefore, lumping all URA values
43 June 2021ARAIM Performance Analysis Report
together in the evaluation gave better results, which may be optimistic. More details on error
bounding may be found in previous works [9],[13]. Since the URA value of 2.4 m is the most
frequently broadcast value at over 93% of the time this quarter, bounding is evaluated for errors
when URA is 2.4 m and for the aggregated URA values. The ratio of less than 1 indicates the
broadcast URA bounds the nominal error with a margin.
The ratio of the overbounding sigma to the broadcast URA is shown in Table 2-9. This ratio, or
alpha value, is the smallest margin of the actual distribution to the Gaussian distribution. The
overbounding sigma is formed by finding the minimum Gaussian value that bounds the SISRE
CDF for each satellite at each error value. Alpha is the ratio between the points on the Gaussian
curve and observed error curve with the smallest difference. Small regions of the curves are
ignored during evaluation to account for convergence around the origin. The Y-axis data must be
between 0.000095 and 0.5, and the X-axis data must be between 0.1 and 4.42. Figure 2-35 shows
the ratio of the bounding sigma for URA at 2.4 m only. Table 2-9 shows the ratio of the bounding
sigma to the broadcast URA of 2.4 m and for the combined broadcast URA values for each
satellite.
For this quarter, the alpha values for the URA of 2.4 m only were a little more conservative
compared to the alpha values of the combined URAs. The largest alpha value was 0.474 on SVN
65. The bounding sigmas were below 1.05 m for all satellites, indicating a significant margin of
URA bounding nominal errors.
44 June 2021ARAIM Performance Analysis Report
Table 2-9. Ratio of Bounding Sigma to URA, 3rd Quarter 2020
SVN Ratio for URA=2.4m Only Ratio for All URA's
41 0.165 0.165
43 0.205 0.205
44 0.339 0.325
45 0.155 0.155
46 0.197 0.197
47 0.129 0.129
48 0.202 0.202
50 0.139 0.139
51 0.137 0.137
52 0.203 0.202
53 0.306 0.303
55 0.115 0.115
56 0.123 0.123
57 0.257 0.260
58 0.151 0.151
59 0.122 0.121
61 0.154 0.154
62 0.173 0.169
63 0.251 0.251
64 0.188 0.183
65 0.474 0.468
66 0.147 0.147
67 0.143 0.139
68 0.158 0.158
69 0.179 0.179
70 0.133 0.135
71 0.133 0.133
72 0.469 0.460
73 0.230 0.230
74 0.125 0.124
75 0.111 0.111
45 June 2021ARAIM Performance Analysis Report
Figure 2-35. Ratio of Bounding Sigma for URA = 2.4 m, 3rd Quarter 2020
2.2.4 URA Bounding of Nominal Position Accuracy
Nominal position errors are examined to ensure that individual satellite range errors, when
combined, do not create position errors larger than the ones expected, assuming independent
Gaussian range errors with a standard deviation given by the URA (the nominal error model),
which is what the user assumes. It is important to assess the nominal position bounding for any
possible user weights, because not all users will apply the same weights when combining the range
errors. This can be achieved by examining the sum of the squares (SS) of the URA-normalized
satellite range errors (satellite range errors exceeding 4.42* URA are excluded from this nominal
assessment).
The SS has two important properties. First, it is chi-square distributed assuming the nominal error
model. Second, its square root is an upper bound of the ratio between the user error and the standard
46 June 2021ARAIM Performance Analysis Report
deviation as computed assuming the nominal error model [10, 11]. The observed SS distribution
is expected to be well bounded by a chi-square distribution. If it is not, it means that the correlation
in the measurements will cause the position errors to be larger than expected for some users. If the
observed distribution is bounded by a unit Gaussian (for a range of probabilities), then the position
errors are guaranteed to be bounded by a Gaussian with the expected standard deviation.
The SS is computed at each time epoch at the 200 user locations. It is obtained by subtracting a
common-mode error from each SISRE (because this common error has no effect on the position
error), normalizing each SISRE by the URA, and summing the squares of the resulting ratios.
Figure 2-36 shows the 1-CDF of the SS sample distribution (blue line), chi-square distribution
(dotted red line), and zero mean unit Gaussian distribution (solid red line). The SS sample
distribution is bounded by the chi-square distribution with very ample margin. This indicates that
the errors are consistent with an error model that is bounded by the nominal error model. In
addition, the SS sample distribution is bounded by the Gaussian for all probabilities below 70%;
this corresponds to the point in the CDFs in Figure 2-36 where the unit Gaussian (solid red curve)
crosses the SS statistic (blue curve). Using the result outlined above, this means that those
probabilities derived from the nominal error model are guaranteed to bound the distribution of the
position error. This indicates that the un-faulted positioning errors are bounded by the nominal
error model with significant margin.
47 June 2021ARAIM Performance Analysis Report
Figure 2-36. 1-CDF Chi-Square of Normalized SISREs, 3rd Quarter 2020
48 June 2021ARAIM Performance Analysis Report
2.3 Fault Probability
At the time of this writing, no final decision was made on the format of the ISM message. In
particular, fault rate information may be conveyed as an actual fault rate or as a probability of
failure over a specified period of time. In this report, we present the fault rate only. The state fault
probability can be easily obtained by multiplying the fault rate by the MFD. As the standardization
process evolves, the approved approach or approaches will be presented in this section.
The critical fault parameters for ARAIM are the rate or state probability of single satellite faults,
Rsat and Psat, respectively; the rate or state probability of multiple simultaneous faults, called a
constellation fault, Rconst or Pconst, respectively; and MFD. These three parameters are based upon
GPS CSP commitments and are supported by observational history. This section assesses the GPS
constellation observed fault rates and MFD to ensure that they are consistent with CSP
commitments (see Table 2-1). To do so requires the evaluation of GPS fault history, including
satellite and constellation fault rates based on actual historical data.
Table 2-10 lists the known GPS constellation faults and durations since January 1, 2008. These
faults have been discussed in a previous paper [10].
Table 2-10. GPS Faults from January 1, 2008 to September 30, 2020
Time
of Fault
SVN PRN Date Description
Fault Duration
(UTC)
A clock jumped 20 m at 09:05 causing the
error to exceed 4.42*URA. URA was 2.4 m.
Orbit was not affected and the satellite was
healthy. At 09:45, 155 of 156 IGS stations
09:05
40 stopped tracking the satellite. Normal
25 25 6/26/2009 –
minutes tracking of the satellite was resumed at 10:23
09:45
with a new ephemeris update that set the
satellite to unhealthy. The lone receiver had
only started tracking the satellite at 09:44:30
with discontinuities in pseudorange.
49 June 2021ARAIM Performance Analysis Report
Time
of Fault
SVN PRN Date Description
Fault Duration
(UTC)
A clock ramp occurred at 18:15 causing the
error to exceed 4.42*URA at 18:44:45. URA
was 2.4m. Orbit was not affected and the
18:45
17 satellite was healthy. All 135 IGS stations
38 8 11/5/2009 –
minutes stopped tracking the satellite at 19:02. At
19:02
approximately 19:28, regular transmission
resumed with a new ephemeris update that
set the satellite to unhealthy.
A clock ramp occurred at 20:30 causing the
error to exceed 4.42*URA at 20:45. URA
was 2.4 m. Orbit was not affected and the
20:45
satellite was healthy. All 108 IGS stations
30 30 02/22/2010 – 7 minutes
stopped tracking the satellite at 20:52. At
20:52
approximately 2:15, regular transmission
resumed with a new ephemeris update that
set the satellite to unhealthy.
At 19:26, a new ephemeris update introduced
a 40 m cross-track error with the URA=2.4
19:40 m. The MPE error barely exceeded the
15
39 9 04/25/2010 – 4.42*URA at 19:40. The fault was corrected
minutes
19:55 at 19:55 with a new ephemeris update. The
satellite health was set to healthy the entire
time.
At 00:10, a new ephemeris update introduced
a 1700 m cross-track error with the
00:10
26 URA=2.4 m. The MPE error exceeded the
59 19 06/17/2012 –
minutes 4.42*URA. The fault was corrected at 00:37
00:36
with a new ephemeris update. The satellite
health was set to healthy the entire time.
Each of the 5 known faults lasted less than 1 hour and the average across all 5 faults was 21
minutes. Therefore, the committed value of MFD of 1 hour appears to be valid and conservative.
Independent, single satellite faults are referred to as narrow faults, and simultaneous or overlapping
satellite faults that originate from a common cause, within a single constellation, are referred to as
50 June 2021You can also read


