AIRWays Reporting System User Guide 2018-2019 - OAKS Portal
←
→
Page content transcription
If your browser does not render page correctly, please read the page content below
Oregon Statewide Assessment System

                               AIRWays Reporting
                               System User Guide
                                                                                            2018-2019

                                                                                      Published January 24, 2019

                                                               Prepared by the American Institutes for Research®

Descriptions of the operation of AIRWays Reporting and related systems are property of the American Institutes
for Research (AIR) and are used with the permission of AIR.
AIRWays Reporting User Guide

Table of Contents
Introduction to the User Guide .......................................................................................... 1
Section I. Navigating Reports ............................................................................................ 2
   Understanding Report Data ................................................................................................................... 2
       Understanding Report Data on Individual Items .................................................................................. 3
   Viewing Overall Test Results ................................................................................................................ 3
       To access all your aggregate test results by test: ................................................................................ 3
       To see how your students performed on these tests: .......................................................................... 3
       To learn more about what score and performance levels are: ............................................................. 4
   Viewing Test Results for Classes or Rosters Who Completed a Particular Test ............................ 5
       To access test results for all classes or rosters:................................................................................... 5
       To see which classes or rosters performed best on this assessment: ................................................. 5
       To access test results for a class or roster: .......................................................................................... 6
       To see how well students in the class or roster performed in each area on the test: .......................... 6
       To see which items the class or roster performed on the best or struggled with the most: ................. 7
       To see more details about an individual test item: .............................................................................. 7
   For Teachers and School-Level Users: Viewing Test Results for All Your Students Who
   Completed a Particular Test .................................................................................................................. 8
       To access test results for all your students: ......................................................................................... 8
       To see how your students performed on this assessment: .................................................................. 8
       To see how well your students performed in each area on the test: .................................................... 9
       To see which items your students performed on the best or struggled with the most: ........................ 9
       To see more details about an individual test item: ............................................................................... 9
   Viewing Test Results for an Individual Student ................................................................................ 10
       To access test results for a student: ................................................................................................... 10
       To see how well the student performed in each area on the test:...................................................... 10
       To see actual student responses to each item on the test: ................................................................ 11
       To view a report for all the assessments a student has completed over time: .................................. 11
       To see how the student performed in relation to the rest of your students: ....................................... 12
       To identify which assessments a student performed on best: ........................................................... 12
       To see how a student performed on their most recent assessments: ............................................... 12
   For School- and District-Level Users: Viewing Test Results for a School on a Particular
   Test......................................................................................................................................................... 13
       To access test results for a school: .................................................................................................... 13
       To see which teachers’ classes or rosters performed best: ............................................................... 13
       To see how well students in the school performed in each area on the test: .................................... 14

© American Institutes for Research i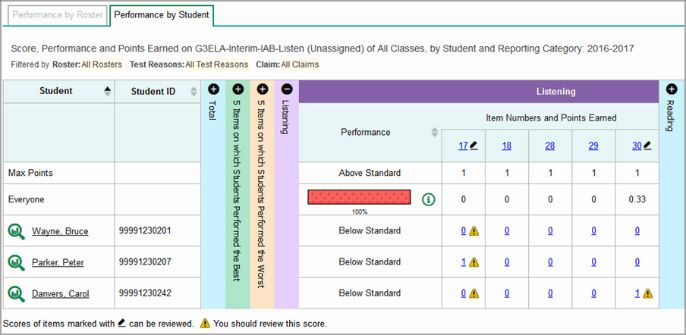
AIRWays Reporting User Guide

      To see which items the students in the school performed on the best or struggled with the
      most: ................................................................................................................................................... 14
      To see more details about an individual test item: ............................................................................. 14
   For District-Level Users: Viewing Test Results for Your District on a Particular Test ................. 15
      To access test results for the district: ................................................................................................. 15
      To see which schools in the district performed best: ......................................................................... 15
      To see how well students in the district performed in each area on the test: .................................... 15

Section II. Setting Up Your Reports So They Make Sense ............................................ 16
   Working with Test Reasons ................................................................................................................. 16
      Assigning Test Reasons ..................................................................................................................... 17
           To assign test reasons in the AIRWays Reporting System: .......................................................... 17
      Filtering by Test Reasons ................................................................................................................... 18
           To filter reports by test reasons: .................................................................................................... 18
   Filtering by Assessment Targets ........................................................................................................ 19
      To filter reports by assessment targets: ............................................................................................. 19
   Working with Classes or Rosters ....................................................................................................... 20
      Creating and Managing Your Class Groups or Rosters ..................................................................... 20
           Adding a New Roster ..................................................................................................................... 20
           Modifying an Existing Roster ......................................................................................................... 22
           Uploading Rosters .......................................................................................................................... 22
      Filtering by Class Groups or Rosters ................................................................................................. 24
           To filter reports by classes or rosters: ............................................................................................ 25
   For Teachers: Filtering Tests to Suit Your Preferences ................................................................... 26
      To filter tests to suit your preferences: ............................................................................................... 26
   For School- and District-Level Users: Filtering Classes or Rosters by Teacher
   Preferences ........................................................................................................................................... 27
      To select which rosters to display: ..................................................................................................... 27

Section III. Accessing Item-Level Data ............................................................................ 28
      To view an item: ................................................................................................................................. 28
      To navigate to other items from the Item View window: ..................................................................... 30
      To view another student's response for the current item: .................................................................. 30
      To exit item view: ............................................................................................................................... 30

Section IV. Tracking Student Performance..................................................................... 31
      To access a Longitudinal Report comparing related assessments: ................................................... 31
      To view students’ overall performance data on the assessments over time:..................................... 32
      To switch between score data and performance data: ...................................................................... 33

© American Institutes for Research ii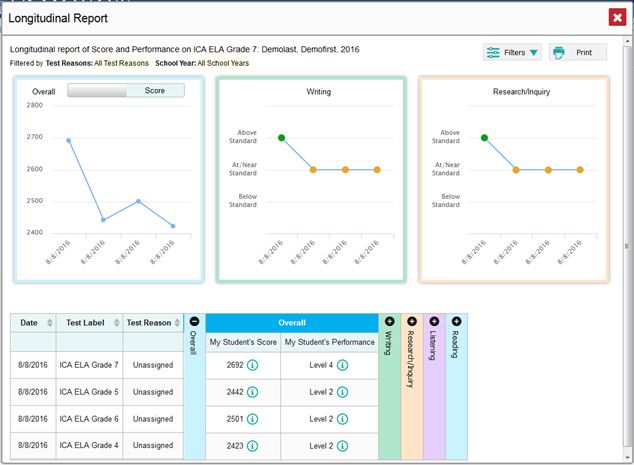
AIRWays Reporting User Guide

       To see students’ performance in different areas over time: ............................................................... 33
       To show some tests and not others in the report: .............................................................................. 33

Section V. Exporting and Printing Data .......................................................................... 34
       To print or export a report: .................................................................................................................. 34
       To export a report from the Dashboard (district-level users only): ..................................................... 36

Section VI. Scoring Items ................................................................................................. 37
   Scoring Unscored Items ...................................................................................................................... 37
       To enter scores for unscored items: ................................................................................................... 37
   Modifying Scores for Items.................................................................................................................. 39
       To review and modify scores: ............................................................................................................. 39

Appendix ........................................................................................................................... 41
   Condition Codes ................................................................................................................................... 41
       About Condition Codes ....................................................................................................................... 41
   Help ........................................................................................................................................................ 42
        Help ................................................................................................................................................... 42
           To access the online user guide: ................................................................................................... 42
   Inbox ...................................................................................................................................................... 42
       Inbox ................................................................................................................................................... 42
           To access reports in the Inbox: ...................................................................................................... 42
           To unarchive a file: ......................................................................................................................... 43
   Logging In ............................................................................................................................................. 43
       Logging in to the System .................................................................................................................... 43
           To log in to the AIRWays Reporting System:................................................................................. 43
   “n/a” Scores and Non-Scorable Test Opportunities ......................................................................... 44
       “n/a” Scores ........................................................................................................................................ 44
       Non-Scorable Test Opportunities ....................................................................................................... 45
   Passwords and Usernames ................................................................................................................. 45
       Passwords and Usernames................................................................................................................ 45
   Report Tables ........................................................................................................................................ 46
       Report Tables ..................................................................................................................................... 46
           To sort a table: ............................................................................................................................... 46
           To specify the number of rows displayed:...................................................................................... 46
           To view additional table rows: ........................................................................................................ 46
           To view additional table columns: .................................................................................................. 47
           To expand all accordion sections: .................................................................................................. 47
   Test Resources ..................................................................................................................................... 47

© American Institutes for Research iii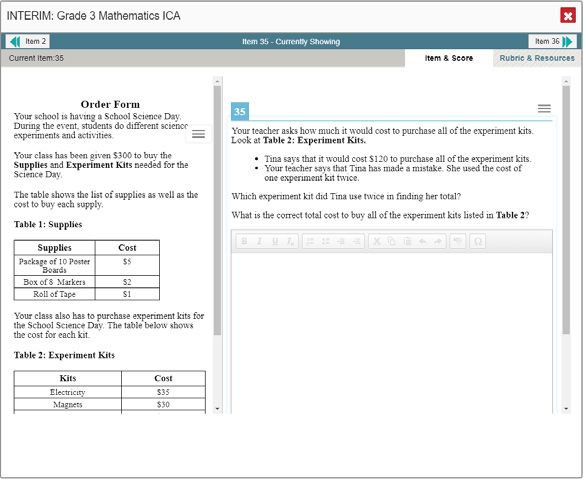
AIRWays Reporting User Guide

       Test Resources .................................................................................................................................. 47
           To access additional information on the assessment: ................................................................... 47
   User Support ......................................................................................................................................... 47
       User Support ...................................................................................................................................... 47

Change Log ....................................................................................................................... 49

List of Tables
Table 1. Available Test Reasons ............................................................................................................. 16
Table 2. Columns in the Rosters Upload File ......................................................................................... 24
Table 3. Overview of Condition Codes ................................................................................................... 41

© American Institutes for Research iv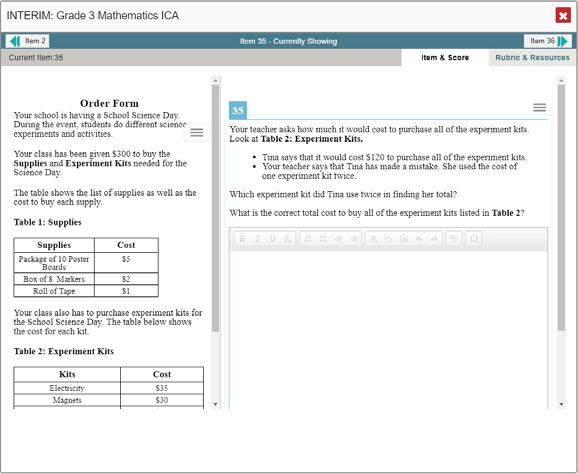
AIRWays Reporting System User Guide 2018–2019

                                                                                                                  Introduction to the User Guide
Introduction to the User Guide
This user guide provides instructions on how to use the AIRWays Reporting System. In this system you can do the
following:

•    View scores for your interim and benchmark assessments

•    Score items on your interim and benchmark assessments

The guide includes the following sections:

    • Navigating Reports

    • Setting Up Your Reports

    • Accessing Item-Level Data

    • Tracking Student Performance

    • Exporting and Printing Data

    • Scoring Items
There is also an appendix with additional information and instructions.

© American Institutes for Research 1
AIRWays Reporting System User Guide 2018–2019

                                                                                                                                    Section 1. Navigating Reports
Section I. Navigating Reports
The AIRWays Reporting System provides data on student performance for your interim and benchmark
assessments.

Understanding Report Data
•       Your district.

•       A school.

•       Specific classes or groups of students (rosters).

•       Individual students.

    Different users can view different levels of data in the Reporting System:
    •     Teachers (test administrators) can view data for all the students who are members of their rosters and all the students
          who have completed an assessment in their test sessions.
    •     School-level users can view data for all the students who have completed assessments in their school.
    •     District-level users can view data for all the students who have completed assessments in a school in their district.

There are two main ways to view the data in AIRWays Reporting:
•       The first is to view results by a particular test. This is useful for understanding broadly how your students
        performed on that particular subject at that particular time. Depending on your role, you can view results for a
        test by school, by roster or class, or by student.

•       The second is to look at multiple tests a particular student took. This is useful for understanding how that
        student performed over time and across various subjects. For example, you can use the Student Portfolio
        Report to compare multiple ELA tests the student took throughout the school year, or to compare the
        student’s ELA and math performance.

Depending on the test, a report may display either or both of two types of performance data:
•       Score data is used for tests with numeric scores.

•       Performance level data is used for tests with performance levels (also known as proficiency levels).
        Performance levels provide qualitative measurements of students’ proficiency in relation to a particular
        standard or set of standards. Some reports include a Performance Distribution column displaying an
        infographic that contains a color- and pattern-coded region for each performance level in the assessment. The
        number below each region indicates the percentage of students who performed at that level.

If an assessment does not use numeric scores, the Score and Average Score columns do not appear in reports for
that assessment. If an assessment does not use performance levels, the Performance and Performance
Distribution columns do not appear in reports for that assessment

© American Institutes for Research 2
AIRWays Reporting System User Guide 2018–2019

                                                                                                                        Section 1. Navigating Reports
 Understanding Report Data on Individual Items
You can look at the test results for a school, a roster, a teacher’s associated students, or an individual student to
get information on how students performed on the individual items in each reporting category, as well as to view
those items.

Viewing Overall Test Results
 To access all your aggregate test results by test:
Start at the dashboard that appears when you log in. An assessments table displays at the top of the page. The test
results in this table are aggregates of all the students for whom you can view data.

The assessments table shows a list of assessments with general information about them. The type of data available
may vary by test.

      Description of the Data the Table Shows                  Average Score and Performance
                                                               Distribution Columns

Each row of the table gives overall results for a particular test: average score and performance distribution. You
can also see the test reason, the number of students who took the test, and the date it was last taken.

 To see how your students performed on these tests:
Sort by the Average Score column.

© American Institutes for Research 3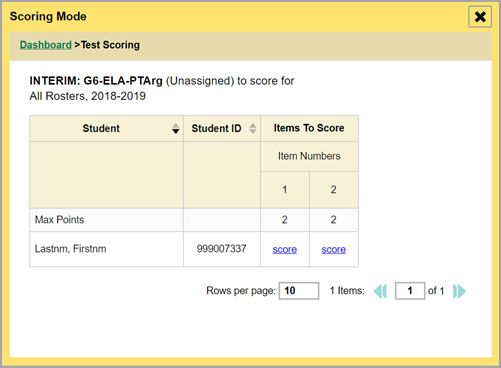
AIRWays Reporting System User Guide 2018–2019

                                                                                                           Section 1. Navigating Reports
 To learn more about what score and performance levels are:
Click the lowercase i button    next to the Average Score and Performance Distribution columns. A legend
appears, explaining what the scores and performance levels indicate.

© American Institutes for Research 4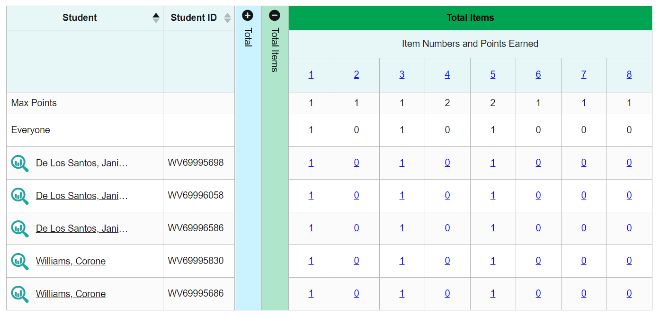
AIRWays Reporting System User Guide 2018–2019

                                                                                                                               Section 1. Navigating Reports
Viewing Test Results for Classes or Rosters Who Completed a Particular
Test
Sometimes it’s most meaningful to see test results broken down by class or roster. For example, if you are a
district- or school-level user, you may want to compare individual teachers’ classes (teachers can see only their
own classes); or you may want to evaluate a particular group of students (for example, all students who have taken
honors courses). You can use the AIRWays Reporting System to understand how well classes or rosters performed
on a particular assessment.

    To access test results for all classes or rosters:
•     Teachers (test administrators) and school-level users can go to the dashboard and click a test name (or the
      magnifying glass       beside it) in the table of assessments.

•     District-level users can go to the dashboard and click a test name (or the magnifying glass          beside it) in the
      table of assessments. A page of district test results appears, listing schools within the district. Click a school
      name (or the magnifying glass         beside it).

The page that appears displays the tab Performance by Roster by default. The table of test results contains
accordion sections that you can expand and collapse by clicking the vertical bars. Note that different tests will have
different data in the accordion sections.

        Performance by
        Roster Tab                          Average Scale Score and
                                            Performance Distribution         5 Items on Which Students Performed
                                                                             Best and Worst Accordion Sections

                     Roster Names

    To see which classes or rosters performed best on this assessment:
Sort by the Average Scale Score column or look at the Performance Distribution column in the Total section.

© American Institutes for Research 5
AIRWays Reporting System User Guide 2018–2019
Section 1. Navigating Reports
To access test results for a class or roster:
Click the name of a roster that appears in the first column of the report (or the magnifying glass button beside
it). The test results for that roster appear, listing performance data for each student in the roster.
To see how well students in the class or roster performed in each area on the test:
If a test has multiple topics, you can
compare the scores and performance
levels in each of the expandable
accordion sections. In this example, the
first student in the roster performed at
“Above Standard” in Communicating
Reasoning.
Benchmark tests cover only one topic, while interim tests cover many. For examples of topics, a math test may
include Communicating Reasoning and Concepts and Procedures.
© American Institutes for Research 6AIRWays Reporting System User Guide 2018–2019
Section 1. Navigating Reports
To see which items the class or roster performed on the best or struggled with the
most:
If a test includes more than 10 items, you will be able to see the items and their average scores in the sections 5
Items on Which Students Performed the Best and 5 Items on Which Students Performed the Worst. These appear
as separate expandable sections in the accordion table.
5 Items on Which 5 Items on Which
Average Score Item Number Link
Students Performed the Students Performed the
on This Item
Best Accordion Section Worst Accordion Section
for This Roster
Regardless of how many items a test contains, you can see the items and their average scores in the topic sections
or the Total Items section, which are also expandable.
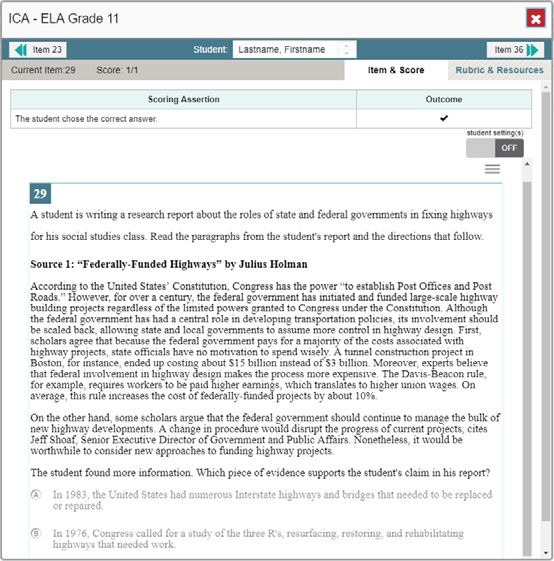
To see more details about an individual test item:
Click the item links in the Total Items section, the 5
Items on Which My Students Performed the Best/Worst
sections, or the topic sections.
An Item View window opens, showing the actual item.
The Rubric & Resources tab in this window also shows
the standard to which the item is aligned and the
rubric.
© American Institutes for Research 7AIRWays Reporting System User Guide 2018–2019
Section 1. Navigating Reports
For Teachers and School-Level Users: Viewing Test Results for All Your
Students Who Completed a Particular Test
In addition to seeing the results for a particular class or group of students, teachers and school-level users can also
see the results for all the students they are associated with (regardless of which classes or rosters they belong to).
To access test results for all your students:
Teachers and school-level users can go
to the dashboard and click a test name
(or the magnifying glass button
beside it) in the table of assessments.
Select the Performance by Student tab
on the report that appears.
To see how your students performed on this assessment:
In the expandable Total section, sort
the report by the Scale Score column or
Performance column.
© American Institutes for Research 8AIRWays Reporting System User Guide 2018–2019
Section 1. Navigating Reports
To see how well your students performed in each area on the test:
If expandable topic sections appear in the accordion table, compare the scores and/or performance levels in each
of the topics.
Benchmark tests cover only one topic, while interim tests cover many. For examples of topics, an ELA test may
include Listening, Reading, Research/Inquiry, and Writing.
To see which items your students performed on the best or struggled with the most:
If a test includes more than 10 items, you will be able to see the items and their average scores in the sections 5
Items on Which Students Performed the Best and 5 Items on Which Students Performed the Worst. These appear
as separate expandable sections in the accordion table.
5 Items on Which Students Performed 5 Items on Which Students Performed
the Best Accordion Section the Worst Accordion Section
Item Number Link Score on This Item for This
Regardless of how many items a test contains, you can see the items and scores in the Total Items section or topics
sections, which are also expandable.
To see more details about an individual test item:
Click the item links in the Total Items section, the 5 Items
on Which My Students Performed the Best/Worst
sections, or the topic sections.
An Item View window opens, showing the actual item.
The Rubric & Resources tab in this window also shows
the standard to which the item is aligned and the rubric.
© American Institutes for Research 9AIRWays Reporting System User Guide 2018–2019
Section 1. Navigating Reports
Viewing Test Results for an Individual Student
You can also use the AIRWays Reporting System to find out how well individual students understand the material
covered on a specific completed assessment. For example, you can look at student-level performance, and you can
see actual student responses to each item on the test. Instructions on how to view both types of data are provided
below.
To access test results for a student:
For teachers and school-level users:
1. Go to the dashboard and click a test name (or the magnifying glass beside it) in the table of assessments.
2. Select the Performance by Student tab on the report that appears.
3. Then click the name of an individual student (or the magnifying glass button beside it) in the report.
For district-level users:
1. Go to the dashboard and click a test name (or the magnifying glass beside it) in the table of assessments.
A page of district test results appears, listing schools within the district.
2. Click a school name (or the magnifying glass beside it).
3. Follow the same steps as teachers and school-level users, starting with step 2.
To see how well the student performed in each area on the test:
If expandable topic sections appear in the accordion table, look at the scores and the overall performance details
at the bottom of each of the topics.
Benchmark tests cover only one topic, while interim tests cover many. As examples of topics, an ELA test may
include Listening, Reading, Research/Inquiry, and Writing.
Topic Student’s Scores in This Skill Area
Student’s Performance in This Topic
© American Institutes for Research 10AIRWays Reporting System User Guide 2018–2019
Section 1. Navigating Reports
To see actual student responses to each item on the test:
Click the student's score for an individual
item.
An Item View window opens, showing the
actual item with the student response. The
Rubric & Resources tab in this window also
shows the standard to which the item is
aligned and the rubric.
Reviewing a student's response in this window can help you understand your student’s reasoning. For example, if
you notice that the student did not follow the order of operations in a math item, you may need to spend more
time with the student on this skill.
You could also pay attention to what types of items a student struggles with. For example, if a student consistently
performs better on multiple choice items than on text response items, it may be a sign that the student should
spend more time developing writing skills.
To view a report for all the assessments a student has completed over time:
You can also see all the tests taken by an individual
student, including those taken in previous school years.
To do so, enter the student's SSID in the search field in
the upper-right corner and click the search button.
(Teachers can also access this report from the teacher
dashboard by going to the My Students table and
clicking a student's name (or the magnifying glass
button beside it).) The Student Portfolio Report
appears.
© American Institutes for Research 11AIRWays Reporting System User Guide 2018–2019
Section 1. Navigating Reports
To see how the student performed in relation to the rest of your students:
In the Student Portfolio Report, compare the My Student's Score column to the Average Score of My Students
column. For example, you may find that the student's score is average compared with all your students who took
the test.
You can also compare the My Student's Performance
column to the Performance Distribution of my Students
column, which shows a color- and pattern-coded
percentage of students who performed at each level.
For example, suppose a high percentage of your
students performed better than this one. That might
suggest that the student needs more individual
attention.
To identify which assessments a student performed on best:
Sort the Student Portfolio Report by the My Student's
Score column. Keep in mind that different tests may
be scored with different measures. For example,
some tests may provide a scale score for overall
performance while others may provide a
performance category like “Near Proficient”.
To learn more about how a test is scored, click the
lowercase i button beside the score data or the
performance distribution data. A legend appears.
To see how a student performed on their most recent assessments:
Sort the Student Portfolio Report by the Date Taken
column.
© American Institutes for Research 12AIRWays Reporting System User Guide 2018–2019
Section 1. Navigating Reports
For School- and District-Level Users: Viewing Test Results for a School on
a Particular Test
The prior sections have explained how users can view test results in multiple ways:
• For all their classes or rosters (all users).
• For all the students associated with them.
• For individual students, including actual student responses to each item on the test (all users).
This section will explain how school- and district-level users can view test results for all students in a school.
To access test results for a school:
• School-level users can go to the dashboard and click the name of the test (or the magnifying glass button
beside it) to view school-wide results for that test.
• District-level users can go to the dashboard and click the name of the test (or the magnifying glass button
beside it) to view district-wide results for that test. A table showing test results by school appears.
Click the name of the school for which you would like to see results.
The test results for that school appear, with the
Performance by Roster tab open by default.
To see which teachers’ classes or rosters performed best:
In the Performance by Roster tab, sort the table by the
Teacher column. If a certain teacher's rosters or
classes performed consistently well, you could use that
teacher's instructional methods as a model for the
teachers whose rosters had lower scores.
© American Institutes for Research 13AIRWays Reporting System User Guide 2018–2019
Section 1. Navigating Reports
To see how well students in the school performed in each area on the test:
In either the Performance by Roster or Performance by Student tab, if expandable topic sections are present,
compare the scores and performance levels in each of the expandable topic sections in the accordion table.
Benchmark tests cover only one topic, while interim
tests cover many. As examples of topics, an ELA test
may include areas like Listening, Reading,
Research/Inquiry, and Writing.
To see which items the students in the school performed on the best or struggled
with the most:
If a test includes more than 10 items, you will be able to see the items and their average scores in the sections 5
Items on Which Students Performed the Best and 5 Items on Which Students Performed the Worst. These appear
as separate expandable sections in the accordion table.
5 Items on Which Students Performed the Worst
Accordion Section
5 Items on Which Students Performed the Best
Accordion Section
Average Score on This
Item Number Link Item for This Roster
Regardless of how many items a test contains, you can see the items and their average scores in the Total Items
section, which is also expandable.
To see more details about an individual test item:
Click the item links in the Total Items section, the 5 Items on Which
My Students Performed the Best/Worst sections, or the topic sections.
An Item View window opens, showing the actual item. The Rubric &
Resources tab in this window also shows the standard to which the
item is aligned and the rubric.
© American Institutes for Research 14AIRWays Reporting System User Guide 2018–2019
Section 1. Navigating Reports
For District-Level Users: Viewing Test Results for Your District on a
Particular Test
You can use the Reporting System to find out how well the students in your district understand the material
covered on each of their completed assessments. The layout of your reports may vary by test.
To access test results for the district:
On the district-level dashboard, click the
name of the test (or the magnifying glass
beside it) for which you would like to see
results. The test results for that district
appear.
To see which schools in the district performed best:
In the Total section, look at the Average Scale
Score column and Performance Distribution
column. Then sort by the Average Scale Score
column. If a certain school performed consistently
well, you could use that school’s instructional
methods as a model for the schools whose
students had lower scores.
To see how well students in the district performed in each area on the test:
If expandable topic sections appear in the
accordion table, compare the scores
and/or performance distributions in each
of the topics. In the example here, the
one school shown performed better in
Communicating Reasoning than in
Concepts and Procedures.
Benchmark tests cover only one topic, whereas interim tests cover many.
© American Institutes for Research 15AIRWays Reporting System User Guide 2018–2019
Section II. Setting Up Your Reports So They Make Sense
Section II. Setting Up Your Reports So They Make Sense
There are several ways you can set up your reports to make them more useful:
• Working with Test Reasons
• Filtering by Assessment Targets
• Working with Classes or Rosters
• For Teachers: Filtering Tests to Suit Your Preferences
• For School- and District-Level Users: Filtering Classes or Rosters by Teacher Preferences
Working with Test Reasons
Test reasons are categories used to classify test opportunities for reporting purposes. They indicate the timeframe
in which tests were taken, and they’re a good way to disaggregate data, making it easier to filter and compare your
results. For a list of the test reasons you can use, see Table 1.
Table 1. Available Test Reasons
Test Reason Type Definition
• Test One The number of the test in a sequence.
• Test Two
• Test Three
• Test Four
• Fall The season in which the test was taken.
• Winter
• Spring
• Pre-Instruction The periods before and after the students were instructed in the
subject of the test.
• Post-Instruction
© American Institutes for Research 16AIRWays Reporting System User Guide 2018–2019
Section II. Setting Up Your Reports So They Make Sense
There are two things you may want to do to work with test reasons:
• Assigning Test Reasons: Test reasons should ideally be
assigned in the Test Administration Site at the time of
testing. However, you can use the Test Reason
Manager in the AIRWays Reporting System to assign a
different test reason to an opportunity after the tests
are completed.
o Once test reasons are assigned, you’ll be
able to view and filter by them. For
example, if you want to look only at the
results of your first test, then you can filter
the data in your reports to include only
those results. If you do not set test reasons,
no test reason will be assigned and the data
will not be disaggregated. You may find
disaggregated data easier to understand.
• Filtering by Test Reasons: Once your test opportunities have been assigned test reasons, you can filter reports
by a single test reason in order to focus on a single timeframe.
o For example, you may want to filter by Fall and look at ELA performance, then filter by Spring and
see if students have improved on ELA material. The default report filter shows data for all tests, so if
you don’t filter, you’ll see tests with all different test reasons. This will allow you to compare
multiple test reasons side by side, but the data will not be disaggregated. You may find
disaggregated data easier to understand.
Assigning Test Reasons
To assign test reasons in the AIRWays Reporting System:
1. From the Task Manager drop-down list in the
banner, select Manage Test Reasons. The Manage
Test Reason window opens.
2. To search for the test opportunities you wish to categorize, do one of the following:
o In the Session ID field, enter the session ID in which the opportunities were completed.
o Select the test reason associated with the opportunities you want to edit. Then select a range of dates
during which the test session was administered.
3. Click Search.
© American Institutes for Research 17AIRWays Reporting System User Guide 2018–2019
Section II. Setting Up Your Reports So They Make Sense
4. A list of retrieved test sessions appears. You can
click the buttons to expand the list of tests in
each session and the list of the test each student
took. To navigate through a long list, use the
controls in the upper-right and lower-right
corners.
5. Mark the checkboxes for each session, test, or opportunity that you wish to assign to a test reason.
6. Click Assign Test Reasons below the list of retrieved sessions.
7. In the confirmation window, select a new test reason to assign to the selected opportunities and click
Confirm.
Filtering by Test Reasons
The Test Reasons filter is available on the dashboards for teachers, school-level users, and district-level users, as
well as in Longitudinal Reports. Once you’ve filtered a page using it, all the reports accessible from that page will
be filtered the same way.
To filter reports by test reasons:
1. Click Filters above the report.
2. Make a selection from the Test Reason drop-down list.
For a list of test reasons used, see Table 1.
3. Click Apply. The affected report updates to show only
data for that test reason.
4. Optional: To revert all filters to their defaults, open the
Filters menu and click Clear Filters.
When test reason filters are applied to a report, the row of filter details below the table header shows the test
reason you selected.
© American Institutes for Research 18AIRWays Reporting System User Guide 2018–2019
Section II. Setting Up Your Reports So They Make Sense
Filtering by Assessment Targets
An educational assessment target describes the skill the item measures. An example of a math assessment target
is “At later grades, determine conditions under which an argument does and does not apply. (For example, area
increases with perimeter for squares, but not for all plane figures.)”
You may want to see how your students performed on a particular assessment target or set of assessment targets.
When you’re in a view that shows individual items, you can filter by the assessment target to which items are
aligned. That way you can view your students’ performance in just one area of skill. Then you can switch filters to
compare it with their performance in another skill. If you don’t filter by assessment target, the reports will show
results for all assessment targets by default and the data will not be disaggregated. You may find disaggregated
data easier to understand. All the reports accessible from the page you filter will be filtered the same way.
Assessment target filters are available on the following pages:
• School-level test results.
• Class or roster test results.
• Individual student test results.
You can filter by the assessment target category, assessment target sub-categories, and/or the assessment target
itself. The available assessment targets and categories vary by assessment.
To filter reports by assessment targets:
1. Click Filters above the report.
2. Make a selection from the [Assessment Target
Category] drop-down list. The next [Assessment
Target Category] drop-down list appears below it.
3. Optional: Make a selection from the second and/or
third [Assessment Target Category] drop-down list.
The Assessment Target drop-down list appears
below it.
4. Optional: Select an assessment target.
5. Click Apply. The affected report updates to show
only data for that assessment target.
6. Optional: To revert all filters to their defaults, open
the Filters menu and click Clear Filters.
When filters are applied to a report, the row of filter details below the table header shows the assessment target
category and/or assessment target you selected.
© American Institutes for Research 19AIRWays Reporting System User Guide 2018–2019
Section II. Setting Up Your Reports So They Make Sense
Working with Classes or Rosters
Rosters usually represent classes, but can represent any group that’s meaningful to users, such as students who
have taken honors classes. Each roster is associated with a teacher. The rosters in AIRWays Reporting are the same
rosters in the Test Information Distribution Engine (TIDE), so any changes to the rosters in either system will
appear in both AIRWays Reporting and TIDE.
• Creating and Managing Your Class Groups or Rosters: Teachers, school-level users, and district-level users can
add, edit, and delete rosters.
• Filtering by Class Groups or Rosters: On the dashboard, you can sometimes filter by rosters. You may find that
filtering makes it easier to focus on a particular class’s performance. And by switching filters, you can easily compare
it with another class. If you don’t filter by roster, the reports default to showing data for all rosters, and the data will not
be disaggregated. You may find disaggregated data easier to understand. Besides the rosters associated with you,
you can also select My Proctored Students, which automatically includes all the students you’ve proctored.
All users can view test results by roster.
Creating and Managing Your Class Groups or Rosters
Adding a New Roster
You can create new classes or rosters from students associated with your school or district.
To add a roster:
1. From the My Settings menu in the
banner, select Add Roster. The Add
Roster form appears.
2. In the Search for Students to Add to the Roster panel, do the following:
a. In the School drop-down list, select the school for the roster. (The District option will be preselected.)
b. Optional: In the SSID, Student’s First Name, and/or Student’s Last Name fields, enter information about a
particular student you want to add.
c. Optional: In the Enrolled Grade drop-down list, select the grade levels for the students in the roster.
d. Optional: In the Advanced Search panel, select additional criteria:
i. From the Search Fields drop-down list, select a criterion type. A set of related criteria for that
criterion type appear.
ii. In the related fields, select the additional criteria.
iii. Click Add.
iv. Optional: To remove the added criteria, mark the checkbox for those criteria and click Remove
Selected. To remove all additional criteria, click Remove All.
© American Institutes for Research 20AIRWays Reporting System User Guide 2018–2019
Section II. Setting Up Your Reports So They Make Sense
e. Click Search. The Add Students to the Roster panel appears, with settings, a list of retrieved students
(Available Students), and a blank Selected Students list.
3. In the Add Students to the Roster panel, do the
following:
a. In the Roster Name field, enter the roster
name.
b. From the Teacher Name drop-down list, select
a teacher.
c. To add students, do one of the following in the list of available students:
To move one student to the roster, click for that student.
To move all the students in the Available Students list to the roster, click Add All.
To move selected students to the roster, mark the checkboxes for the students you want to add, then
click Add Selected.
d. To remove students, do one of the
following in the list of students in this
roster:
To remove one student from the
roster, click for the student.
To remove all the students from the
roster, click Remove All.
To remove selected students from the
roster, mark the checkboxes for the
students you want to remove, then click
Remove Selected.
4. Click Save, and in the affirmation dialog box click Continue.
© American Institutes for Research 21AIRWays Reporting System User Guide 2018–2019
Section II. Setting Up Your Reports So They Make Sense
Modifying an Existing Roster
You can modify a class or roster by changing its name, changing its associated teacher, adding students, or
removing students.
To modify a roster:
1. From the My Settings menu in the banner, select
View Rosters. The Roster Manager form appears,
showing the View/Edit/Export Roster form.
2. In the Search for Rosters to Edit panel, select the school and roster type for the roster you wish to edit.
3. Click Search. A list of retrieved rosters appears.
4. In the list of retrieved rosters, click for the
roster whose details you want to view. The Add
Students to the Roster panel appears.
5. Optional: In the Add Students to the Roster panel, do the following:
a. In the Roster Name field, enter a new name for the roster.
b. From the Teacher Name drop-down list, select the roster's new teacher.
c. To add students, do one of the following in the list of available students:
To move one student to the roster, click for that student.
To move all the students in the Available Students list to the roster, click Add All.
To move selected students to the roster, mark the checkboxes for the students you want to add, then
click Add Selected.
d. To remove students, do one of the following in the list of students in this roster:
To remove one student from the roster, click for the student.
To remove all the students from the roster, click Remove All.
To remove selected students from the roster, mark the checkboxes for the students you want to
remove, then click Remove Selected.
6. Click Save, and in the affirmation dialog box click Continue.
Uploading Rosters
If you have many classes or rosters to create, it may be easier to perform those transactions through file uploads.
This task requires familiarity with composing comma-separated value (CSV) files or working with Microsoft Excel.
© American Institutes for Research 22AIRWays Reporting System User Guide 2018–2019
Section II. Setting Up Your Reports So They Make Sense
To upload rosters:
1. From the My Settings menu in the banner, select
Upload Rosters. The Upload Rosters: Upload File
page appears.
2. On the Upload Rosters: Upload File page, click Download Templates in the upper-right corner and select the
appropriate file type (either Excel or CSV).
3. Open the template file in a spreadsheet application.
4. Using Table 2 on page 24 below as a reference, fill
out the template and save it.
5. On the Upload Rosters: Upload File page, click Browse and select the file you created in the previous step.
6. Click Next. The Upload Rosters: Preview page
appears. Use the file preview on this page to verify
you uploaded the correct file.
7. Click Next to validate the file. Any errors or
warnings are displayed on the Upload Rosters:
Validate page. If a record contains an error, that
record will not be included in the upload. If a
record contains a warning, that record will be
uploaded, but the field with the warning will be
invalid.
o Optional: Click the error and warning icons in the validation results to view the reason a field is invalid.
o Optional: Click Download Validation Report in the upper-right corner to view a text file listing the
validation results for the upload file.
If your file contains a large number of records, the AIRWays Reporting System processes it offline and sends you a
confirmation email when complete. While the AIRWays Reporting System is validating the file, do not press Cancel,
as some of the records may have already started processing.
© American Institutes for Research 23AIRWays Reporting System User Guide 2018–2019
Section II. Setting Up Your Reports So They Make Sense
8. Do one of the following:
o Click Continue with Upload. The AIRWays
Reporting System commits those records that
do not have errors. If there are too many errors,
you won’t be able to do this.
o Click Upload Revised File to upload a different
file. Follow the prompts on the Upload Revised
File page to submit, validate, and commit the
file.
The Confirmation page appears, displaying a
message that summarizes how many records
were committed and excluded.
9. Optional: To upload another roster file, click Upload
New File.
Table 2 provides the guidelines for filling out the Roster template that you can download from the Upload Roster
page.
Table 2. Columns in the Rosters Upload File
Column Name Description Valid Values
External School ID* School associated with the School ID that exists in TIDE. Up to 20
roster. characters. Must be associated with the
district ID.
Can be blank when adding district-level
rosters.
User Email ID* Email address of the teacher Email address of a teacher existing in
associated with the roster. TIDE.
Roster Name* Name of the roster. Up to 20 characters.
External Student ID* Student’s unique identifier Up to 30 alphanumeric characters.
within the district.
*Required field.
Filtering by Class Groups or Rosters
The Rosters filter is sometimes available on the dashboard.
Filtering by rosters is different from viewing test results for a roster or rosters. When you filter, you eliminate
students not in the selected roster from the data you’re viewing. You may want to do this if you want to view a
single class’s list of assessments on the dashboard. If you don’t filter, all rosters will appear and the data will not be
disaggregated. You may find disaggregated data easier to understand.
All the reports accessible from the page you filter will be filtered the same way.
© American Institutes for Research 24AIRWays Reporting System User Guide 2018–2019
Section II. Setting Up Your Reports So They Make Sense
To filter reports by classes or rosters:
1. Click Filters above the report.
2. Make a selection from the Rosters drop-down list.
3. Click Apply. The affected report updates to show only data for that class or roster.
4. Optional: To revert all filters to their defaults, open
Filters and click Clear Filters.
When roster filters are applied to a report, the row of filter details below the table header shows the rosters
you’re viewing.
© American Institutes for Research 25AIRWays Reporting System User Guide 2018–2019
Section II. Setting Up Your Reports So They Make Sense
For Teachers: Filtering Tests to Suit Your Preferences
Teachers can filter which tests they want to see in their reports. You may want to do this, for example, if you are
an ELA teacher and you don’t want to see your students’ math scores. By default, the data for those math
assessments appear in your reports. You could update your test preferences to exclude all math assessments from
your reports.
Once you’ve set your test preferences, higher-level users will have the option of using them too.
To filter tests to suit your preferences:
Open the My Settings menu and choose Select Tests to
Display. Select the checkboxes beside the tests or
groups of tests you want to display. Click Save & Close.
© American Institutes for Research 26AIRWays Reporting System User Guide 2018–2019
Section II. Setting Up Your Reports So They Make Sense
For School- and District-Level Users: Filtering Classes or Rosters by
Teacher Preferences
School- and district-level users can also narrow down their data based on class or roster. To do so, update your
preferences to specify which classes or rosters appear in your reports. You can choose between the following
options:
• All Rosters: If you select this option, all data for all rosters appear in your reports.
• Teacher Preferences: If you select this option, teachers who excluded a given assessment from their own reports
will not appear in the school test results for that assessment. This option can be useful when you want to exclude
classes a teacher didn’t teach.
For example, suppose Teacher A and Teacher B are both associated with a Grade 7 ELA assessment. Teacher A
updated their test preferences to exclude all ELA assessments. If you are a school-level user and you update your
roster preferences to Teacher Preferences, you will see data for Teacher B in the test results for your school for
Grade 7 ELA, but you will not see data for Teacher A on this report.
To select which rosters to display:
1. From the My Settings drop-down list in the banner,
select Update My Roster Preferences. The Update
My Roster Preferences window appears.
2. Mark the radio button for your preferred roster option.
3. Click Save & Close to close the window.
© American Institutes for Research 27You can also read