The European Cancer Information System (ECIS) web application - European Network of Cancer Registries
←
→
Page content transcription
If your browser does not render page correctly, please read the page content below
JRC TECHNICAL REPORTS

The European Cancer Information
 System (ECIS) web application
             Computing and disseminating
             European statistics on
             cancer burden

             Giorgia Randi, Fabrizio Zaro, Raquel N. Carvalho,
             Carmen Martos, Nadya Dimitrova, Tadeusz Dyba,
             Francesco Giusti, Luciana Neamtiu,
             Emanuele Crocetti, Roisin Rooney, Davor Aslanovski,
             Stefano Adriani, Antonino Brunetto, Silvio Grispo,
             Massimiliano Gusmini, Nicholas Nicholson,
             Enrico Ben, Manola Bettio

             September 2018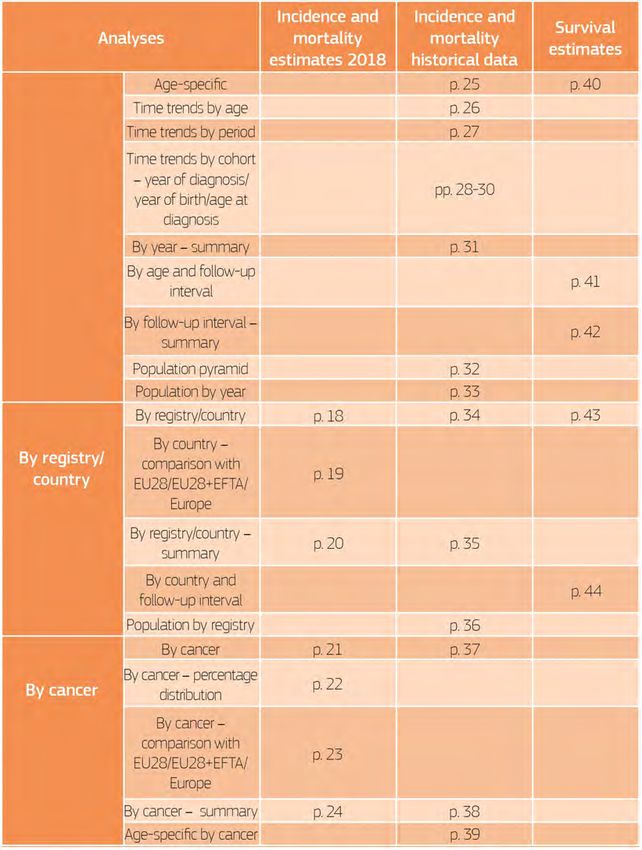
This publication is a Technical report by the Joint Research Centre (JRC), the European Commission’s science and knowledge
service. It aims to provide evidence-based scientific support to the European policymaking process. The scientific output
expressed does not imply a policy position of the European Commission. Neither the European Commission nor any person
acting on behalf of the Commission is responsible for the use that might be made of this publication.

Contact information
Name:		 Manola Bettio
Address: European Commission, Joint Research Centre
				Directorate F – Health, Consumers and Reference Materials –Unit F.1: Health in Society
				        Via Enrico Fermi 2749, TP 127, 21027 Ispra (VA), Italy
E-mail:		   manola.bettio@ec.europa.eu
Web:			     https://ec.europa.eu/jrc/en/research-topic/public-health
Tel.:			    +39 0332 785086

JRC Science Hub
https://ec.europa.eu/jrc/

JRC113106

Ispra: European Commission, 2018

© European Union, 2018

The reuse of the document is authorised, provided the source is acknowledged and the original meaning or message of the
texts are not distorted. The European Commission shall not be held liable for any consequences stemming from the reuse.

How to cite: Giorgia Randi, Fabrizio Zaro, Raquel N. Carvalho, Carmen Martos, Nadya Dimitrova, Tadeusz Dyba, Francesco
Giusti, Luciana Neamtiu, Emanuele Crocetti, Roisin Rooney, Davor Aslanovski, Stefano Adriani, Antonino Brunetto, Silvio
Grispo, Massimiliano Gusmini, Nicholas Nicholson, Enrico Ben, Manola Bettio, The European Cancer Information System
(ECIS) web application; JRC113106

Printed in Italy

The European Cancer Information
 System (ECIS) web application
             Computing and disseminating
             European statistics on
             cancer burden

             Giorgia Randi, Fabrizio Zaro, Raquel N. Carvalho,
             Carmen Martos, Nadya Dimitrova, Tadeusz Dyba,
             Francesco Giusti, Luciana Neamtiu,
             Emanuele Crocetti, Roisin Rooney, Davor Aslanovski,
             Stefano Adriani, Antonino Brunetto, Silvio Grispo,
             Massimiliano Gusmini, Nicholas Nicholson,
             Enrico Ben, Manola Bettio

             September 2018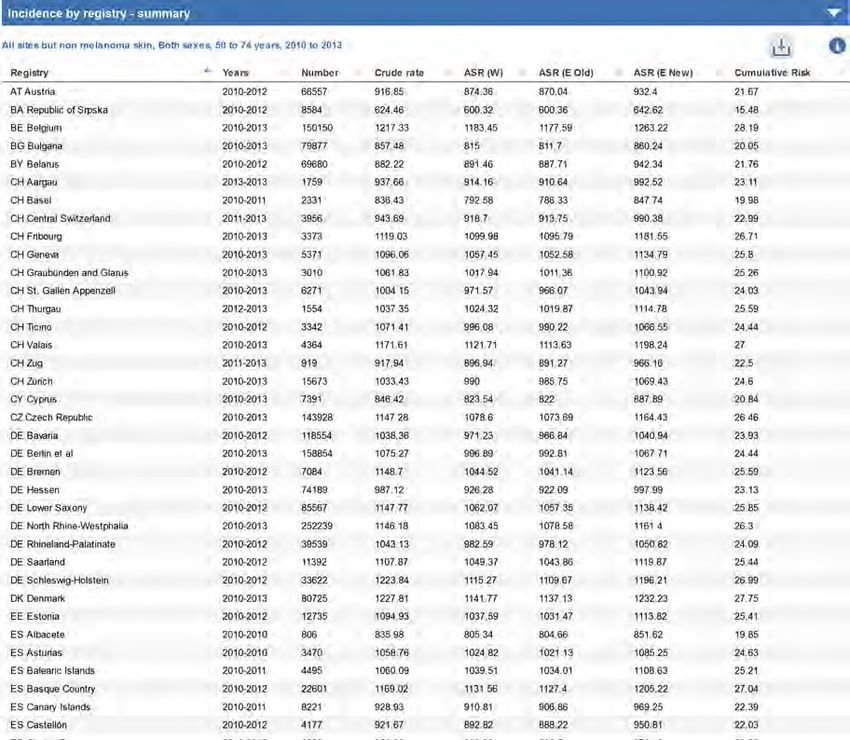
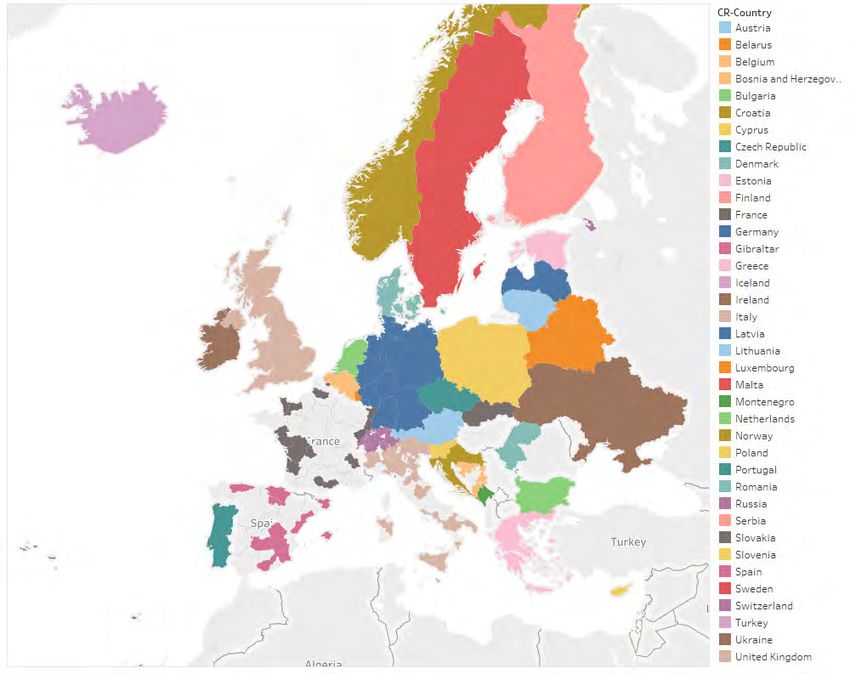
Table of Contents
The European Cancer Information System and the ECIS web application		5

		 Cancer registration in Europe and the European Network of Cancer Registries (ENCR)		    7

		 Cancer burden indicators in the ECIS web application		                                  8

		 Work in progress for ECIS                                                              11

Getting started with the ECIS web application                                             12

		 The ECIS data explorer                                                                 12

		 Selecting the data to be displayed                                                     12

		Exploring, grouping, and exporting the displayed data                                   15

Description of the ECIS analyses                                                          17

		Incidence and mortality estimates – by country                                          18

		Incidence and mortality estimates – by cancer                                           21

		Incidence and mortality historical data                                                 25

		Incidence and mortality historical data – by registry                                   34

		Incidence and mortality historical data – by cancer                                     37

		Survival estimates                                                                      40

		Survival estimates – by country                                                         43

Glossary		                                                                                45

Acknowledgments

The data of population-based cancer registries form the basis for the estimation of the cancer burden
and its trends over time and are crucial in the planning and evaluation of cancer control programmes.

Grateful acknowledgement is given to the European cancer registries for contributing to the initiatives
and studies included in ECIS.
The European Cancer Information System and the
ECIS web application

Cancer is the second most common cause of death in the EU1, claiming many lives and exerting an
enormous toll both on our health systems and on our economy. In order to tackle these challenges more
effectively and to profit from EU-added value, the European Commission has proposed and initiated
a number of actions, including those that transcend the traditional boundaries of health systems and
move into policy areas such as education, environment, taxation, research, and social and external
affairs2. However, actual effectiveness of any such measure cannot be assessed without the availability
of accurate and comparable data on cancer that can be translated into reliable incidence, prevalence,
survival and mortality statistics. For this purpose, the Joint Research Centre (JRC), acting as the scientific
service to the European Commission and in close collaboration with the Commission’s Directorate-
General for Health and Food Safety (DG SANTE) as well as with major European stakeholders in the
field, has started developing a comprehensive cancer information system for Europe.

In 2012, the two Directorate-Generals (DG SANTE and JRC) have first entered into a formal collaboration
with the aim of supporting the European Network of Cancer Registries (ENCR). In order to ensure the
continued administrative functioning of the network, the ENCR secretariat was transferred to the JRC. On
the scientific side, the JRC has been supporting the ENCR in the harmonisation of data and registration
processes. This collaboration has also included the development of specific infrastructural elements
of a European Cancer Information System (ECIS). Building upon existing experience, competence,
and cooperation of cancer registries with membership in the ENCR, and in collaboration with other
stakeholders in the cancer information domain, DG SANTE and JRC have been developing ECIS with the
following aims:
– to monitor the burden of cancer and its trends over time across Europe and its geographical regions;
– to assess the magnitude of the cancer burden and its likely future evolution;
– to illustrate the effects of health policy interventions;
– to establish a reference base for cancer epidemiological research;
– to provide information for further research on possible underlying causes of cancer as well as best
practices for prevention, treatment, and control; and
– to provide information and educational resources to the general public to explain the variations
observed in different populations.

A key component of this integrated and comprehensive system is the so-called ECIS web application.
This web-based module, conceived and developed by the JRC and launched in February 2018, was
designed to provide information on and to visualise the cancer burden indicators. The ECIS web
application displays three different types of information: historical incidence and mortality indicators

1. EUROSTAT. – Causes of death statistics, https://ec.europa.eu/eurostat/statistics-explained/index.php/Causes_of_death_statistics
2. Cf. Communication on Action Against Cancer: European Partnership (COM(2009) 291 final), https://eur-lex.europa.eu/legal-content/EN/
TXT/?uri=celex%3A52009DC0291.

                                                                                            The ECIS web application            |   5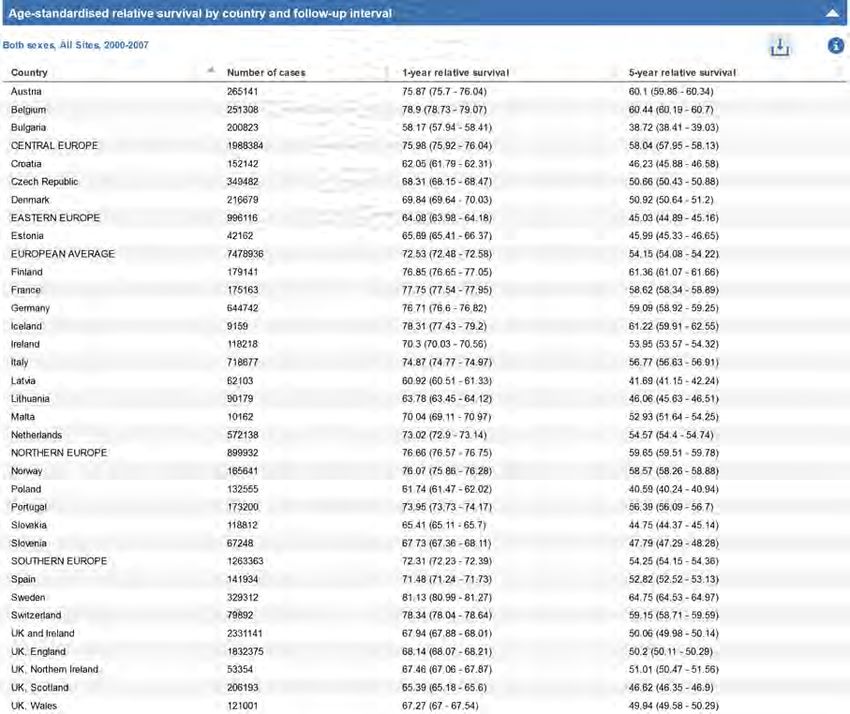
at registry level; national incidence and mortality estimates; and national survival estimates. It permits
the exploration of geographical patterns and temporal trends of incidence, mortality, and survival
based on data submitted by approx. 150 European population-based cancer registries for the major
cancer sites. This enables researchers to assess the magnitude and monitor the cancer burden and its
changing trends over time. The ECIS web application also helps to illustrate the effects of health policy
interventions aimed at reducing the cancer burden.

6   | The ECIS web application
Cancer Registration in Europe and the European Network of Cancer
Registries (ENCR)

Cancer registration in Europe3 comprises some 200 population-based cancer registries, residing in
most European countries. These registries provide information on cancer cases with varying degrees
of geographical coverage, ranging from national to regional and local coverage. There are also notable
differences between registries in terms of data quality and comprehensiveness of reporting.

The ENCR4 was established in 1990, within the framework of the European Commission’s Europe
Against Cancer programme. It promotes collaboration between cancer registries, defines data collection
standards and supports the registries as the providers of the information necessary to quantify and
monitor the burden of cancer in Europe. The ENCR currently comprises 178 individual registries across
Europe (including non-EU countries). Figure 1 shows the tapestry of general cancer registries (i.e. those
that collect data on all cancer sites and on patients of all ages) with ENCR membership.

			            Figure 1. General cancer registries in Europe with ENCR membership

The European Commission’s Joint Research Centre hosts the secretariat of the ENCR and coordinates its
underlying activities.

3. Defined according to the UN definition: http://unstats.un.org/unsd/methods/m49/m49regin.htm#europe, with the addition of Cyprus..
4. http://www.encr.eu/.

                                                                                            The ECIS web application            |      7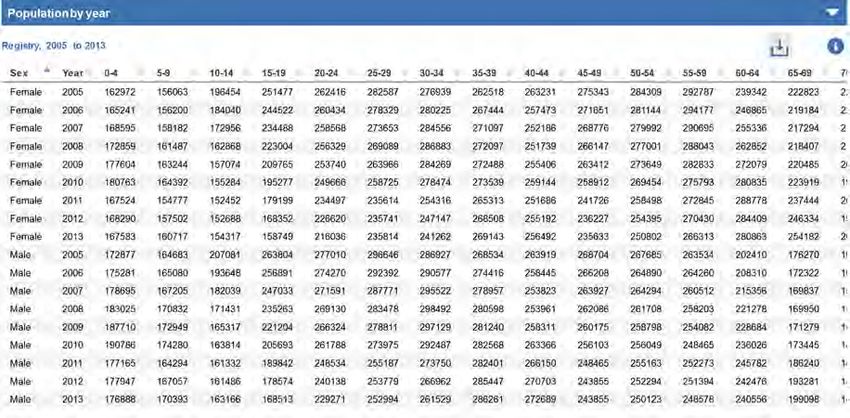
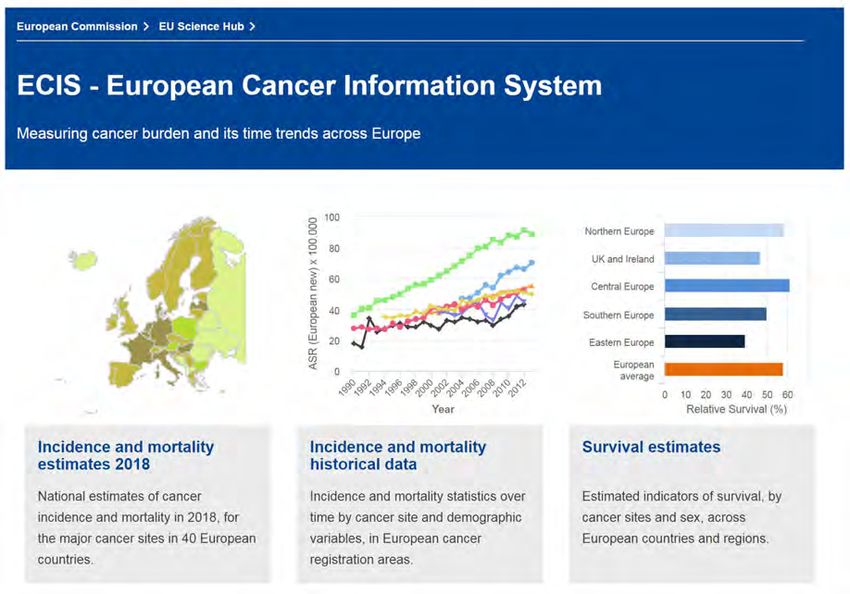
Cancer burden indicators in the ECIS web application

The ECIS web application displays three different types of indicators reporting on the cancer burden in
Europe (Figure 2) that are based on the results of three European studies and projects:

       •		 historical data on incidence and mortality, displayed at cancer-registry level and derived from
       the ENCR-JRC project ‘Cancer Incidence and Mortality in Europe’5;
       •		 national-level survival estimates, derived from the latest published edition of the EUROCARE
       study (currently EUROCARE-5)6;
       •		 2018 incidence and mortality estimates, at national level, developed by the International Agency
       for Research on Cancer (IARC) in collaboration with International Association of Cancer Registries,
       the JRC, and the ENCR.7

Figure 2. The homepage of the ECIS web application

All the cancer indicators displayed in the ECIS web application are based on incidence data submitted

5. https://ecis.jrc.ec.europa.eu/info/initiatives.html#encr-jrc.
6. http://www.eurocare.it/
7. Ferlay J, Colombet M, Soerjomataram I, Dyba T, Randi G, Bettio M, Gavin A, Visser O, Bray F. Cancer incidence and mortality patterns in
Europe: Estimates for 40 countries and 25 major cancers in 2018. Eur J Cancer. 2018 Aug 9. [Epub ahead of print].

8   | The ECIS web application
by the European population-based cancer registries participating in the corresponding projects/studies
(Figure 3). The mortality data come either from the EUROSTAT and WHO or are provided by the European
cancer registries. The population data come from EUROSTAT, WHO, and UN, or they are provided by the
European cancer registries. The cancer burden indicators reported in ECIS are the results of data analysis
at cancer-registry level (incidence and mortality historical data) or at country level (survival estimates
and 2018 estimates of incidence and mortality).
The database feeding the ECIS application is dynamic and updated as new data become available.
The ECIS web application has been developed and is maintained by the JRC and can be accessed here:
https://ecis.jrc.ec.europa.eu/.
National and regional National and regional National and regional
INCIDENCE data MORTALITY data POPULATION data
from European cancer from EUROSTAT/WHO from EUROSTAT/WHO/UN
registries or European cancer registries or European cancer registries
European stadardised data
Data quality revision
quality validation
Data
analysis
ECIS database
CANCER-REGISTRY
COUNTRY LEVEL
LEVEL
Historical incidence Incidence and mortality Cancer survival
and mortality 2018 estimates estimates
Figure 3. Data sources and data flow feeding the database of the ECIS web application
Incidence and mortality estimates for 2018 – the IARC-IACR-ENCR-JRC collaboration
The ECIS web application presents national estimates of incidence and mortality for the major cancer
types in 40 European countries for the year 2018. These estimates are the outcome of an exercise led by
the International Agency for Research on Cancer (IARC) in collaboration with the JRC, the ENCR, and the
International Association of Cancer Registries (IACR). They are based on the historical data on incidence
and mortality provided by European population-based cancer registries.
The ECIS web application | 9The 2018 incidence estimates for 40 European countries are based on the data from European cancer
registries participating in IARC’s CI5: Cancer Incidence in Five Continents vol. XI8 as well as from the
NORDCAN9 database and other published reports. The mortality data was extracted from the WHO
mortality database10.
The 2018 incidence and mortality estimates are shown both for the whole Europe and for the four
geographic European areas:
CENTRAL AND EASTERN EUROPE: Belarus, Bulgaria, Czech Republic, Hungary, Moldova, Poland,
Romania, Russian Federation, Slovakia, and Ukraine;
NORTHERN EUROPE: Denmark, Estonia, Finland, Iceland, Ireland, Latvia, Lithuania, Norway, Sweden,
and United Kingdom;
SOUTHERN EUROPE: Albania, Bosnia Herzegovina, Croatia, Cyprus, Greece, Italy, FYR Macedonia,
Malta, Montenegro, Portugal, Serbia, Slovenia, and Spain
WESTERN EUROPE: Austria, Belgium, France, Germany, Luxembourg, the Netherlands, Switzerland;
Other European areas considered are the EU28 countries and the EU28 plus the four European Free
Trade Association (EFTA) countries (Iceland, Liechtenstein, Norway and Switzerland).
Historical incidence and mortality – the ENCR-JRC Project ‘Cancer incidence and
mortality in Europe’
The ENCR-JRC project on cancer incidence and mortality aims to compute and disseminate indicators
for assessing and monitoring the burden of cancer in Europe and its trends over time. These indicators
can be explored by cancer site, sex, age group, calendar period and geographical area of the registries.
In 2015, the first call for data was sent to all European population-based registries. As of September
2018, a total of 149 registries from 34 European countries have responded and were included in the
ENCR-JRC project. The data submitted by cancer registries on all ages and all cancer sites are included
in the ECIS web application.
The outputs of the project are produced in collaboration with cancer registries and their representative
body – the ENCR Steering Committee.
Survival estimates – the EUROCARE project
EUROCARE (EUROpean CAncer REgistry-based study on survival and care of cancer patients) is the
widest collaborative research project on cancer survival in Europe. The aims of the study are to provide
8. http://ci5.iarc.fr/Default.aspx
9. NORDCAN is the database of cancer statistics for the Nordic countries: Denmark, Finland, Iceland, Norway, Sweden, Faroe Islands and
Greenland, http://www-dep.iarc.fr/NORDCAN/english/frame.asp.
10. http://www.who.int/healthinfo/statistics/mortality_rawdata/en/
10 | The ECIS web applicationan updated description of cancer-survival time trends and differences across European countries; to
measure cancer prevalence; and to study patterns of care of cancer patients.
The ECIS reports the results of the EUROCARE’s study latest published edition, currently EUROCARE-5.
This edition includes data on more than 21 million cancer diagnoses provided by 99 cancer registries in
26 European countries.
The survival estimates in EUROCARE are also provided for the four European regions defined as follows:
NORTHERN EUROPE: Denmark, Finland, Iceland, Norway, and Sweden;
UK AND IRELAND: Ireland; UK (England, Northern Ireland, Scotland, and Wales)
CENTRAL EUROPE: Austria, Belgium, France, Germany, Switzerland, and the Netherlands;
SOUTHERN EUROPE: Croatia, Italy, Malta, Portugal, Slovenia, and Spain;
EASTERN EUROPE: Bulgaria, the Czech Republic, Estonia, Latvia, Lithuania, Poland, and Slovakia.
Work in progress for ECIS
The ECIS web application is continuously updated with new features and data as soon as they are ready
for publication.
Additional features currently under development address the following areas: i) dissemination of data
on paediatric and rare cancers; ii) historical national estimates of cancer incidence in countries without
a national registry; iii) cancer factsheets summarising information from different projects in ECIS by
cancer site.
The ECIS web application | 11Getting started with the ECIS web application The ECIS data explorer The core of the ECIS web application, its data explorer, is divided into three areas, reporting separately on national estimates of cancer incidence and mortality for the most recent year, on incidence and mortality indicators over time (historical data until the most recent available year) at registry level, and on national survival estimates. All the possible analyses (Table 1) can be displayed in the ECIS through maps, charts, and tables, according to the indicator (incidence, mortality, survival) and the scenario selected (analyses specific for registry/country and cancer site, analyses by cancer, analyses by registry/country). Selecting the data to be displayed Filter menu for selections The maps, tables, and charts displaying the ECIS analyses can be modified by selecting different filters in the top menu, including: country/registry, cancer site, sex, age at diagnosis/death, year of diagnosis/ death, and type of indicator (incidence, mortality, population, survival). The filter menu is adjusted to each study/project depending on the corresponding available selections as in this example: Indicator selection The ‘Indicator’ field allows the user to focus on the indicator(s) of interest: 12 | Getting started with the ECIS web application
Country/Registry selection
The ‘Country/Registry’ field enables the selection of the country or registry for the desired analysis. For
historical data, one or more registries can be selected – if more than one are selected, the analyses will
display a comparison between different registries. In the ‘Current selection’ box, the user can unselect
either individual registries or countries.
Selecting the ‘By registry’ or ‘By country’ option enables the user to toggle between different sets of
analyses (Table 1).

Sex selection
The ‘Sex’ field enables the user to choose between ‘Male’, ‘Female’, or ‘Both sexes’. In the latter case,
analyses can be displayed separately for males and females or for both sexes combined.

                                                    Getting started with the ECIS web application    |   13
Cancer site selection The ‘Cancer’ filter depends on the country/registry and sex combination. When more than one tumour site are selected, analyses can be displayed separately by cancer or grouped (all cancers combined). Selecting the ‘By cancer’ option on the menu enables the user to toggle between different sets of analyses (Table 1). Age selection The ‘Age’ filter depends on the data availability following the registry/registries selection. The age at diagnosis is displayed in five-year intervals, with the exception of the last age bracket, which includes all ages over 85. The user can select the age interval to be considered for analysis. 14 | Getting started with the ECIS web application
Year selection
The ‘Year’ field depends on the data availability following the registry/registries selection. The user can
select the range of years to be considered for analysis; when several years are selected, analyses can be
displayed separately for each year or grouped (all years together).

Exploring, grouping, and exporting the displayed data
Help information
Dedicated help windows are available to guide the user understand the meaning of and to interpret
the maps, charts, and tables. The small icon on the right side of each element opens a window with the
corresponding help text.

Specific settings
The ‘Specific settings’ icon allows the user to select different map/chart/table parameters, including:
grouping of cancer sites, sexes, or years when multiple selections are performed, the selection of the
displayed statistic; the length of age-groups; the logarithmic scale; and the reference area.

                                                    Getting started with the ECIS web application    |   15
Visualisation type Data can be visualised in map, chart, or tabular form by clicking on the appropriate icon: Download Maps and charts can be downloaded as PDF, PNG, and JPEG files; tables are downloadable in CSV, PNG, and JPEG file formats. 16 | Getting started with the ECIS web application
Description of the ECIS analyses

The following pages give a description of each ECIS analysis (Table 1), reporting on how to read it and
detailing the specific settings available to the user.

    Table 1. Analyses available in the ECIS data explorer

                                                               Description of the ECIS analyses   |   17
Incidence and mortality estimates - by country ANALYSIS DESCRIPTION SPECIFIC OPTIONS This type of map displays data on estimated The user can select the statistic to be visualised: incidence and/or mortality rates by country for incidence or mortality rates standardised with the selected cancer site and sex. It shows quintiles world standard population, old, or new European of the incidence/mortality statistics, visualised standard population. as different shades of colour (as explained in the The same data can also be visualised in bar-chart legend). or table format. In this example the map shows the estimated age- standardised incidence of all sites (except non- melanoma skin cancers) in the countries belonging to the EU28 and EFTA, for both sexes together. 18 | Description of the ECIS analyses
Incidence and mortality estimates - by country

ANALYSIS DESCRIPTION                                  countries with the corresponding rate of EU28, for
For the selected cancer site and sex, this chart      both sexes together.
plots the relative change, by country and
European region, of the estimated incidence or        SPECIFIC OPTIONS
mortality rates as compared to the rates of the       The user can select the statistic to be visualised:
reference European area. Countries are ordered by     incidence or mortality rates standardised with
decreasing value of the relative change (expressed    world standard population, old, or new European
in percentages and measured along the horizontal      standard population.
axis) for the selected statistic: those with higher   The user can select the reference geographic area
rates being above the reference geographic area,      to be either the EU28, EU28 plus EFTA countries, or
those with lower rates being below the reference      the whole Europe.
geographic area. In this example, the chart           The same data can also be visualised in table
compares the estimated rates of all sites (except     format
non-melanoma skin cancers) of EU28 + EFTA

                                                                Description of the ECIS analyses   |   19
Incidence and mortality estimates - by country ANALYSIS DESCRIPTION SPECIFIC OPTIONS This table presents data on estimated cancer The user can select the list of countries to be incidence or mortality by country and European included in the table by selecting the geographic region, for the selected cancer site and sex. The area: EU28, EU28 + EFTA, or Europe. The table displayed statistics are the number of cases or can be sorted according to each column field deaths, crude rates, and age-standardised rates in ascending or descending order by clicking on (ASR) with world standard population, old, or new corresponding arrows. European standard population. In this example the table shows the estimated incidence statistics of all cancer sites (except non- melanoma skin cancers), by country, for both sexes together, for the EU28 and EFTA. 20 | Description of the ECIS analyses
Incidence and mortality estimates - by cancer

ANALYSIS DESCRIPTION                                    SPECIFIC OPTIONS
This chart plots data on estimated incidence and/       The user can select the statistic to be visualised:
or mortality rates by cancer site for the selected      incidence or mortality rates standardised with
country/region and sex. The cancer sites are            world standard population, old, or new European
ordered by decreasing value of the statistic            standard population.
displayed; if both incidence and mortality are          This data can also be visualised in table format.
selected, the sorting is done according to incidence.
The cancer sites are listed along the vertical axis
and the incidence/mortality rates (per 100,000)
are measured along the horizontal axis.
In this example the chart shows the estimated
age-standardised incidence rates (new European
standard population) of EU28 by cancer, for both
sexes together.

                                                                  Description of the ECIS analyses   |   21
Incidence and mortality estimates - by cancer ANALYSIS DESCRIPTION SPECIFIC OPTIONS This chart reports the percentage distribution of This data can also be visualised in table format. cancers for the selected country/region and sex, in terms of the number of new cases (incidence) or deaths (mortality). In this example the chart shows the estimated percentage frequency distribution of cancer sites in the EU28, for both sexes together. 22 | Description of the ECIS analyses
Incidence and mortality estimates - by cancer

ANALYSIS DESCRIPTION                                   SPECIFIC OPTIONS
This chart plots the relative change of the            The user can select the statistic to be visualised:
estimated incidence or mortality rates for the         incidence or mortality rates standardised with
selected country/region and sex, as compared to        world standard population, old, or new European
the rates of the reference European area, by cancer    standard population.
site. Cancer sites are ordered by decreasing value     The user can select the reference geographic area
of the relative change (expressed in percentages       choosing between EU28, EU28 plus EFTA countries,
and measured along the horizontal axis) for the        or Europe.
selected statistic: those with rates higher than the   This data can also be visualised in table format.
corresponding ones of the reference geographic
area have positive relative change, while those
with rates lower than the reference geographic
area have negative relative change.
In this example the chart compares the estimated
rates for Western Europe with those of the EU28,
for both sexes together.

                                                                 Description of the ECIS analyses   |   23
Incidence and mortality estimates - by cancer ANALYSIS DESCRIPTION SPECIFIC OPTIONS The table presents data on estimated cancer The table can be sorted according to each column incidence or mortality by cancer site, for the field in ascending or descending order by clicking selected country/region and sex. The displayed on the corresponding arrows. statistics are number of cases or deaths, crude rates, and age-adjusted rates (world standard population, old, or new European standard population). In this example, the table shows incidence estimates in Western European countries by cancer site, for both sexes together and all ages. 24 | Description of the ECIS analyses
Incidence and mortality historical data

ANALYSIS DESCRIPTION                                   SPECIFIC OPTIONS
The chart shows age-specific incidence and/or          If more than one sex, cancer site, or year are
mortality rates observed in each age group, by         selected, the user can visualise incidence and/or
registry, cancer sites (separately or grouped),        mortality rates grouping together the two sexes,
year of diagnosis/death (separately or for a time      cancer sites, or the years selected.
interval), and sex (males and females separately       The age-specific rates can be displayed in the
or together). The incidence/mortality age-specific     standard or in the logarithmic scale. This data can
rates (expressed per 100,000) are measured along       also be visualised in table format.
the vertical axis and the age groups appear on the
horizontal axis.
In this example, the incidence and mortality age-
specific rates for colon cancer are shown separately
for males and females in the period 2004-9, for
age groups ranging from 50-54 to 70-74 years.

                                                                 Description of the ECIS analyses   |   25
Incidence and mortality historical data ANALYSIS DESCRIPTION SPECIFIC OPTIONS The chart shows the trends in age-specific If more than one sex or cancer site are selected, incidence and/or mortality rates over a period of the user can visualise incidence and/or mortality time, separately in each age group (and sex) for rates grouping together the two sexes or cancer selected cancer site(s). The incidence/mortality sites. age-specific rate (expressed per 100,000) is The span of the age groups can be modified measured along the vertical axis and the year at choosing between 5, 10, 15, and 30 years. diagnosis/death appears on the horizontal axis. The age-specific rates can be displayed in the The lines in the chart show the time patterns of standard or in the logarithmic scale. This data can age-specific rates by year of diagnosis/death. also be visualised in table format. In this example, the age-specific incidence rates for all cancer sites (excluding non-melanoma skin cancers) for both sexes together are reported for the period 2001-13, separately for the age groups 30-44, 45-59, 60-74, and 75+ years. 26 | Description of the ECIS analyses
Incidence and mortality historical data

ANALYSIS DESCRIPTION                                   SPECIFIC OPTIONS
This chart reports incidence and/or mortality trends   If more than one sex or cancer site are selected,
over the selected time period of diagnosis/death,      the user can visualise incidence and/or mortality
by sex and cancer site. The incidence/mortality        statistics grouping together the two sexes and
rates (expressed per 100,000) are measured along       cancer sites.
the vertical axis and the years at diagnosis/death     The user can select the statistic to be visualised:
appear on the horizontal axis.                         number of new cases/deaths; crude or age-
In the example above, age-standardised incidence       standardised rates (ASR), for world standard
and mortality rates (old European standard             population, old, or new European standard
population) computed separately for men and            population; or cumulative risks.
women in the age interval 0-84 years are plotted       The incidence and mortality statistics can be
for the period 1990-2014, for all sites (except non-   displayed in the standard or in the logarithmic
melanoma skin cancers).                                scale.
                                                       This data can also be visualised in table format.

                                                                 Description of the ECIS analyses   | 27
Incidence and mortality historical data ANALYSIS DESCRIPTION SPECIFIC OPTIONS One approach to summarising time trends by The user can toggle between the ‘By cohort – year cohort is to look at the patterns by year of birth. of birth, ‘By cohort – year of diagnosis’, and ‘By In this chart, age-specific rates stratified by age cohort – age at diagnosis’ views. group at diagnosis/death are plotted against The incidence and mortality age-specific rates can year of birth (cohorts in five-year intervals). The be displayed in the standard or in the logarithmic incidence/mortality age-specific rates (expressed scale. per 100,000) are measured along the vertical axis This data can also be visualised in table format. and the years of birth appear on the horizontal axis. In the example above, the five-year age-specific incidence rates (from 50-54 to 70-74 years of age at diagnosis) of all sites (excluding non-melanoma skin cancers) are plotted against the years of birth, ranging from 1908-12 to 1958-62, for men. 28 | Description of the ECIS analyses
Incidence and mortality historical data

ANALYSIS DESCRIPTION                                  SPECIFIC OPTIONS
Another approach to summarising time trends by        The user can toggle between the ‘By cohort – year
cohort is to look at the patterns according to the    of diagnosis’, ‘By cohort – year of birth’, and ‘By
year when the disease was diagnosed or death          cohort – age at diagnosis’ views .
occurred.                                             The incidence and mortality age-specific rates can
In this chart, age-specific rates stratified by age   be displayed in the standard or in the logarithmic
group at diagnosis or death (five-year groups)        scale.
are plotted against time of diagnosis or death        This data can also be visualised in table format.
(five-year intervals). The incidence or mortality
age-specific rates (expressed per 100,000) are
measured along the vertical axis and the years at
diagnosis/death appear on the horizontal axis.
In the example above, the age-specific rates (age
at diagnosis in five-year intervals, from 50-54 to
70-74 years) for all cancer sites (excluding non-
melanoma skin cancers) are plotted by five-year
intervals of diagnosis, corresponding to intervals
from 1978-82 to 2008-12, for men.

                                                                Description of the ECIS analyses   |   29
Incidence and mortality historical data ANALYSIS DESCRIPTION SPECIFIC OPTIONS A third approach to summarising time trends The user can toggle between the ‘By cohort – age by cohort is to look at the patterns by the age at diagnosis’, ‘By cohort – year of birth’, and ‘By at diagnosis or death. In this type of chart, age- cohort – year of diagnosis’ views. specific rates stratified by year of birth (cohorts The incidence and mortality age-specific rates can in five-year intervals) are plotted against the age be displayed in the standard or in the logarithmic group of diagnosis or death (five-year groups). scale. The incidence or mortality age-specific rates This data can also be visualised in table format. (expressed per 100,000) are measured along the vertical axis and age-groups at diagnosis/death appear on the horizontal axis. In the example above, the five-year age-specific rates are plotted by age at diagnosis (from 50-54 to 70-74 years), for the different cohorts of men born in the five-year intervals from 1908-12 to 1958-62. 30 | Description of the ECIS analyses
Incidence and mortality historical data

ANALYSIS DESCRIPTION                                     SPECIFIC OPTIONS
The table presents data on cancer incidence or           The table can be sorted according to each column
mortality by year, in the selected time period. Output   field in ascending or descending order by clicking
statistics are: the number of new cases, crude and       on the corresponding arrows.
age-adjusted rates (world standard population,
old, or new European standard population), and
cumulative risk. In this example, the table reports
incidence statistics for all cancers (excluding non-
melanoma skin cancers) in the period 2005-13 for
all ages.

                                                                   Description of the ECIS analyses   |   31
Incidence and mortality historical data ANALYSIS DESCRIPTION SPECIFIC OPTIONS This chart plots population data by sex and age This data can also be visualised in table format. group for the selected registry and year(s). If more than one year is selected, the mean population for the period is displayed. The age groups appear on the vertical axis, and the the number of residents (expressed in thousands) are measured along the horizontal axis. In this example, the chart shows the mean population for years 2010-13 by sex and age group in the geographic area covered by the registry. 32 | Description of the ECIS analyses
Incidence and mortality historical data
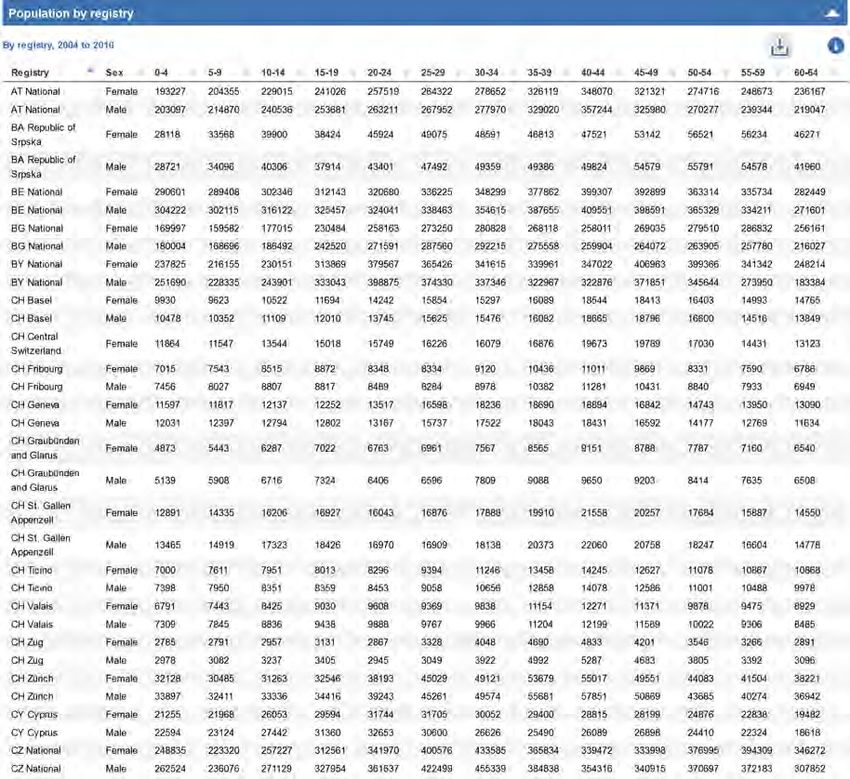
ANALYSIS DESCRIPTION SPECIFIC OPTIONS
This table reports the population data by sex, year, The table can be sorted according to each column
and age group for the selected registry. field in ascending or descending order by clicking
In this example, the table shows the population on the corresponding arrows.
by year (2005-13), sex, and age group in the
geographic area covered by the registry.
Description of the ECIS analyses | 33Incidence and mortality historical data - by registry ANALYSIS DESCRIPTION rates of all cancer sites (excluding non-melanoma This chart plots incidence and/or mortality skin cancers) for registries providing data in the statistics by registry for the selected cancer site, time period 2010-13, for both sexes together, for sex, age interval, and time period. Registries are cases diagnosed at ages 50-74. ordered by decreasing value of the visualised statistic. If both incidence and mortality are SPECIFIC OPTIONS selected, the sorting is done according to incidence. The user can select the statistic to be visualised: The registries are listed on the vertical axis and the number of new cases/deaths, crude or age- incidence/mortality rates (expressed per 100,000) standardised rates (world standard population, are measured along the horizontal axis. old, or new European standard population), or This example shows the age-standardised cumulative risks. (European new standard population) incidence This data can also be visualised in table format. 34 | Description of the ECIS analyses
Incidence and mortality historical data - by registry

ANALYSIS DESCRIPTION                                  SPECIFIC OPTIONS
The table presents data on cancer incidence or        The table can be sorted according to each column
mortality for the selected cancer site by registry.   field in ascending or descending order by clicking
It includes the following statistics: number of new   on the corresponding arrows.
cases or deaths, crude and age-adjusted rates
(world standard population, old, or new European
standard population), and cumulative risk.
This example shows the incidence statistics by
cancer registry of all cancer sites (excluding non-
melanoma skin cancers) in the time period 2010-
13, for both sexes together, for cases diagnosed at
ages 50-74.

                                                                Description of the ECIS analyses   |   35
Incidence and mortality historical data - by registry ANALYSIS DESCRIPTION SPECIFIC OPTIONS The table presents the population data by registry, The table can be sorted according to each column sex, and age group. If more than one year is field in ascending or descending order by clicking selected, the mean population for the period is on the corresponding arrows. displayed. In this example, the table shows the population by registry, sex, and age group for the period 2004- 10. 36 | Description of the ECIS analyses
Incidence and mortality historical data - by cancer
ANALYSIS DESCRIPTION sexes, for the period 2010-13, with age at diagnosis
This chart plots incidence and/or mortality /death in the interval 50-74 years.
statistics by cancer site for the selected registry,
sex, age interval, and time period. SPECIFIC OPTIONS
The cancer sites are ordered by decreasing The user can select the statistic to be visualised:
value of the visualised statistic. If both incidence number of new cases/deaths, crude or age-
and mortality are selected, the sorting is done standardised rates (world standard population,
according to incidence. The cancer sites appear old, or new European standard population), or
on the vertical axis and the incidence/mortality cumulative risks.
statistic are measured along the horizontal axis. This data can also be visualised in table format.
In this example, the incidence and mortality rates
(expressed by 100,000) standardised using the old
European standard population are shown, for both
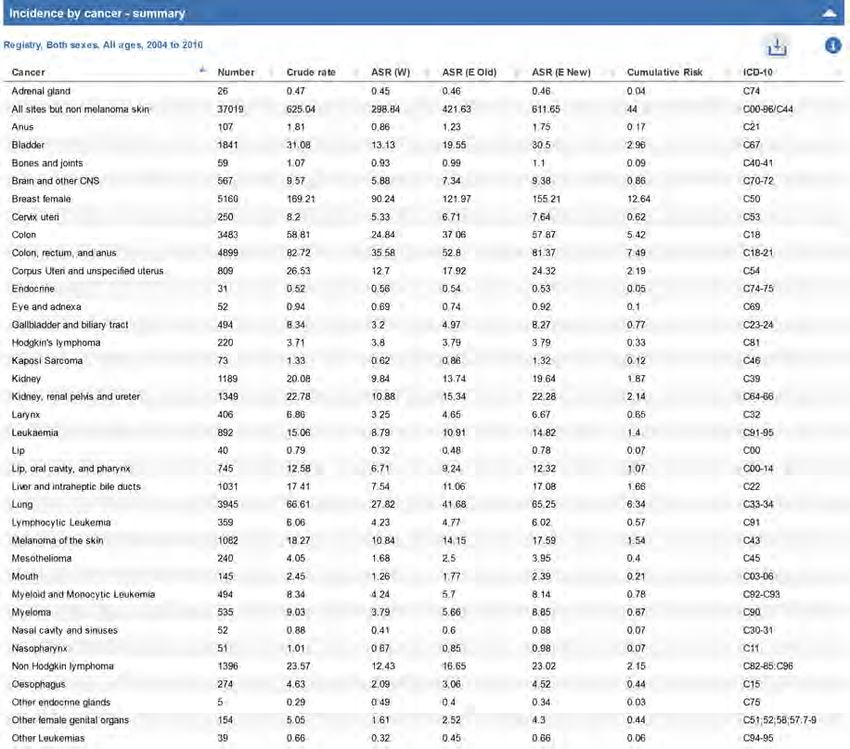
Description of the ECIS analyses | 37Incidence and mortality historical data - by cancer ANALYSIS DESCRIPTION SPECIFIC OPTIONS The table presents data on cancer incidence or The table can be sorted according to each column mortality for the selected registry by cancer site. field in ascending or descending order by clicking It includes the following statistics: number of new on the corresponding arrows. cases or deaths, crude and age-adjusted rates (world standard population, old, or new European standard population), and cumulative risk. In this example, the table describes the incidence for both sexes together, for cases of all ages diagnosed in the period 2004-10. 38 | Description of the ECIS analyses
Incidence and mortality historical data - by cancer

ANALYSIS DESCRIPTION                                     SPECIFIC OPTIONS
The table presents data on cancer incidence or           The table can be sorted according to each column
mortality by cancer site and age group for the           field in ascending or descending order by clicking
selected registry, sex, age interval, and time period.   on the corresponding arrows.
It includes the following statistics: number of new
cases or deaths, crude and age-adjusted rates
(world standard population, old, or new European
standard population), and cumulative risk.
In this example, the table shows incidence statistics
by cancer for both sexes, diagnosed in the period
2004-10, with age at diagnosis in the interval 50-
74 years of age.

                                                                   Description of the ECIS analyses   | 39
Survival estimates ANALYSIS DESCRIPTION SPECIFIC OPTIONS The chart shows the five-year observed or relative If more than one sex is selected, the user can survival (%) for adult (aged 15 and over) patients visualise survival for both sexes together. diagnosed with the selected cancer in 2000-7 The user can select the statistic to be visualised according to the age at diagnosis in the selected choosing between observed and relative survival. country. The 5-year observed or relative survival This data can also be visualised in table format. figures (expressed in percentage) are measured along the vertical axis and the age at diagnosis appears on the horizontal axis. Each line in the chart represents one country and one cancer site. This example shows the 5-year relative survival for breast cancer in two different European regions according to age at diagnosis. 40 | Description of the ECIS analyses
Survival estimates

ANALYSIS DESCRIPTION                                   SPECIFIC OPTIONS
The chart shows the age-specific and age-              If more than one sex is selected, the user can
standardised observed and relative survival at         visualise survival grouping men and women
different follow-up intervals for adult (aged 15 and   together.
over) patients diagnosed with the selected cancer      The user can visualise the age-specific survival of
in 2000-7 in the selected countries or European        an age group or the survival standardised by age
areas. European average figures are population-        using the International Cancer Survival Standards
weighted averages of the country-specific relative     (ICSS).
survival estimates. The relative survival (expressed   The user can select the statistic to be visualised
in percentage) is measured along the vertical axis     choosing observed or relative survival.
the follow-up intervals appear on the horizontal       This data can also be visualised in table format.
axis. Each line in the chart represents a specific
age group/cancer site/country.
This example shows (for each age group) the
relative survival of women diagnosed with lung
cancer after one to five years after diagnosis.

                                                                 Description of the ECIS analyses   |   41
Survival estimates ANALYSIS DESCRIPTION SPECIFIC OPTIONS The table shows the number of adult (aged 15 and The table can be sorted according to each column over) patients diagnosed with the selected cancer field in ascending or descending order by clicking in 2000-7 in the selected country and the observed on the corresponding arrows. and relative survival at one, three, and five years after diagnosis. The number of cases and the survival are expressed by age groups at diagnosis and for all adult ages together. The observed and relative survival estimates for all adults are age- standardised. Age standardisation is achieved with cancer-specific weightings obtained from the International Cancer Survival Standards (ICSS). This example shows the observed and relative survival of women diagnosed with lung cancer after one, three, and five years after diagnosis. 42 | Description of the ECIS analyses
Survival estimates - by country

ANALYSIS DESCRIPTION                                    made with the direct method using cancer-specific
The chart shows the relative survival at five years     weightings obtained from the International Cancer
after diagnosis for adult (aged 15 and over) patients   Survival Standards (ICSS). The survival estimate
diagnosed with the selected cancer in 2000-7 by         of all sites, except non-melanoma skin cancers, is
country. Each blue bar corresponds to the survival      also cancer-site, case-mix standardised.
estimate of each European country, while orange         This example shows age-standardised five-year
and orange-bordered bars refer respectively to          relative survival of patients diagnosed with cancer
Europe as a whole and to five European areas            in all sites by European regions and country.
(Northern Europe, UK and Ireland, Central Europe,
Southern Europe and Eastern Europe). Relative           SPECIFIC OPTIONS
survival for Europe is computed as the weighted         The user can select the statistic to be visualised:
average of country-specific survival estimates. All     age-standardised five-year observed or relative
relative survival estimates refer to all adult ages     survival.
and are age-standardised. Age standardisation is        This data can also be visualised in table format.

                                                                  Description of the ECIS analyses   |   43
Survival estimates - by country ANALYSIS DESCRIPTION made with the direct method using cancer-specific The table shows the number of adult patients (aged weightings obtained from the International Cancer 15 and over) diagnosed with the selected cancer in Survival Standards (ICSS). The survival estimates 2000-7, and the age-standardised relative survival of all sites except non-melanoma skin cancers are at one and five years after diagnosis by European also cancer-site, case-mix standardised. country and area (Northern Europe, UK and Ireland, Central Europe, Southern Europe, Eastern SPECIFIC OPTIONS Europe, and Europe as a whole). Relative survival The table can be sorted according to each column for Europe is computed as the weighted average field in ascending or descending order by clicking of country-specific survival estimates. The relative on the corresponding arrows. survival estimates refer to all adult ages and they are age-standardised. Age standardisation is 44 | Description of the ECIS analyses
GLOSSARY

Adjustment A summarising procedure applied            Crude rate The crude rate is the ratio of the
to a statistical measure in which the effects of      number of new cases or deaths in a specified
differences in composition of the populations         population and time period to the size of the
being compared have been minimised by                 population at risk during the same time period.
statistical methods.                                  Incidence and mortality rate are usually presented
                                                      as an annual rate per 100,000 persons at risk.
Age-specific rate An age-specific rate is the
incidence or mortality rate for a specified age       Cumulative risk Cumulative incidence/mortality
group, in which the numerator and denominator         is the probability or risk of individuals getting/
refer to the same age group; it is expressed as the   dying from the disease over a specified age-
number of new cancer cases or deaths per 100,000      span. Cumulative risk is expressed as the number
population at risk. Five-year age categories are      of cases/deaths per 1000 person-years that are
normally used (highest group 85+).                    expected to occur in a given population between
                                                      the specified age limits (e.g. between birth and
ASR (age-standardised rate) The ASR is a              the age 84 years) if the cancer rates were as
weighted mean of the age-specific rates where the     those observed in the specified time period
weights are taken from the population distribution    in the absence of competing causes. Like the
of a standard population; the ASR is expressed per    age-standardised rate, cumulative risk permits
100,000. Comparison of rates referring to different   comparing between populations of different age
time periods or different geographical areas is       structures.
only possible after considering the differences in
the age structure of the underlying populations.      Incidence Incidence is the number of new cases
The age-standardisation allows the comparison         arising in a given period in a specified population.
of the rates that are arithmetically adjusted to      This information is collected routinely by cancer
have the same age structure of the standard           registries. It can be expressed as an absolute
population. The standard population used in the       number of cases per year or as a rate per 100,000
ECIS are the following old European Standard          persons per year (see age-specific rate and rate
Population, new European Standard Population,         above). The rate provides an approximation of the
and World Standard Population.                        average risk of developing a cancer in a population
                                                      for the time period of reference.

                                                                                        Glossary    | 45
Mortality Mortality is the number of deaths the survival probability of cancer patients in the
occurring in a given period in a specified population. absence of other causes of death, which can vary
It can be expressed as an absolute number of widely between countries. In the EUROCARE-5
deaths per year or as a rate per 100,000 persons study the expected survival was estimated by
per year. the Ederer II method from the lifetables of all
causes mortality by age, sex, cancer registry
Population at risk The part of a population and calendar year. Relative survival of patients
which is susceptible to develop a specific cancer. It diagnosed in 2000-2007 and followed up to 2008
is defined on the basis of demographic data, such was estimated using the classic cohort approach.
as place of residence, sex, age group, etc. Years of Relative survival was standardised by age using
risk duration are counted in person-years. the International Cancer Survival Standards
(ICSS). The mean European relative survival was
Relative change The relative change compares estimated by weighting country-specific relative
two age-standardised rates (ASR): the rate of the survival by the country population.
selected country with the rate of the selected
reference (Europe or EU28). The formula is: Survival or Observed survivval It is the
(ASRcountry - ASRreference) / ASRreference. probability to survive after a given time from
For example, a relative change of +5% indicates diagnosis (1,3, or 5-year), regardless from the
that the country rate is 5% higher than the selected cause of death. Observed survival probability is
reference rate. Similarly, a relative change of -10% influenced by mortality due to cancer and to other
indicates that the country rate is 10% lower than causes of death. In international comparisons of
the selected reference rate. cancer survival the effect of causes other than
cancer, which can vary widely by countries, is
Relative survival The relative survival is a removed by using relative survival.
standard indicator for comparing cancer survival
in population-based studies when the underlying
cause of death in unknown. Relative survival is
the ratio of the observed survival of patients to References:
the expected survival in a comparable group in Greenland, Sander, et al. A Dictionary of
the general population for the same region, age, Epidemiology. Vol. 6, edited by Miquel Porta,
sex and calendar year. It can be interpreted as Oxford University Press, 2014
46 | GlossaryEurope Direct is a service to help you find answers to your questions about the European Union Free phone number (*): 00 800 6 7 8 9 10 11 (*) Certain mobile telephone operators do not allow access to 00 800 numbers or these calls may be billed. A great deal of additional information on the European Union is available on the Internet. It can be accessed through the Europa server http://europa.eu How to obtain EU publications Our publications are available from EU Bookshop (http://publications.europa.eu/howto/index_en.htm), where you can place an order with the sales agent of your choice. The Publications Office has a worldwide network of sales agents. You can obtain their contact details by sending a fax to (352) 29 29-42758.
JRC Mission

As the science and knowledge service
of the European Commission, the Joint
Research Centre’s mission is to support
EU policies with independent evidence
throughout the whole policy cycle.

		EU Science Hub
		ec.europa.eu/jrc

     @EU_ScienceHub

     EU Science Hub - Joint Research Centre

     Joint Research Centre

     EU Science Hub
You can also read