TRAIL COUNTER DATA REPORT - Tahoe Rim Trail Association
←
→
Page content transcription
If your browser does not render page correctly, please read the page content below
2020
       TRAIL COUNTER
        DATA REPORT
TABLE OF CONTENTS

                     REPORT SUMMARY
In order to better understand trail use levels and trends, the Tahoe             PROGRAM OVERVIEW		         1
Rim Trail Association deploys passive infrared and magnetic trail
                                                                                  •   PROGRAM DESCRIPTION
                                                                          01
counters in various places within the Tahoe Rim Trail system. In
2020, data from 17 counters was successfully recovered, and the                   •   PROGRAM GOALS
data collected have been analyzed. In general, the counters have                  •   2020 COUNTERS
confirmed anecdotal and observational evidence and suggest                        •   LIMITATIONS
that there was a large increase of users in the early part of 2020
compared to 2019. This was due to the popularity of trail-based
recreation in the face of the pandemic. However, use dropped off
precipitously in September due to the heavy smoke in the area from               INFRARED COUNTERS		        6
wildfires and widespread and long-lasting forest closures. While
trends from previous years indicated that use on the Tahoe Rim
Trail was increasing rapidly and growing by an average of 5-6%
                                                                          02      •
                                                                                  •
                                                                                      ANALYSIS TECHNIQUES
                                                                                      IR COUNTER RESULTS
each year, the overall number of users on the trail this year is lower.
The combination of intense increased use early in the season and
much lower use later in the season is unprecedented.

Although the data do have limitations, the conclusions reached in                BICYCLE COUNTERS		         21
this report represent a good faith effort to evaluate trail use on the
Tahoe Rim Trail system using the best available information. With
the results reported here, and by collecting additional data in the
                                                                          03      •
                                                                                  •
                                                                                      ANALYSIS TECHNIQUES
                                                                                      MB COUNTER RESULTS
future, the Tahoe Rim Trail Association and its partners can have
defensible data upon which to make management decisions.

               For more information, please contact:
                                                                                 NEXT STEPS				             23
                    Tahoe Rim Trail Association
                     info@TahoeRimTrail.org
                                                                          04      •
                                                                                  •
                                                                                      LESSONS LEARNED
                                                                                      RECOMMENDATIONS
                          775.298.4485                                                FOR 2021 & BEYOND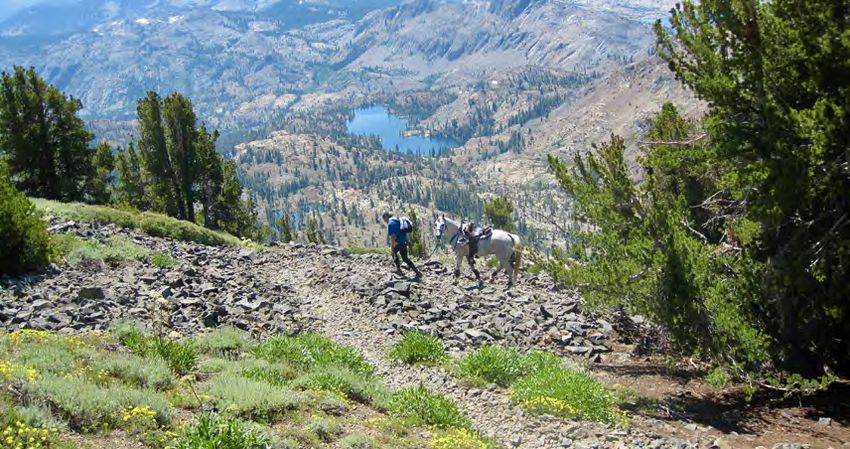
PROGRAM OVERVIEW
                 PROGRAM DESCRIPTION                                                                   Specifically, for 2020 this report seeks to analyze collected data to answer the following
                 Both anecdotal and scientific observations have concluded that recreation             key questions:

    01           use in the Tahoe Basin is on the rise and is currently at historically high levels.
                 Visitation to the Basin is estimated at over 5.7 million annually, and among
                 those visitors recreation in the form of hiking and mountain biking is more
                                                                                                             1) Which areas of the trail receive Very High, High, High-Moderate, Moderate, and
                                                                                                                Low use?
                 popular than ever before. As one of the premier outdoor recreation resources                2)What are the trends in trail use in general and on different segments? Did trail use
in the Basin, the 200-mile Tahoe Rim Trail (TRT) system is seeing more users than ever before.                  increase drastically from 2019 to 2020?
The unprecedented effects of the COVID-19 pandemic caused use to increase dramatically.                      3)How many trail users recreate on the Tahoe Rim Trail system annually?
in the early portion of 2020, but widespread smoke and forest closure orders caused that                     4) How many mountain bikes are trespassing on the PCT/TRT between Benwood
use to drop off substantially later in the year. Understanding use levels and trends on the trail               Meadow and Meiss Meadow, and near Barker Pass? What are the trends in the
is essential for adjusting management strategies to meet evolving challenges.                                   Benwood to Meiss Meadow area?

Beginning in 2007, the Tahoe Rim Trail Association (TRTA) has deployed trail counters to               The digital databases that store and help analyze the data recorded by the trail counters are
monitor use levels. The first few years of monitoring were spotty, without enough counters             maintained both through a Geographical Information System (GIS) and online via the TRAFx
to cover much of the trail. However, with the recent and ongoing acquisition of additional             Datanet website.
hardware, the organization now owns approximately two dozen infrared (IR) trail counters
and half a dozen magnetic bicycle (MB) counters. The IR counters collect information on all            This report was developed to share the knowledge gained through the trail counter program
trail users while the MB counters collect information only on wheeled traffic (mountain bikes).        throughout the TRTA and amongst partners.
Both counter types collect data in the form of individual trips or hits: each time someone
passes the counter a single trip or hit is recorded. Counters allow for close monitoring of
multiple sites around the trail at any given time and can potentially provide data for informing
critical management decisions.

The data gathered through this program is of particular use for identifying and managing
high-use areas where additional resources may be warranted to reduce environmental risks,
repair or prevent tread deficiencies, or mitigate natural resource damage. In addition, the
data is essential for establishing baseline use numbers before connector trails are built and
for assessing the increased traffic from those trails. Further, the counters are a powerful tool
in monitoring illegal trail use, such as mountain bike incursions into designated wilderness
areas. The data resulting from this program can also be used to more accurately assess
the overall number of trail users on the TRT and to create stronger arguments regarding
relevancy when competing for funding, marketing the TRTA’s services, or any time that
quantifying the significance of the trail would be useful.

PROGRAM GOALS
The overall goal of the visitor use monitoring program is to provide data to support decisions                                         Hiker on the trail at Fontanillis Lake.
made both on and off the trail. In general, the goals of this program are to:
                                                                                                       2020 COUNTERS
      1) Collect high-quality data on trail use through remote counters,                               In 2020, 21 IR and 6 MB counters were active in the field. Of these, 3 IR counters were installed
      2) Develop a digital database that stores information derived from the counters, and             in 2019 with the intention that they over-winter to collect data from multiple seasons. In
      3) Analyze and share the data with staff, volunteers, partners, and the public so that           total, 16 IR counters and 3 MB counters collected usable field data for analysis in 2020 (see
          it can be used to inform management decisions, fundraising, and other programs.              Map 1 and Map 2 for exact locations). Though it varied by counter, on average the devices
                                                                                                       collected data for between three and four months from late-June to early-October. One MB

                                                 1                                                                                                       2
2020 INFRARED TRAIL MOUNT ROSE
WILDERNESS
COUNTER LOCATIONS Mt Rose West
counter was not recovered. One of the IR counters did not collect any data. Four of the IR Mt Rose Center
MAP 1 Mt Rose East
Tahoe Meadows
counters collected data that was clearly inaccurate. This was also the case with two of the South (Failed)
MB counters.
The counter that collected no data was at Tahoe Meadows South - it suffered an error with
the date and never began collecting. The four counters that collected data that was clearly TAHOE
wrong (all these counters had virtually no hits but occasionally recording extremely high NATIONAL
numbers in very short periods of time) were Tunnel Creek South, Spooner North, Spooner FOREST Tunnel Creek
South (Failed)
South, and K to K #2. The failures were likely due to poor placement. Christopher's Loop
North
The MB counters that failed were the Barker North and Barker South counters. It is not
CALIFORNIA
clear why these counters malfunctioned. Though they both collected data, the counts were
NEVADA
clearly too high. They may not have been buried deep enough and therefore were counting
some foot traffic. In addition, the number patterns did not correspond to IR counters placed
GRANITE
nearby. The MB counter at Sayles North was not recovered. CHIEF
WILDERNESS
Spooner North and
LIMITATIONS South (Failed)
The data and conclusions presented in this report are a result of a good faith effort to
accurately portray trail use on the TRT system based on limited information. Both passive Barker North Genoa Peak
infrared and magnetic counters have known issues in collecting accurate numbers of users and South Road North
when they travel in groups and therefore tend to undercount. Due to weather and logistical
constraints, counters traditionally spend only a small portion of the year on the trail, and
prior to 2016 the dates varied widely from year to year and counter to counter. This makes
it impossible to account for known issues that affect use levels, such as the shift northbound ELDORADO
PCT hikers make to travel later in the season when summer snow levels remain high. While NATIONAL Stinger North
FOREST KBN Connector
attempts have been to normalize data the only way to overcome these limitations is to
amass a robust data set that spans similar periods of the year over multiple years.
DESOLATION
WILDERNESS K to K #1
K to K #2 (Failed)
LEGEND
LAKE TAHOE
Tahoe Rim Trail BASIN HUMBOLDT-
System MANAGEMENT TOIYABE
UNIT NATIONAL
National Forest FOREST
Designated Horse Mdw
Wilderness Trail
Lake Tahoe Sayles North
NV State Park Big Mdw North
Scotts Lake S
Successful
View from Dicks Pass. Counter
Showers North
¸
Failed
Sayles South
Counter
3
0 3 6
Miles
4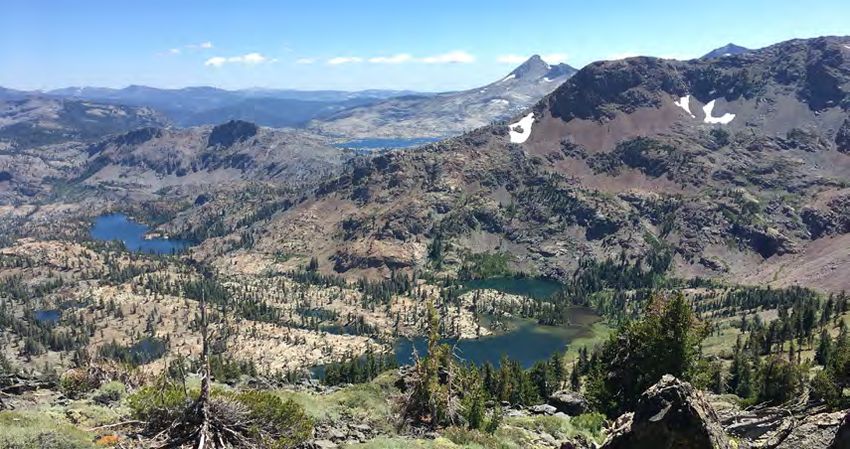
2020 MOUNTAIN BIKE MOUNT ROSE
WILDERNESS
COUNTER LOCATIONS
MAP 2 INFRARED COUNTERS
ANALYSIS TECHNIQUES
TAHOE
NATIONAL
02 Trail Use Levels
In order to answer the question, “Which areas of the trail receive Very High,
High, High-Moderate, Moderate, and Low use?” data on average daily trips
FOREST
(ADT) from the IR counters were utilized. Not all counters collected data
during the same time periods, so data from July 1 through September 30 (92 days) were used
as a common time frame. This period was used because it encompasses the (mostly) snow-
free season with the most comfortable temperatures during which most trail use occurs and
because most IR counters in most years are active during that time. The IR counters that
did not collect accurate data active for that entire period in 2020 were Stinger North, and
Genoa Peak Road North, both of which had clearly incorrect numbers until mid-July. One
GRANITE
CHIEF counter on the K to K trail was moved halfway through the summer so its data is not useful
WILDERNESS
for comparison to that from the other counters.
CALIFORNIA
NEVADA
In order to normalize data that was collected from the Stinger North and Genoa Peak Road
Barker North and North counters a correction equation was applied to those partial data sets to estimate ADT
South (Failed) over the standard of 92 days. To do this, the average percent change in ADT for all units was
calculated for the time frame in which data was collected for the two defective counters.
The ADT for the time frame in which that unit functioned was then multiplied by the average
percent difference of all other units. So the Stinger North unit collected data from July 20 to
ELDORADO September 30. The ADT for that unit in that time frame was 19.5 The average ADT for all the
NATIONAL
FOREST functioning units in that same time period was 45.8 That figure is 91.5% of the ADT for the
functioning units over the entire 92 day period (which is 50.0). 91.5% of 19.5 is 17.8 which is
the corrected ADT for the Stinger North counter. While this is the formula used in years past,
DESOLATION this year it was only necessary to apply it to two counters.
WILDERNESS
To extrapolate use levels for sections of the trail from the counter data, it was assumed that
users were either going out-and-back on the TRT from an access point to a major attraction
(such as from the Mt. Rose Summit parking area to Galena Waterfall) or were creating a loop
using the TRT and another intersecting trail. This method somewhat discounts long-distance
LEGEND
trail users and assumes that most use is day use by people who are returning to their starting
LAKE TAHOE
Tahoe Rim Trail BASIN HUMBOLDT- location rather than point-to-point and/or overnight use.
System MANAGEMENT TOIYABE
UNIT NATIONAL
National Forest FOREST
Trail Use Trends
To answer the question, “What are the trends in trail use in general and on different
Designated Bryan North
Wilderness segments?” historic counter data from 2007-2019 were analyzed alongside 2020 data. The
percent change in ADT over time was calculated by comparing counter data from the same
Lake Tahoe Sayles North location and the same calendar dates from different years.
NV State Park (Failed)
Successful Overall User Numbers
Counter
To answer the question, “How many trail users recreate on the Tahoe Rim Trail system
¸
Failed Showers North annually?” three issues must be addressed. First, the trip calculations made by the counters
Counter
Meiss Mdw 6
0 3 6
Miles
5
must be converted into unique users. Second, the data from the counters must be extrapolated
to estimate use over the entire trail system. Third, data from a short time period must be
extrapolated to estimate use over an entire year. There is no foolproof method to accomplish
any of these three tasks so the final result will be somewhat speculative. Nevertheless, as more
data are collected each year in various locations along the trail, the estimate will improve.

The ADT for the counters in the field between July 1 and September 30 in 2016, 2017, 2018,
2019, and 2020 is already known. To convert these numbers from trips to users, it must be
multiplied by a factor somewhere between 0.5 and 1. Multiplying by a factor of one would
indicate that each trip represents one user, i.e. there were no out-and-back trips past the
same counter and no one was counted by two counters on the same trip. Multiplying by
a factor of 0.5 would indicate that each user passed the counter twice, i.e. every trip was
out and back. We have no data on how many trips were out-and-back or covered enough
distance to register on two counters, but based on observational and anecdotal evidence it
is reasonable to assume that most use on most trail sections was out-and-back day use and                                         Riding the trail above Marlette Lake.
that a majority of users were counted only by one counter on the same trip. To represent
these assumptions a factor of 0.7 is used.                                                         IR COUNTER RESULTS

To extrapolate data from limited locations to estimate use covering the entire trail system,       Trail Use Levels
the number of users must be multiplied by another factor. Based on the results presented in        The ADT for each 2020 counter fell between a low of 17.1 and a high of 122.2, with an average
previous reports and in the Trail Use Levels section of this report (see page 9), trail use data   of 50 (see Table 1). This number compares to an average ADT of 97.4, 122.0, 70.2, and
is available for approximately 39.7% of the trail system in 2016, approximately 26.0% of the       99.7 collected by IR counters in 2016, 2017, 2018, and 2019 respectively. The ADT for 2020
trail system in 2017, approximately 29.2% of the trail system in 2018, approximately 22.5% of      is low because counters placed in areas that generally are much busier (Spooner North,
the trail system in 2019, and approximately 15.0% of the trail system in 2020. Therefore, the      Spooner South, Tahoe Meadows) failed. Additionally, counters were not placed in the areas
data from each year was multiplied by a factor corresponding to each year’s percentage to          that traditionally see the highest counts. Forest closures in the later part of the season also
yield an estimate of the trip data extrapolated to cover 100% of the trail system.                 contributed to the low counts.

Ten IR counters were left out for an entire year or more and collected following the 2018          In years previous to 2018, data from the counters in a given year were classified into Low,
season. The data from these counters suggest that about 69% of all trail use on the TRT            Moderate, and High use categories. However, the abundance of data from 2016-2020 creates
system occurs in the months of July, August, and September (32%, 19%, and 17%, respectively).      an opportunity to utilize more nuanced categories, After excluding data from all but the
June saw 17% of trail use, with steep drop offs for other months, from 7% in October to less       most recent year at sites with collection over multiple years (see Table 3 for a list of these
than 1% in January, February, March, April, and December. This data suggests that many             sites), the high season ADT data from all 64 of the successful IR counter sites 2016-2020
more users than previously believed are on the trail outside the months of July, August            were analyzed. By using a geometric interval optimization classification, five classes were
and September. While reports previous to 2018 utilized an assumption that 80% of all trail         determined: Low, Moderate, High-Moderate, High, and Very High use intervals. Although
use occurs during that 92-day period, this new data suggest that number may be as low as           data from the same sites over time suggest that use is in general increasing from year to
60%. (It should be noted that some of the counters left in place all winter were in remote         year, and therefore data from any given year are not directly comparable with data from any
areas in Desolation Wilderness and likely saw less off-peak season use than parts of the trail     other year, for the purposes of this report the benefits of establishing more detailed classes
that are more accessible throughout the year.) To remain conservative, the extrapolation           from a larger data set outweighs the inherent but minimal error caused by comparing data
of the annual average number of overall trail users from the trip number can be multiplied         from different years.
by a factor of 1/0.7 (1.43). This assumes that 70% of use takes place in the high-use period.
As mentioned above, this is probably a high estimate, which will lead to a lower and more          Using this system, an ADT from 0 to 38.4 (21 locations including 6 2020 sites) is Low Use,
conservative overall figure for total number of trail users in a given year.                       an ADT from 38.5 to 44.4 (6 locations including 2 2020 sites) is Moderate Use, an ADT from
                                                                                                   44.5 to 65.4 (15 locations including 2 2020 sites) is High-Moderate Use, an ADT from 65.5 to
                                                                                                   139.5 (14 locations including 2 2020 sites) is High Use, and an ADT above 139.5 (8 locations,
                                                                                                   none from 2020 sites) is Very High Use.

                                               7                                                                                                   8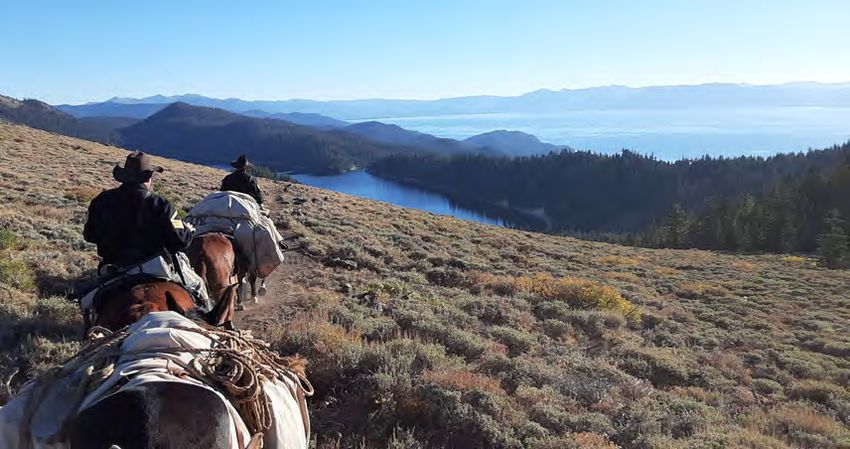
TABLE 1: Average Daily Trips, and Use Levels for 2020 IR counters, including counters that
Very High, High, High-Moderate, Moderate, Low and Unknown trail use levels on the Tahoe     overwintered.
Rim Trail system are shown in Map 3.

Areas of the trail identified as Very High use based on IR counter data from 2016-2020                                                          Average Daily
comprise 11.1 miles or 5.5% of the system and are:                                                    Counter Name            Data Year                           Use Level
                                                                                                                                               Trips, Adjusted*
      1) Brockway East trailhead to the Picnic Rock Vista,                                             Mt Rose West             2020                 20.2            Low
      2) Galena Waterfall Trail from Mt. Rose Summit to the Galena Waterfall,
      3) Tahoe Meadows trailhead and Ophir Creek Trail to the Tyrolean Downhill,
                                                                                                      Mt Rose Center            2019                 17.1            Low
      4) Van Sickle Connector Trail up to the Van Sickle Waterfall,
      5) Big Meadow trailhead south to the Scotts Lake Trail junction, and
      6) Echo Lake trailhead to the southern Desolation Wilderness boundary.                          Mt Rose Center            2020                 24.8            Low

High use areas comprise 38.7 miles or 19.3% of the trail and are:                                      Mt Rose East             2019                 23.7            Low

      1) Tyrolean Downhill to Christopher’s Loop,                                                      Mt Rose East             2020                 39.3         Moderate
      2) North Canyon Trail to Spooner Summit North trailhead,
      3) Spooner Summit South trailhead to the first crossing of Genoa Peak Road,                      Christopher’s
      4) Kingsbury North Connector,                                                                                             2020                 80.9            High
                                                                                                        Loop North
      5) Van Sickle Connector Trail from the waterfall to the TRT,
                                                                                                     Genoa Peak Road
      6) Van Sickle Connector Trail junction to south of the Kingsbury South (Stagecoach)                                       2020                38.5*         Moderate
                                                                                                          North
         Connector Trail junction,
      7) Freel Saddle to Saxon Creek/Mr. Toad’s Wild Ride Trail junction,                              Stinger North            2020                 17.8*           Low
      8) Southern Desolation Wilderness boundary to Gilmore Lake, and
      9) Bayview Trail junction to Velma Lakes Trail junction.
                                                                                                      KBN Connector             2020                 122.2           High
High-Moderate use areas comprise 40.0 miles or 19.9% of the trail and are:
                                                                                                      Horse Meadow                                                 High-
                                                                                                                                2020                 67.4
                                                                                                           Trail                                                  Moderate
      1) Picnic Rock Vista to the northern CA/NV state line,
      2) Christopher’s Loop junction to the north end of the Marlette Peak Loop,                       Big Meadow                                                  High-
                                                                                                                                2020                 56.3
      3) South end of the Marlette Peak Loop to Hobart Road,                                              North                                                   Moderate
      4) Second crossing of Genoa Peak Road to The Bench,                                               Scotts Lake                                                High-
      5) Kingsbury North Connector to the south end of the Daggett Loop,                                                        2020                 54.6
                                                                                                          South                                                   Moderate
      6) Star Lake to Freel Saddle,
      7) The Horse Meadow Trail,                                                                      Showers North             2020                 36.1            Low
      8) Grass Lake Spur to Big Meadow Trailhead,
      9) Scotts Lake Trail to Round Lake,                                                              Sayles South             2020                 25.1            Low
      10) Meiss Meadow/PCT junction to Showers Lake,
      11) Bryan Meadow Trail junction to Echo Summit trailhead spur,
      12) Gilmore Lake to Bayview Trail junction,
      13) Velma Lakes Trail junction to Meeks Bay/Tahoe Yosemite Trail junction,
      14) Barker Pass to the northern PCT/TRT junction at Twin Peaks, and
      15) Page Meadow to Granlibakken Road.

                                              9                                                                                           10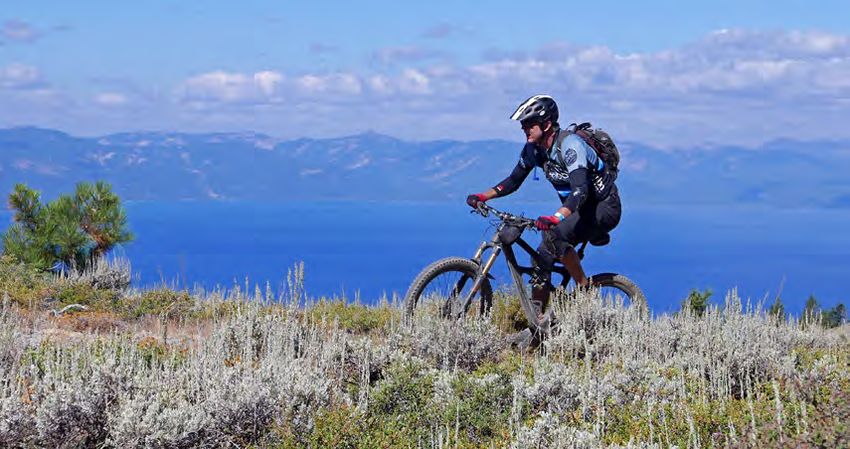
TRAIL USE LEVELS                                MOUNT ROSE
                                                                                                                                                     WILDERNESS
                                                                                                        2016-2020
TABLE 1 (cont.): Average Daily Trips, and Use Levels for 2020 IR counters                                         MAP 3

                                                      Average Daily
          Counter Name            Data Year                             Use Level
                                                     Trips, Adjusted*
                                                                                                 TAHOE
           Sayles North             2020                    31.6          Low                   NATIONAL
                                                                                                 FOREST

           Barker South             2020                    31.3          Low

                                                                         High-
           Barker North             2020                    60.8
                                                                        Moderate

                                                                                         GRANITE
                                                                                           CHIEF
                                                                                        WILDERNESS

                                                                                                                               CALIFORNIA
                                                                                                                                            NEVADA
                                                                                        ELDORADO
                                                                                        NATIONAL
                                                                                         FOREST

                                                                                          LEGENDDESOLATION
                                                                                                     WILDERNESS
                                                                                          National Forest
                                                                                          Designated
                                                                                          Wilderness
                                                                                          Lake Tahoe
                                   Biking near the Bench.
                                                                                          NV State Park
                                                                                                                                   LAKE TAHOE
                                                                                                                                      BASIN                       HUMBOLDT-
                                                                                          Very High Use                            MANAGEMENT                       TOIYABE
                                                                                                                                       UNIT                        NATIONAL
                                                                                          High Use                                                                  FOREST

                                                                                          High-Moderate
                                                                                          Use

                                                                                           Moderate Use

                                                                                                              ¸
                                                                                           Low Use

                                                                                           Unknown Use
                                              10
                                                                                    0       3        6
                                                                                                      Miles
                                                                                                                          11
Moderate use sections comprise 11.7 miles or 5.8% of the trail and are:                           Trail Use Trends
                                                                                                  Twenty locations were analyzed to determine trail use trends, including five that contain
      1) Tahoe City Fairway Drive trailhead to Twin Crags,                                        data sets from 2019 (see Table 2). These locations represent all counter collection points that
      2) Hobart Road to North Canyon Trail,                                                       have successfully collected data for multiple years. All of the locations showed increased
      3) Between the first and second crossings of Genoa Peak Road,                               use over the time period over which data was collected. The average change in use over all
      4) Saxon Creek/Mr. Toad’s Wild Ride Trail junction to Grass Lake Spur, and                  sites was a 67.2% increase, which is approximately a 5.6% increase per year. It is important
      5) Scotts Lake Trail.                                                                       to note that this number does not reflect all the differences and complications inherent in
                                                                                                  measuring users over diverse time periods at different locations. It should also be noted that
Low use sections comprise 70.3 miles or 35.0% of the trail and are:                               the ADT used for trend data may be different than the ADT used to determine overall use
                                                                                                  levels because the time frames analyzed are not identical.
      1) Twin Crags to Brockway Summit Trailhead,
      2) Northern CA/NV state line to the Frog Pond Connector junction,                           In reports previous to 2018, areas of Increased, Decreased, Stagnant, and Unknown Use
      3) The Bench to the Kingsbury North Connector,                                              trends were identified. With the increased availability of trend data from 2018 on, those
      4) Eastern half of the Daggett Loop including the Daggett Summit Connector,                 classifications have been expanded to Large Increase, Moderate Increase, Small Increase,
      5) Brisack Family Vista Trail junction to Van Sickle Connector junction,                    Stagnant, Decreased, and Unknown. This change helps differentiate between areas of the
      6) South of the Kingsbury South (Stagecoach) Connector Trail junction to 			                trail that are seeing vastly different types of use increase, ranging from 3 or 4% to well over
          Monument Pass,                                                                          200%. All twenty sites show an increase in use, but the increase at Brockway West is so
      7) Round Lake Spur junction to Meiss Meadow/PCT junction,                                   small (1%) that it is rated as stagnant. The remaining nineteen sites with increasing use trends
      8) Sayles Canyon Trail junction to Bryan Meadow Trail junction,                             were sorted using a geometric interval classification. Areas with an increase of 13.6% or less
      9) Meeks Bay/Tahoe Yosemite Trail junction to Lake Richardson, and                          are considered a Small Increase in use (six sites), areas with an increase of 13.7-66.9% are
      10) Stanford Rock Trail junction to Ward Creek Boulevard.                                   considered a Moderate Increase in use (five sites), and areas with an increase of 67.0% or
                                                                                                  greater are considered a Large Increase in use (four sites). Use trends are show in Map 4.
The remaining areas of the trail are designated as Unknown use level since there is no reliable
IR counter data for those locations. Approximately 29.2 miles or 14.5% of the trail has not yet   Identified areas of Large Increase in use comprise 15.4 miles or 7.7% of the trail system and
been adequately surveyed for use levels (see Map 3).                                              are:
                                                                                                         1) Brockway East trailhead to the Picnic Rock Vista,
                                                                                                         2) Western Gray Lake Junction to the Relay Peak Road junction,
                                                                                                         3) Galena Waterfall Trail from Mt. Rose Summit to the Galena Waterfall,
                                                                                                         4) North Canyon Trail to Spooner Summit,
                                                                                                         5) Kingsbury North Connector, and
                                                                                                         6) Van Sickle Connector Trail up to the waterfall.

                                                                                                  Identified areas of Moderate Increase in use comprise 21.1 miles or 10.5% of the trail system
                                                                                                  and are:
                                                                                                         1) Martis trailhead to the CA/NV state line,
                                                                                                         2) Ophir Creek trailhead to Tunnel Creek Road
                                                                                                         3) Spooner Summit South trailhead to the first crossing of Genoa Peak Road,
                                                                                                         4) Kingsbury South (Stagecoach) Connector Trail junction to Monument Pass,
                                                                                                         5) Big Meadow trailhead south to the Lake/Christmas Valley Trail junction, and
                                                                                                         6) Echo Lake trailhead to the southern boundary of Desolation Wilderness,

                                                                                                  Identified areas of Small Increase in use comprise 21.5 miles or 10.7% of the trail system and
                                                                                                  are:
                                     Hiking at McCleod Falls                                             1) Tahoe City Fairway Drive trailhead to Third FS73/Fiberboard Freeway crossing,
                                                                                                         2) Saxon Creek/Mr Toad’s junction to the Grass Lake Spur junction,

                                               12                                                                                               16
TABLE 2: Percent change in Average Daily Trips over time. Note that ADT for each counter TABLE 2 (cont): Percent change in Average Daily Trips over time. Note that ADT for each
reflects only the period of time indicated, so numbers will vary from Table 1. counter reflects only the period of time indicated, so numbers will vary from Table 1.
Time Time
Data Years and Percent Data Years and Percent
Counter Name Period Counter Name Period
Average Daily Trips Change Average Daily Trips Change
Analyzed Analyzed
Tahoe City 2007 2009 2014 2018 Big Meadow 2007 2014 2016
6.26 - 10.10 +11.4% 7.19 - 10.1 +32.3%
North 41.3 37.7 65.6 46.0 South 131.2 129.0 173.6
2014 2016 2019 Sayles Canyon 2019 2020
Brockway West 7.17 - 9.26 +1.0% 7.3 - 10.24 +6.7%
28.5 34.9 28.8 North 23.7 25.31
2008 2014 2016 2019 Echo Summit 2014 2016 2017
Brockway East 6.26 - 7.29 +291.4% 7.19 - 11.2 +12.1%
77.5 199.1 256.1 303.3 South 33.1 27.2 37.1
Martis 2017 2018 Echo Lake 2014 2017
7.14 - 10.3 +38.5% 7.18 - 10.5 +19.2%
Roadwalks 30.4 42.1 Trailhead North 334.1 398.2
2019 2020 Barker Pass 2008 2016 2020
Mt Rose Center 6.20 - 10.3 +71.8% 7.29 - 10.5 +12.5%
19.6 26.0 North 41.9 41.7 47.1
2019 2020
Mt Rose East 6.20 - 10.3 +198.5%
25.3 39.2
Galena Falls/Mt 2007 2016 2018 2019
6.24 - 9.30 +114.4%
Rose North 204.2 367.0 410.9 437.8
Tahoe 2008 2009 2014 2016
6.30 - 10.10 +18.3%
Meadows South 145.7 135.8 159.1 172.3
2008 2014 2016 2018 2019
Spooner North 9.1 - 9.30 +67.8%
30.1 40.8 48.1 48.2 50.5
2008 2014 2016 2017 2018 2019
Spooner South 7.16 - 10.8 +37.6%
47.6 75.0 86.5 57.1 62.7 65.5
Kingsbury 2014 2016 2020
7.19 - 10.21 +255.5%
North 31.7 102.2 112.61
Lower 2014 2015 2017
Van Sickle 7.21 - 8.1 +101.9%
222.6 332.3 449.5
Connector
Stagecoach 2016 2017
7.19 - 10.20 +31.7%
South 48.9 64.4
Mott Canyon 2014 2015 2016 2018
8.30 - 9.30 +17.8%
South 24.2 28.4 22.6 28.5
Grass Lake 2014 2016
7.21 - 9.25 +3.6% Sunset in Desolation Wilderness.
Spur North 36.3 37.6
17 18TRAIL USE TRENDS MOUNT ROSE
WILDERNESS
2016-2020
3) Sayles Canyon junction to Echo Summit trailhead, and MAP 4
4) Barker Pass to the northern PCT/TRT junction.
The identified areas of Stagnant Use comprise 6.2 miles or 3.1% of the trail system and are:
1) Watson Trail junction to Brockway Summit trailhead.
TAHOE
No areas of decreased use have been identified. The remaining areas of the trail are designated NATIONAL
as Unknown Use since there is no reliable IR counter data on trends there. Current data FOREST
on use trends can only be extrapolated for 57.5 miles, or approximately 28.6% of the TRT
system.
One of the most pressing questions in 2020 relates to perceived use increases as a result
of the COVID-19 pandemic. Did use go up more than would be normally predicted in 2020?
There are only three sites that collected data in the same locations in both 2019 and 2020.
GRANITE
The average increase in use between the two seasons at those sites is 92.3%. Since we have CHIEF
such a small sample size this number should not be inferred to be indicative that use nearly WILDERNESS
doubled on the trail from 2019 to 2020. However, it is a clear indication that use increased
CALIFORNIA
NEVADA
dramatically, at least in some areas.
Overall User Numbers
The IR counters produced 64,952 total trips during the three month high season of 2020. This
number multiplied by 0.7 (to convert trips to users), multiplied by 100/15.0 (to extrapolate
over the entire system) and multiplied by 1/0.7 (to extrapolate for the entire year) produces ELDORADO
a total of 433,013 estimated users on the TRT system in 2020. Previous reports put the NATIONAL
FOREST
estimates for total users in 2016, 2017, 2018, and 2019 at 404,679, 634,555, 478,086, and
509,884 respectively. The estimate that the TRT System sees about 400,000 users annually
was made in 2016. That estimate appeared low in light of 2017 numbers that suggested
500,000 may be a more accurate number. However, 2018 data supported a figure closer LEGENDDESOLATION
WILDERNESS
to 440,000, which was on pace with an approximate 5.5% annual growth in annual user National Forest
numbers. On that trend, the 2019 estimate of about 480,000 users was on track. For 2020,
the counters that did not fail were largely placed in locations that see much less traffic Designated
than most of the trail. This was primarily because the busiest parts of the trail have already Wilderness
had counters on them for one or more years and data was needed to expand the known Lake Tahoe
use levels to less popular sections. Additionally, both the pandemic and the forest closures NV State Park LAKE TAHOE
BASIN HUMBOLDT-
contributed to non-standard use patterns that do not occur in normal years. Therefore this MANAGEMENT TOIYABE
Large Increase NATIONAL
year’s data is skewing lower than one would expect to see, a factor that is not outweighed UNIT
FOREST
by the reduced percentage of trail that was covered by counters. Moderate Increase
These numbers should be viewed in the context of visitation to the region as a whole. In 2016
the Lake Tahoe Basin Management Unit reported over 5.7 million annual visits (this number Small Increase
will be revised following surveys in 2020) and many of those visitors choose to walk, hike, or
Stagnant Use
bike on the unit’s 300 miles of non-motorized trails. Since the TRT system makes up more
¸
than half of the non-motorized trail miles on the Unit, it is not unreasonable to expect about Decreased Use
half a million visitors to that system annually.
Unknown Use
19
0 3 6
Miles
20BICYCLE COUNTERS the Meiss 2020 counter malfunctioned or that bike trespass is up more than 170% on the
southern segment. It seems most likely that the former is the case.
ANALYSIS TECHNIQUES
03 In order to answer the question “How many mountain bikes are trespassing
on the PCT/TRT between Benwood Meadow and Meiss Meadow, and near
Barker Pass?” MB counters were placed between the southern PCT/TRT
TABLE 4: Average Daily Trips for MB counters on the PCT in comparable locations. Note
that ADT for each counter reflects only the period of time indicated.
junction and Schneiders Cow Camp Trail, between Showers Lake and Little Time
Round Top Trail, between Sayles Canyon Trail and Bryan Meadow Trail, and between Bryan Number of
Counter Name Period ADT
Meadow Trail and the Benwood Meadow Residential Spur. Incursions
Analyzed
The counters near Barker Pass did not collect usable data. The Barker North MB counter Meiss (2020) 311 7.6 - 10.4 3.4
reported an ADT of nearly 43, which is only slightly lower than the ADT of the IR counter in
the same location. Similarly, the Barker South MB counter reported an ADT of nearly 18. It Showers Lake
115 7.6 - 10.4 1.3
is clear that these numbers are not accurate - there are not that many bikes riding on this South (2017)
portion of the PCT/TRT. Bryan Mdw
121 7.6 - 10.4 1.3
North (2020)
The counters farther south fared marginally better, though the Sayles North MB counter was Echo Summit
103 7.6 - 10.4 1.1
not recovered. South (2017)
In order to answer the question regarding trends in mountain bike trespass between Benwood
Meadow and Meiss Meadow, data from multiple years was compared.
MB COUNTER RESULTS
The Meiss MB counter reported an ADT of 3.3 with a maximum single day count of 15, which
seems at least double what it should be when compared to other bike counter data from
previous years and from nearby locations. For the same time period as the Meiss MB counter,
the Showers North MB counter reported an ADT of only 0.3. This seems too low, but could
be accurate and may simply reflect that this counter was the farthest from any parking area
of the MB counters this year. The Bryan North MB counter reported an ADT of 1.2 when the
first two days of data are discarded (the unit registered 37 and 6,399 hits those days). The
maximum daily high was 5. This seems like the most reliable data from the MB counters this
year.
Despite a consistent effort, there are only three locations on the PCT/TRT that have usable
bike use data for multiple years: between the southern PCT/TRT junction and Schneiders
Cow Camp Trail (Meiss 2020 and Showers Lake South 2017), and between Bryan Meadow
Trail and the Benwood Meadow Residential spur (Bryan Meadow North 2020 and Echo
Summit South 2017). Data on the overall and average number of mountain bike incursions
collected on the PCT at those two locations in 2020 and 2017 is summarized in Table 4. The
time period analyzed is that in which data for all four counters was collected, though in two Sunset from the trail near Kinsgsbury.
different years.
The data suggest that bike trespass is up about 6% on the southern segment and that either
21 22NEXT STEPS
LESSONS LEARNED
04 The lessons learned from the Trail Counter Program in 2020 can help to
inform the evolution of the program as it moves forward. The lessons learned
this year are as follows:
1) Counters need to be deployed over both popular and less popular trail sections to
give the data needed for an accurate count of overall use numbers.
2) Reliability of MB counters remains suspect, as we continue to see a large number of
correctly installed counters malfunction over multiple years.
3) Counters should only be installed by a select few people who have been properly
trained and have a good history of success. While it is likely not possible to see 100%
success in any given year, there have been numerous counter failures in recent years
Climbing up Dicks Pass.
that seem preventable.
RECOMMENDATIONS FOR 2021 & BEYOND
In order to continue the development of a robust Trail Counter Program both specific
recommendations for 2021 and general goals for the years beyond are outlined in this section.
Based on the results of this report, the specific recommendations for 2021 are as follows
(note that some counters will collect data that can be useful for multiple purposes but are
only listed once in following recommendations):
IR counters are already installed in the following locations and should remain through the
2020 season:
1) Showers North, and
2) Sayles South.
IR counters should be installed in the following locations to expand knowledge on use levels
in where insufficient benchmark data has been collected thus far:
3) Interpretive Loop (East Side),
4) Marlette Loop (West Side) South of Tunnel Creek Road,
Brockway to Mt Rose.
5) South of Kingsbury Grade,
6) Lower K to K Trail,
7) South of Monument Pass,
8) North of Star Lake, and
9) Echo Summit Reroute.
23 24IR counters should be installed in the following locations to develop trend data:
10) East of Watson Lake,
11) West of Brockway Summit,
12) East of Brockway Summit,
13) East of the Picnic Rock Vista trail,
14) Mt Rose Waterfall Trail,
15) South of Tunnel Creek Road
16) Spooner North,
17) Spooner South,
18) Van Sickle Waterfall Trail,
19) Star Lake South,
20) Grass Lake Spur,
21) Scotts Lake Trail,
22) West of Echo Lake trailhead,
23) South of Barker Pass, and
24) North of Barker Pass.
MB counters should be installed in areas where bicycle use is restricted on the
PCT including:
1) Between Meiss Meadows and Showers Lake,
2) Between Showers Lake and the Sayles Canyon trail junction,
3) Between the Sayles Canyon and Bryan Meadow trail junctions,
4) Between Bryan Meadow and Benwood Meadow Residential spur trail junctions,
5) South of Barker Pass, and
6) North of Barker Pass.
This plan does not require the purchase of additional IR or MB counters.
The general goals for the trail counter program for 2021 and beyond are:
1) Finalize counter locations for the 2021 season prior to the close of the April Trail
Operations Committee meeting,
2) Leave several IR counters in place throughout the winter to evaluate offseason trail
use, placing them so as to avoid being covered by snow,
3) Continue to evaluate the possibility of installing permanent counters in locations
where data collection will be consistently valuable,
4) Though currently prohibitively expensive, monitor the cost of counters that allow
for remote access to data,
5) Reduce the amount of the trail that does not have use data to less than 25%, and
6) Utilize the trail use and trend data to leverage additional funding, resources and
improvements to the TRT system,
25You can also read