Updated Demographic Projections for Sussex Coast HMA Authorities
←
→
Page content transcription
If your browser does not render page correctly, please read the page content below
Updated Demographic Projections
for Sussex Coast HMA Authorities

Adur, Arun, Brighton & Hove, Chichester, Lewes and Worthing
Councils

Final Report: August 2013

Prepared by

GL Hearn Limited
20 Soho Square
London W1D 3QW

T +44 (0)20 7851 4900
F +44 (0)20 7851 4910
glhearn.com
Adur, Arun, Brighton & Hove, Chichester, Lewes and Worthing Councils – Demographic Projections – August 2013

GL Hearn                                                                                                       Page 2 of 71
Adur, Arun, Brighton & Hove, Chichester, Lewes and Worthing Councils – Demographic Projections – August 2013

Contents

Section                                                                                                        Page

1          INTRODUCTION                                                                                           9

2          PROJECTION METHODOLOGY                                                                                11

3          PROJECTION OUTPUTS FOR SUSSEX COAST HMA                                                               29

4          SUMMARY OF PROJECTIONS BY LOCAL AUTHORITY                                                             37

5          COMPARING PROJECTIONS WITH THOSE IN THE 2012 SHMA                                                     45

6          PROJECTIONS FOR THE SOUTH DOWNS NATIONAL PARK                                                         47

7          IMPLICATION OF DIFFERENT BASELINE POPULATION STRUCTURES                                               51

8          HEADSHIP RATE SENSITIVITY                                                                             55

9          CONCLUSIONS                                                                                           57

APPENDIX 1: ADJUSTED MIGRATION PROFILES                                                                          59

APPENDIX 2: DETAILED MIGRATION PROFILES                                                                          69

List of Figures

                  OVERVIEW OF METHODOLOGY                                                                        11

                  SUITE OF PROJECTIONS RUN                                                                       12

                  PROJ 1 (SNPP) NET MIGRATION ASSUMPTIONS 2011/12 TO 2030/31                                     14

                  PROJ 2 (SNPP UPDATED) NET MIGRATION ASSUMPTIONS 2011/12 TO 2030/3115

                  PAST TRENDS IN NET IN-MIGRATION                                                                16

                  PHASING OF ASSUMPTIONS FOR EMPLOYMENT GROWTH (2011-2031)                                       18

                  PHASING OF ASSUMPTIONS FOR EMPLOYMENT GROWTH (2011-2031) – PROJ C
           19

                  POPULATION OF STUDY AREA – 2011                                                                20

                  COMPARISON OF POPULATION PROFILE IN DIFFERENT LOCAL AUTHORITIES
(2011)     21

                  POPULATION AGE PROFILE (2011)                                                                  22

                  FERTILITY AND MORTALITY ASSUMPTIONS (KEY PERIODS)                                              23

GL Hearn                                                                                                       Page 3 of 71
Adur, Arun, Brighton & Hove, Chichester, Lewes and Worthing Councils – Demographic Projections – August 2013
ESTIMATED ANNUAL LEVEL OF NET MIGRATION BY FIVE-YEAR AGE BAND (2011-
2031) 24
PROPORTION OF POPULATION WORKING 25
UNEMPLOYMENT RATE 25
PROJECTED CHANGES IN EMPLOYMENT RATES 26
PAST AND PROJECTED TRENDS IN AVERAGE HOUSEHOLD SIZE 28
DESCRIPTION OF PROJECTIONS USED FOR DEMOGRAPHIC MODELLING 29
POPULATION ESTIMATES 2011 TO 2031 30
POPULATION CHANGE, 2011 – 2031 30
DISTRIBUTION OF POPULATION 2011 AND 2031 (PROJ 2 – UPDATED SNPP) 31
POPULATION CHANGE 2011 TO 2031 BY FIFTEEN YEAR AGE BANDS 32
FORECAST POPULATION CHANGE BY AGE GROUP 2011 – 2031 32
EMPLOYMENT ESTIMATES 2011 TO 2031 33
EMPLOYMENT CHANGE, 2011 – 2031 34
HOUSEHOLD ESTIMATES 2011 TO 2031 35
HOUSEHOLD CHANGE, 2011 – 2031 35
ESTIMATED HOUSING NUMBERS WITH 3% VACANCY ALLOWANCE (TO 2031)36
SUMMARY OF PROJECTIONS 2011 TO 2031 – ANNUAL – SUB-REGION 37
SUMMARY OF PROJECTIONS 2011 TO 2031 – TOTAL – SUB-REGION 37
HOUSING REQUIREMENTS BY SCENARIO (PER ANNUM) 38
SUMMARY OF PROJECTIONS 2011 TO 2031 – ANNUAL – ADUR 39
SUMMARY OF PROJECTIONS 2011 TO 2031 – TOTAL – ADUR 39
SUMMARY OF PROJECTIONS 2011 TO 2031 – ANNUAL – ARUN 40
SUMMARY OF PROJECTIONS 2011 TO 2031 – TOTAL – ARUN 40
SUMMARY OF PROJECTIONS 2011 TO 2031 – ANNUAL – BRIGHTON & HOVE 41
SUMMARY OF PROJECTIONS 2011 TO 2031 – TOTAL – BRIGHTON & HOVE 41
SUMMARY OF PROJECTIONS 2011 TO 2031 – ANNUAL – CHICHESTER 42
SUMMARY OF PROJECTIONS 2011 TO 2031 – TOTAL – CHICHESTER 42
GL Hearn Page 4 of 71Adur, Arun, Brighton & Hove, Chichester, Lewes and Worthing Councils – Demographic Projections – August 2013
SUMMARY OF PROJECTIONS 2011 TO 2031 – ANNUAL – LEWES 43
SUMMARY OF PROJECTIONS 2011 TO 2031 – TOTAL – LEWES 43
SUMMARY OF PROJECTIONS 2011 TO 2031 – ANNUAL – WORTHING 44
SUMMARY OF PROJECTIONS 2011 TO 2031 – TOTAL – WORTHING 44
COMPARABLE PROJECTIONS IN 2012 SHMA AND 2013 UPDATE REPORT 45
COMPARISON OF DEMOGRAPHIC PROJECTIONS (2012 AND 2013) – HOUSING
REQUIREMENTS PER ANNUM 45
COMPARISON OF ECONOMIC PROJECTIONS (2012 AND 2013) – HOUSING
REQUIREMENTS PER ANNUM 46
COMPARISON OF POPULATION PROFILE IN NATIONAL PARK AND THE REST OF
THE STUDY AREA 47
SUMMARY OF PROJ 2 (SNPP UPDATED) 2011 TO 2031 – ANNUAL 48
SUMMARY OF PROJ 2 (SNPP UPDATED) 2011 TO 2031 – TOTAL 49
DIFFERENCE IN BASELINE POPULATION AGE STRUCTURE (2011) 51
FORECAST POPULATION CHANGE BY AGE GROUP 2011 – 2031 52
HOUSING REQUIREMENTS WITH DIFFERENT HEADSHIP RATE ASSUMPTIONS (PER
ANNUM 55
MIGRATION FIGURES BY COMPONENT FOR 2011/12 USED IN PROJ 2 (SNPP
UPDATED) 61
PAST MIGRATION TRENDS (AS RECORDED BY ONS) AND PROJECTED FIGURES IN
THE 2011-BASED SNPP 62
PAST MIGRATION TRENDS (AMENDED ON BASIS OF MID-YEAR POPULATION DATA)
AND PROJECTED FIGURES IN PROJ 2 (SNPP UPDATED) 62
PAST MIGRATION TRENDS (AS RECORDED BY ONS) AND PROJECTED FIGURES IN
THE 2011-BASED SNPP 63
PAST MIGRATION TRENDS (AMENDED ON BASIS OF MID-YEAR POPULATION DATA)
AND PROJECTED FIGURES IN PROJ 2 (SNPP UPDATED) 63
PAST MIGRATION TRENDS (AS RECORDED BY ONS) AND PROJECTED FIGURES IN
THE 2011-BASED SNPP 64
PAST MIGRATION TRENDS (AMENDED ON BASIS OF MID-YEAR POPULATION DATA)
AND PROJECTED FIGURES IN PROJ 2 (SNPP UPDATED) 64
PAST MIGRATION TRENDS (AS RECORDED BY ONS) AND PROJECTED FIGURES IN
THE 2011-BASED SNPP 65
GL Hearn Page 5 of 71Adur, Arun, Brighton & Hove, Chichester, Lewes and Worthing Councils – Demographic Projections – August 2013
PAST MIGRATION TRENDS (AMENDED ON BASIS OF MID-YEAR POPULATION DATA)
AND PROJECTED FIGURES IN PROJ 2 (SNPP UPDATED) 65
PAST MIGRATION TRENDS (AS RECORDED BY ONS) AND PROJECTED FIGURES IN
THE 2011-BASED SNPP 66
PAST MIGRATION TRENDS (AMENDED ON BASIS OF MID-YEAR POPULATION DATA)
AND PROJECTED FIGURES IN PROJ 2 (SNPP UPDATED) 66
PAST MIGRATION TRENDS (AS RECORDED BY ONS) AND PROJECTED FIGURES IN
THE 2011-BASED SNPP 67
PAST MIGRATION TRENDS (AMENDED ON BASIS OF MID-YEAR POPULATION DATA)
AND PROJECTED FIGURES IN PROJ 2 (SNPP UPDATED) 67
ESTIMATED ANNUAL LEVEL OF MIGRATION BY FIVE-YEAR AGE BAND (2011-2031) –
ADUR 69
ESTIMATED ANNUAL LEVEL OF MIGRATION BY FIVE-YEAR AGE BAND (2011-2031) –
ARUN 69
ESTIMATED ANNUAL LEVEL OF MIGRATION BY FIVE-YEAR AGE BAND (2011-2031) –
BRIGHTON & HOVE 70
ESTIMATED ANNUAL LEVEL OF MIGRATION BY FIVE-YEAR AGE BAND (2011-2031) –
CHICHESTER 70
ESTIMATED ANNUAL LEVEL OF MIGRATION BY FIVE-YEAR AGE BAND (2011-2031) –
LEWES 71
ESTIMATED ANNUAL LEVEL OF MIGRATION BY FIVE-YEAR AGE BAND (2011-2031) –
WORTHING 71
GL Hearn Page 6 of 71Adur, Arun, Brighton & Hove, Chichester, Lewes and Worthing Councils – Demographic Projections – August 2013
Quality Standards Control
The signatories below verify that this document has been prepared in accordance with our quality control
requirements. These procedures do not affect the content and views expressed by the originator.
This document must only be treated as a draft unless it is has been signed by the Originators and approved
by a Business or Associate Director.
DATE ORIGINATORS APPROVED
August 2013 Justin Gardner Nick Ireland
Director, JGC Planning Director
Limitations
This document has been prepared for the stated objective and should not be used for any other purpose
without the prior written authority of GL Hearn; we accept no responsibility or liability for the consequences of
this document being used for a purpose other than for which it was commissioned.
GL Hearn Page 7 of 71Adur, Arun, Brighton & Hove, Chichester, Lewes and Worthing Councils – Demographic Projections – August 2013 GL Hearn Page 8 of 71
Adur, Arun, Brighton & Hove, Chichester, Lewes and Worthing Councils – Demographic Projections – August 2013

1          INTRODUCTION

1.1        This report provides a revised set of demographic projections for the local authorities within the
           Sussex Coast HMA. These are:

           • Adur District
           • Arun District
           • Brighton and Hove City
           • Chichester District
           • Lewes District
           • Worthing District

1.2        The projections update those set out within the Coastal West Sussex Strategic Housing Market
           Assessment Update and provide a consistent set of projections for strategic planning purposes.

1.3        The projection approach is broadly consistent with the SHMA Update. However the projections have
           been updated to take account of:

           • 2011 Census
           • 2011-based Interim Sub-National Population Projections
           • Revised Mid-Year Population Estimates and Components of Change for the 2002-11 period.

           Report Structure
1.4        The remainder of this report is structured as follows:

           • Section 2: Projections Methodology;
           • Section 3: Projection Outputs;
           • Section 4: Backlog of Housing Provision;
           • Section 5: Conclusions.

GL Hearn                                                                                                       Page 9 of 71
Adur, Arun, Brighton & Hove, Chichester, Lewes and Worthing Councils – Demographic Projections – August 2013 GL Hearn Page 10 of 71
Adur, Arun, Brighton & Hove, Chichester, Lewes and Worthing Councils – Demographic Projections – August 2013

2          PROJECTION METHODOLOGY

           Introduction
2.1        In this section we set out demographic projections methodology. The core projections prepared within
           this report cover the period from 2011-31. We also consider in Section 4 whether there is a backlog
           of housing need which needs to be included in calculating future housing requirements. 2011 is used
           as the start-date for the projections as there is a comprehensive suite of data available regarding the
           base population and past trends to this point, which takes account of data from the 2011 Census.

2.2        The methodology used to determine population growth and hence housing requirements is based on
           fairly standard population projection methodology consistent with the methodology used by ONS and
           CLG in their population and household projections. Essentially the method establishes the current
           population and how will this change in the period from 2011 to 2031. This requires us to work out how
           likely it is that women will give birth (the fertility rate); how likely it is that people will die (the death
           rate) and how likely it is that people will move into or out of each District. These are the principal
           components of population change and are used to construct our population projections. Figure 1
           shows the key stages of the projection analysis through to the assessment of housing requirements.

                        Overview of Methodology

GL Hearn                                                                                                       Page 11 of 71
Adur, Arun, Brighton & Hove, Chichester, Lewes and Worthing Councils – Demographic Projections – August 2013
2.3 Much of the data for our projections draws on ONS information contained within the 2010- and 2011-
based Subnational Population Projections (SNPP) and the 2011-based CLG Household Projections.
In particular we have used the SNPP to look at fertility rates, mortality rates and the profile of in- and
out-migrants (by age and sex).
Projections Run
2.4 As part of this assessment we have run nine projections to assess how the population and labour
supply/employment might change under different assumptions. The projections can broadly be split
into three categories a) demographic (PROJ 1 to 4), b) economic-led (PROJ A and B) and c)
component (PROJ Y and Z). The nine projections run are listed below with a brief description of each
following – all projections cover the period from 2011 to 2031:
Suite of Projections Run
Type of Projections Projections Run
• PROJ 1 (Linked to 2010- and 2011-based SNPP)
• PROJ 2 (SNPP adjusted)
Demographic-Driven
• PROJ 2 (10-year migration trends)
• PROJ 3 (5-year migration trends)
• PROJ A (Labour supply)
Economic-Driven • PROJ B (Labour demand)
• PROJ C (Experian (updated))
• PROJ Y (Zero Net Migration)
Component Projections
• PROJ Z (Zero Employment Growth)
2.5 In considering future demographic trends and housing requirements, the starting point is the latest
subnational projections (SNPP) (PROJ 1). Due to new information being available since the SNPP
was published differences in inputs can be identified (PROJ 2). The housing requirements arising
from the demographic projections are particularly sensitive to assumptions around migration. PROJ
3 and PROJ 4 consider alternative scenarios for migration, based on trends over the last 5 and 10
years.
2.6 The NPPF emphasises the alignment of housing and economic strategies in local plans. Projections
A and B consider scenarios for employment growth and the potential level of housing which might be
required to support this. Employment growth at a district-level is difficult to forecast accurately and
both this, and the implications of employment growth on demography and the housing market, will be
sensitive to a range of factors. These are discussed later in the report.
GL Hearn Page 12 of 71Adur, Arun, Brighton & Hove, Chichester, Lewes and Worthing Councils – Demographic Projections – August 2013
2.7 The ‘component’ projections are developed to aid understanding of demographic dynamics but do
not represent an assessment of ‘demand’ for homes per se.
PROJ 1 (linked to ONS 2010- and 2011-based SNPP)
PROJ 2 (SNPP Updated)
2.8 Our first two projections use information in the ONS 2010- and 2011-based Sub-National Population
Projections (SNPP). The last full set of SNPP published by ONS were 2010-based figures. These
have subsequently been updated by 2011-based ‘interim’ projections which look at the ten year period
to 2021. These interim projections use the same assumptions around fertility, mortality and migration
profiles as 2010-based figures. However the 2011-based figures have updated estimates of future
levels of migration (both in- and out-migration and by type of migration e.g. international vs. internal).
2.9 Our projections therefore use the same assumptions as in the ONS 2010-based SNPP with regards
to fertility, mortality and migration rates but with some adjustments to overall levels of migration on
the basis of the 2011-based figures. The assumptions around fertility, mortality and migration rates
from the 2010-based SNPP are also used in all other projections within this report.
2.10 PROJ 1 models the exact assumptions in the most recent (2011-based) SNPP and the 2011-based
CLG household projections. Because these projections only run to 2021 assumptions have been
made for the period 2021-31. The key assumptions are that the 2010-based SNPP are relevant
(suitably rebased to be consistent with the 2011-based figures) and that headship rates will continue
on the trend showing by CLG for the period 2011-21. This projection can be seen as setting up an
initial baseline position prior to interrogation of the background data feeding into this analysis (mainly
around migration).
2.11 When comparing the migration trends that were used to construct the 2010- and 2011- based SNPP
with trends now shown in the April 2013 release of mid-year population estimtes is became apparent
that ONS had either under or over-recorded past migration when compared with that which was
subsequently shown to have happened (based on an understaning of inter-censal population change
and levels of natural change (births minus deaths)).
2.12 Past estimtes of migration had typically under-estimted net migration to Brighton & Hove (and to a
lesser extent Worthing) with over-estimtations being seen in the other four areas.
GL Hearn Page 13 of 71Adur, Arun, Brighton & Hove, Chichester, Lewes and Worthing Councils – Demographic Projections – August 2013
2.13 As a result of having access to the detailed ONS revised mid-year population estimtes we have
sought to remodel migration on the basis of more up-to-date information. This is discussed in detail
in Appendix 1 of this document. Essentially we have revised the start point of the SNPP prpojections
(2011/12) top be more in line with trends observed over the previous 5-years. This also takes account
of any apparent under- or over-estimtion of net migration in this period. From this data we have
therefore developed a second projection (PROJ 2) which uses the core assumptons in the 2011-
based SNPP (e.g. about how migration patterns might change in the future) but from a slightly
different position in 2011/12.
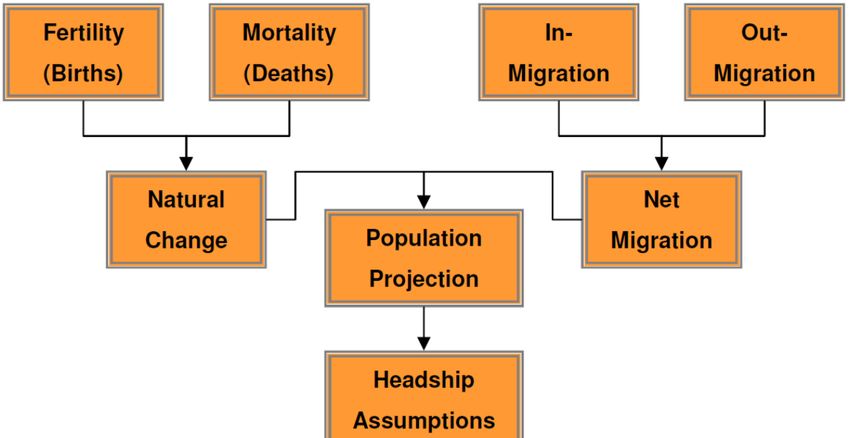
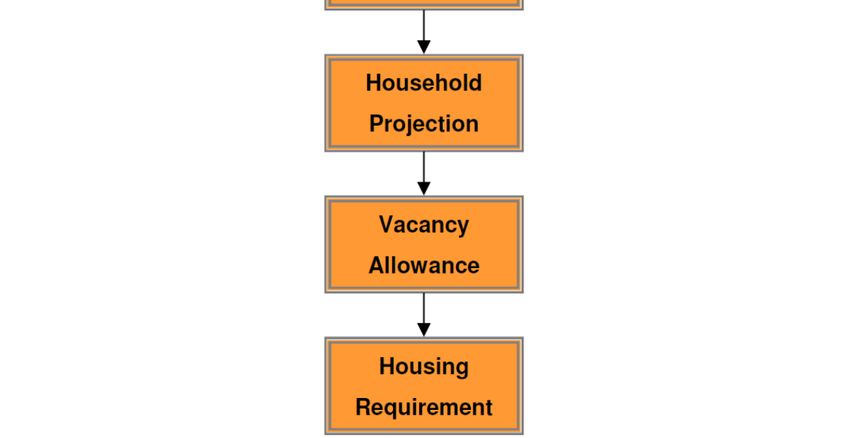
2.14 The figures below show the levels of net migration assumed by our projections linked to the SNPP
from 2011/12 to 2030/31. In most areas the level of net migration is expected to rise slightly over time
with the exception being in Brighton & Hove where year-on-year figures can be more variable. When
comparing the two charts (for PROJ 1 and PROJ 2) the most notable difference is in the case of
Brighton & Hove which shows a much higher assumed level of net migration throughout the period.
This difference is due to the new mid-year population estimates suggesting that net migration had
been under-recorded by around 1,200 people per annum over the past five years.
2.15 Taking the period studied as a whole the projections suggest an average net in migration of between
about 6,500 (PROJ 1 – SNPP) and 6,800 (PROJ 2 – SNPP updated). The key difference between
these two projections is that PROJ 2 takes account of Census data about population change from
2001 to 2011 whilst PROJ 1 is based on ONS information before a rebasing of data had taken place.
PROJ 1 (SNPP) net migration assumptions 2011/12 to 2030/31
3,000
2,500
2,000
Net migration
1,500
1,000
500
0
-500
Year
Adur Arun Brighton & Hove Chichester Lewes Worthing
Source: Derived from ONS mid-year population estimates and 2011-based SNPP
GL Hearn Page 14 of 71Adur, Arun, Brighton & Hove, Chichester, Lewes and Worthing Councils – Demographic Projections – August 2013
PROJ 2 (SNPP updated) net migration assumptions 2011/12 to 2030/31
3,000
2,500
2,000
Net migration
1,500
1,000
500
0
Year
Adur Arun Brighton & Hove Chichester Lewes Worthing
Source: Derived from ONS mid-year population estimates and 2011-based SNPP
PROJ 3 (10-year migration trends)
PROJ 4 (5-year migration trends)
2.16 Our second two projections look at recorded trends in migration over the past ten (and five) years.
These projections are comparable with PROJ 1 and PROJ 2 in the Coastal West Sussex SHMA of
2012. The figure below shows estimated net migration into each District from 2001/2 to 2010/11. The
figures have been taken from ONS Mid-Year Population Estimates taking into account the 2011
Census. The figures used are for the ‘migration and other changes’ category in the ONS data which
reflects an adjustment for over or under-estimates of net migration levels over the past decade.
2.17 The data shows that the figures for the sub-region are quite consistent over time with net migration
ranging from between about 4,800 and 7,900 in any year. Sub-regionally, the trend is in a slightly
upwards direction with the average level of net migration over the past five years being about 1,000
higher than in the period from 2001 to 2006. At a more local level however there is considerable
variation in the data. Brighton & Hove in particular goes from having small levels of net out-migration
from 2001 to 2004 to notable levels of net in-migration from 2004/5 onwards. Arun on the other hand
has seen levels of net migration drop quite notably from in excess of 2,000 per annum at the start of
the decade down to more like 1,000 over the past few years. Other areas tend to show less variation
when comparing the past five years with the five years prior to that.
2.18 In developing our two projections we have simply taken an overall average and projected this forward
– over the last ten years (2001-11) the average level of net migration has been an in-migration of
6,371 people with a higher figure (of 6,865) if we look at 5-year trends (2006-11).
GL Hearn Page 15 of 71Adur, Arun, Brighton & Hove, Chichester, Lewes and Worthing Councils – Demographic Projections – August 2013
2.19 For the purposes of the projections we have assumed a constant level of net migration throughout
the period. Given variability in the migration data it seems reasonable to assume a constant level for
the purposes of projection modelling. We would however note some caution with respect to constant
migration in Brighton & Hove given that the SNPP does suggest quite some variation over time which
will largely be linked to the population age structure of the City which is quite different to other parts
of the study area.
2.20 It is also noteworthy in other parts of the study-area that the SNPP is expecting to see an increase in
net migration moving forward to 2031. There is some logic to this given that as populations age there
will be more older people – such people are typically less migrant and will therefore have a downward
impact on out-migration. At the same time, growing populations elsewhere (and where ageing is less
pronounced) will potentially drive an increase in in-migration. Hence, a growing level of net migration
in areas other than Brighton & Hove (as generally seen in the SNPP) can be considered as realistic
and therefore some caution should be applied when considering the outputs of a constant migration
forecast.
2.21 Regardless of the period used the figures are broadly similar to the overall average contained within
the 2011-based SNPP and our revised SNPP position (which as seen above are 6,500 and 6,800 per
annum respectively).
Past trends in Net In-Migration
Year Adur Arun Brighto Chich- Lewes Worthin Sub-
n& ester g region
Hove
2001/2 511 2,437 -305 1,041 911 1,172 5,767
2002/3 87 2,093 -21 927 635 1,059 4,780
2003/4 154 2,541 -371 1,091 818 1,124 5,357
2004/5 -2 1,654 2,430 964 265 1,056 6,367
2005/6 679 1,669 2,074 1,214 569 893 7,098
2006/7 318 1,693 1,778 1,289 793 1,126 6,997
2007/8 285 1,322 2,862 1,499 855 1,055 7,878
2008/9 342 1,009 2,598 911 783 632 6,275
2009/10 184 1,253 2,681 1,172 1,018 1,065 7,373
2010/11 91 845 2,222 763 648 1,237 5,806
Average (last ten years) 265 1,652 1,595 1,087 730 1,042 6,371
Average (last five years) 244 1,224 2,428 1,127 819 1,023 6,865
Source: ONS
GL Hearn Page 16 of 71Adur, Arun, Brighton & Hove, Chichester, Lewes and Worthing Councils – Demographic Projections – August 2013
PROJ A (Labour supply)
PROJ B (Labour demand)
PROJ C (Experian Updated)
2.22 To inform the assessment of future housing need and demand within the SHMA Update, GL Hearn
commissioned econometric forecasts from Experian. The forecasts overlay the economic structure
and past performance of local economies with Experian’s macro-economic forecasts as at March
2012.
2.23 Clearly there are a range of factors which could influence future economic performance and this
affects the level of uncertainty associated with any long-term forecasting. Recent economic
performance and events in the Eurozone heighten this uncertainty and thus the error margin
associated with econometric forecasts. It should also be borne in mind that the Experian economic
forecasts do not take into account ‘economic strategy’ initiatives or key development projects which
may influence future performance (in so far as their impact differs from previous initiatives or projects).
The forecasts do however provide an up-to-date view regarding economic performance which takes
account of Government’s current spending plans, recent macro-economic performance and potential.
2.24 The economic forecasts adopted are consistent with those in the SHMA. The Experian forecasts have
been used to devise projections for labour supply taking account of existing commuting patterns
(based on 2001 Census travel to work matrices between local authority areas). The projections thus
take account of job growth not just in the functional Housing Market but wider areas to which there is
a notable degree of commuting, including South Hampshire and London. This takes account of
employment growth across the region and in London with a consistent % of people working in each
local authority living in the Sussex Coast HMA local authorities as was the case in 2001.
2.25 Economic forecasts for areas outside of Coastal West Sussex (including Brighton and Hove and
Lewes) are 2010 forecasts for other authorities in the South East prepared by Cambridge
Econometrics for SEEDA and GLA 2011 forecasts for London. These however have a relatively
moderate impact on labour supply forecasts in Coastal West Sussex.
GL Hearn Page 17 of 71Adur, Arun, Brighton & Hove, Chichester, Lewes and Worthing Councils – Demographic Projections – August 2013
2.26 Assumptions regarding growth in employment in PROJ A and PROJ B are set out below. PROJ B is
comparable with PROJ 5 of the earlier Coastal West Sussex SHMA (2012). This projection is based
on modelling employment growth on a 1:1 basis with changes in the resident population who are in
employment. PROJ A takes account of commuting patterns to work out the likely growth in the resident
workforce if commuting patterns remain the same. Hence in the case of Adur where there is a high
level of out-commuting the job growth is forecasts as 2,220 but if commuting patterns remain the same
then the number of residents in employment is likely to rise by a higher figure. The opposite of this is
seen in Chichester which has net in-commuting.
Phasing of assumptions for employment growth (2011-2031)
PROJ A – Labour supply PROJ B – Labour demand
Period
Annual 5-year total Annual 5-year total
2011-2016 2,491 12,457 2,251 11,254
2016-2021 3,415 17,075 3,233 16,163
2021-2026 2,648 13,241 2,329 11,643
2026-2031 2,722 13,612 2,306 11,531
Total 56,385 50,591
Adur 3,564 2,220
Arun 10,502 7,630
Brighton & Hove 17,785 16,440
Chichester 10,799 11,540
Lewes 7,373 6,791
Worthing 6,362 5,970
2.27 To bring the assessment as up-to date as possible an additional economic based scenario has been
run to consider potential housing requirements. This is based on a Spring 2013 Experian forecasts
(PROJ C). This is broadly similar to the above forecasts although a slightly different approach has
been taken in converting job growth into the likely growth in the number of residents in employment.
2.28 It is important to distinguish between the number of residents in employment (which is the output of
the projections in this report) and the number of jobs. The two will be slightly different due to a
number of people ‘double-jobbing’ and because of commuting patterns (i.e. not all new jobs in an
area will be filled by local residents whilst some residents in employment will work outside their local
authority area).
GL Hearn Page 18 of 71Adur, Arun, Brighton & Hove, Chichester, Lewes and Worthing Councils – Demographic Projections – August 2013
2.29 To convert the number of jobs into the likely change in the number of residents in employment the
analysis has looked at a simple comparison between the number of residents in employment in
2011 (as evidenced through the 2011 Census) and the number of jobs. Taking Adur for example
the 2011 Census suggested that there were 29,356 people working compared with an estimate of
21,465 jobs. The number of residents in employment is therefore around 1.37 times the number of
jobs. The job growth figures for modelling purposes have therefore been moderated by a factor of
1.37 with this figure being held constant for the whole period to 2031.
2.30 The table below therefore shows the job growth under this additional scenario and the estimated
change in the number of residents in employment. The data shows for the whole study area that the
forecast increase in residents in employment is very similar to the figure derived under PROJ A
(Labour supply) although the distribution between different areas is slightly different.
Phasing of assumptions for employment growth (2011-2031) – PROJ C
Jobs Residents in employment
Period
Annual 5-year total Annual 5-year total
2011-2016 3,295 16,473 3,413 17,065
2016-2021 2,980 14,898 3,142 15,712
2021-2026 2,285 11,423 2,373 11,867
2026-2031 2,190 10,950 2,274 11,372
Total 53,744 56,017
Adur 2,249 3,076
Arun 8,567 11,532
Brighton & Hove 20,255 20,301
Chichester 12,779 10,617
Lewes 3,184 3,824
Worthing 6,708 6,667
PROJ W (Zero Net Migration)
PROJ X (Zero Employment Growth)
2.31 The next two projections might be called ‘component’ projections and look at the impact on population,
employment and housing requirements of holding certain aspects of the projection constant over time.
The component projections aim to aid understanding of demographic dynamics rather than provide
an assessment of future housing needs per se. These projections are comparable with PROJ 3 and
PROJ 4 of the 2012 Coastal West Sussex SHMA.
GL Hearn Page 19 of 71Adur, Arun, Brighton & Hove, Chichester, Lewes and Worthing Councils – Demographic Projections – August 2013
2.32 The first projection looks at housing requirements if there were to be no net migration into the District
for the next 20-years. Whilst net migration is held at zero, this projection does allow for in- and out-
migration so there will be changes in the age structure due to migration trends as well as those
created by natural change (i.e. births minus deaths). In- and out-migration in this projection balance
one another out.
2.33 The second ‘component’ projection looks at what level of housing growth would be required to achieve
stable employment levels. Within this projection (and indeed all other projections) we have also
looked at the impact of the economic downturn on the number of people in employment and
considered the scope for some local residents to return to work if additional jobs were available. We
have also considered the likely impact of changes in pensionable age throughout the projection period
as and when these become relevant.
Baseline Population
2.34 The baseline for our projections is taken to be 2011 with the projection run for each year over the
period up to 2031. The estimated population profile as of 2011 has been taken from the 2011-based
SNPP. The overall population in 2011 was estimated to be 800,674 with slightly more females than
males.
Population of Study Area – 2011
Age group Male Female Ages 85+ 1.1% 2.3%
Ages 0-4 22,360 20,851 Ages 80-84 1.3% 1.8%
Ages 5-9 20,558 19,298 Ages 75-79 1.7% 2.1%
Ages 10-14 21,380 19,785 Ages 70-74 2.1% 2.4%
Ages 15-19 23,640 22,716 Ages 65-69 2.6% 2.8%
Ages 60-64 3.1% 3.3%
Ages 20-24 27,507 27,800
Ages 55-59 2.7% 2.9%
Ages 25-29 24,916 24,086
Ages 50-54 3.1% 3.2%
Ages 30-34 24,022 24,728
Ages 45-49 3.7% 3.8%
Ages 35-39 25,450 26,396 Ages 40-44 3.7% 3.7%
Ages 40-44 29,309 29,449 Ages 35-39 3.2% 3.3%
Ages 45-49 29,322 30,137 Ages 30-34 3.0% 3.1%
Ages 50-54 24,787 25,547 Ages 25-29 3.1% 3.0%
Ages 55-59 21,966 22,958 Ages 20-24 3.4% 3.5%
Ages 60-64 24,541 26,025 Ages 15-19 3.0% 2.8%
Ages 65-69 20,823 22,399 Ages 10-14 2.7% 2.5%
Ages 70-74 16,494 18,943 Ages 5-9 2.6% 2.4%
Ages 75-79 13,699 17,071 Ages 0-4 2.8% 2.6%
Ages 80-84 10,327 14,687 5% 4% 3% 2% 1% 0% 1% 2% 3% 4% 5%
Ages 85+ 8,640 18,057 Female Male
All Ages 389,741 410,933
Source: 2011-Mid Year Population Estimates
GL Hearn Page 20 of 71Adur, Arun, Brighton & Hove, Chichester, Lewes and Worthing Councils – Demographic Projections – August 2013
2.35 The table and figure below show the population distribution in each local authority area in broad 15-
year age categories. The data shows the highest population (of around 273,000) to be in Brighton &
Hove with the smallest population (of about 61,000 being in Adur). The population of the whole sub-
region in 2011 was around 800,000.
2.36 When looking at the population age structure the data shows a slightly older profile to both the regional
and national average. There are however some notable differences within different local authorities.
Brighton & Hove in particular has a young population with 40% of the population aged under 30
(compared with a sub-regional average of 34%). In contrast Arun and to a lesser extent Chichester
have much older populations. In Arun some 34% of the population is aged 60 or over compared with
sub-regional figure of 26% and just 18% in Brighton & Hove.
Comparison of population profile in different local authorities (2011)
Age Adur Arun Brighton Chich- Lewes Worthing Sub-
group & Hove ester region
Under 15 9,844 21,860 41,799 17,387 15,797 17,545 124,232
15-29 9,674 22,656 68,323 17,949 14,855 17,208 150,665
30-44 11,810 25,337 65,401 18,740 16,819 21,247 159,354
45-59 12,184 29,092 48,875 23,371 20,590 20,605 154,717
60-74 11,024 30,658 30,282 22,395 18,192 16,674 129,225
75+ 6,798 20,208 18,272 14,153 11,331 11,719 82,481
Total 61,334 149,811 272,952 113,995 97,584 104,998 800,674
Source: 2011-Mid-Year population estimates
GL Hearn Page 21 of 71Adur, Arun, Brighton & Hove, Chichester, Lewes and Worthing Councils – Demographic Projections – August 2013
Population Age Profile (2011)
Adur 16.0% 15.8% 19.3% 19.9% 18.0% 11.1%
Arun 14.6% 15.1% 16.9% 19.4% 20.5% 13.5%
Brighton & Hove 15.3% 25.0% 24.0% 17.9% 11.1% 6.7%
Chichester 15.3% 15.7% 16.4% 20.5% 19.6% 12.4%
Lewes 16.2% 15.2% 17.2% 21.1% 18.6% 11.6%
Worthing 16.7% 16.4% 20.2% 19.6% 15.9% 11.2%
Sub-region 15.5% 18.8% 19.9% 19.3% 16.1% 10.3%
South East 17.8% 18.5% 20.3% 19.9% 15.1% 8.4%
England 17.7% 19.9% 20.6% 19.4% 14.6% 7.8%
0% 10% 20% 30% 40% 50% 60% 70% 80% 90% 100%
Under 15 15-29 30-44 45-59 60-74 75 and over
Source: 2011-Mid-Year population estimates
Fertility and Mortality Rate Assumptions
2.37 For modelling of fertility we have used the rates contained within the ONS 2010-based population
projections – in all areas fertility rates are expected to increase very slightly in the short-term before
dropping quite notably moving towards the end of the projection period. We also interrogated the ONS
2010-based projections with regard to death rates which suggested that life expectancy is expected
to increase over time for both males and females.
2.38 The table below shows figures for the total fertility rate (the expected average number of live births per
woman throughout their childbearing lifespan) and life expectancy (e0) in each area for key dates at
the start and end of the projection period. The data suggests a lower fertility rate in Brighton & Hove
with all other areas being broadly similar. Life expectancy also shows some variation between areas
with Lewes in particular having higher life expectancy than other areas.
2.39 We have no evidence to suggest that either the fertility or mortality estimates used by ONS are
unreasonable and note that the expected figures and changes in the sub-region are consistent with
past trend data and future expected patterns as published by ONS on a national basis.
GL Hearn Page 22 of 71Adur, Arun, Brighton & Hove, Chichester, Lewes and Worthing Councils – Demographic Projections – August 2013
Fertility and mortality assumptions (key periods)
Age group Adur Arun Brighton & Chichester Lewes Worthing
Hove
TFR – 2011/12 2.10 2.05 1.68 2.02 2.03 2.05
TFR – 2030/31 1.91 1.85 1.52 1.85 1.86 1.86
Male e0 – 2011/12 78.7 79.8 77.7 80.0 81.2 78.6
Male e0 – 2030/31 82.4 83.5 81.9 83.5 84.9 82.2
Female e0 – 2011/12 82.5 83.7 82.9 83.8 84.7 82.8
Female e0 – 2030/31 85.7 86.9 86.2 86.9 88.0 86.1
Source: ONS 2010-based SNPP
Migration Assumptions
2.40 For the purposes of understanding the profile of migrants we have again drawn on the ONS 2010-and
2011-based sub-national population projections. Over the period from 2011 to 2031 our SNPP
updated projection (PROJ 2) shows an average annual level of net in-migration of about 6,800 people.
The data (shown below) clearly shows that the most important age groups are from 15 to 24. The high
level of net in-migration of those aged 15-19 is driven by in-migration to Brighton & Hove and to a
lesser extent Chichester – driven by the student population. All of the other four areas actually show
a net out-migration of the population aged 15 to 19. Data in Appendix X shows figures for each of the
individual local authority areas (which also shows in- and out-migration levels for each local authority).
2.41 When projecting migration patterns for the various projection scenarios we have used the migration
data and adjusted levels of in-migration to match the requirements of our scenario (e.g. when testing
what level of migration is required to support a workforce of a particular size). This approach has
consistently been adopted across all analysis.
GL Hearn Page 23 of 71Adur, Arun, Brighton & Hove, Chichester, Lewes and Worthing Councils – Demographic Projections – August 2013
Estimated Annual level of Net Migration by Five-Year Age Band (2011-2031)
3,500
Estimated annual level of net migration (people)
3,000 Worthing
Lewes
2,500 Chichester
Brighton & Hove
2,000 Arun
Adur
1,500
1,000
500
0
0-4 5-9 10- 15- 20- 25- 30- 35- 40- 45- 50- 55- 60- 65- 70- 75- 80- 85+
-500
14 19 24 29 34 39 44 49 54 59 64 69 74 79 84
-1,000
Age group
Source: Derived from ONS 2010-based Sub-Population Projections
Employment Rate Assumptions
2.42 With the change in demographic structure will come changes in the number of people who are
working (as the population of people of working age changes). The next stage of the projection
process was therefore to make estimates about how employment levels night change under each of
our main projections and also to consider the demographic implications of different levels of
employment growth.
2.43 The first stage of the process was to establish working patterns in each local authority. The figure
below shows data on the proportion of people living in each area who were in employment (based on
the proportion of the population aged 16-64 who are working). This latter data has also been provided
for the South East and Great Britain.
2.44 The data shows that overall the proportion of people working has been quite variable over time –
generally the trend has been downward although for a number of authorities the data shows an
upward trend (particularly over the past couple of years). Overall, it is quite difficult to pick out a real
trend from the district-level data. In both the South East and Great Britain employment rates can more
clearly be seen to have dropped along with a levelling off through 2012.
GL Hearn Page 24 of 71Adur, Arun, Brighton & Hove, Chichester, Lewes and Worthing Councils – Demographic Projections – August 2013
Proportion of Population Working
83%
81%
% of those aged 16-64 who are
79%
77%
75%
working
73%
71%
69%
67%
65%
2004 2005 2006 2007 2008 2009 2010 2011 2012
Adur Arun Brighton & Hove
Chichester Lewes Worthing
South East Great Britain
Source: Annual Population Survey
2.45 Part of the problem with the Annual Population Survey source used above is that data is based on
only a sample of the population and therefore figures can be quite variable at smaller area level. We
have therefore also drawn on data about unemployment to give an indication of how employment
rates may have changed over the past few years. In all areas this analysis shows a clearer trend
towards increased unemployment with figures going up in all areas (increases in unemployment
typically in the range of 2%-3% depending on area).
Unemployment rate
9%
8%
7%
6%
% unemployed
5%
4%
3%
2%
1%
0%
2004 2005 2006 2007 2008 2009 2010 2011 2012
Adur Arun
Brighton & Hove Chichester
Lewes Worthing
South East Great Britain
Source: Annual Population Survey (modelled data)
GL Hearn Page 25 of 71Adur, Arun, Brighton & Hove, Chichester, Lewes and Worthing Councils – Demographic Projections – August 2013
2.46 Using the above data to provide us with an overall picture of working patterns we also drew on 2001
and 2011 Census data and information from the Annual Population Survey to inform the distribution
of workers by age and sex. In projecting forward we have assumed that there is a latent labour force
that could be brought back into work as a result of reducing unemployment. This improvement is
assumed to occur fairly consistently through the projection period to 2031.
2.47 The modelling also includes provision for potential increases in rates due to changes in pensionable
age – these additional changes have been based on studying the age-specific ‘drop-off’ in
employment as people get older. The modelled improvement to employment rates will have the effect
of reducing unemployment.
2.48 The figure below shows how employment rates are projected to change over the period studied. In
all of the authorities the data shows a short-term improvement to about 2018 – this is mainly due to
changes in pensionable age – following this the rate levels off or drops down slightly – this is due to
age structure changes with a greater number of people expected to be in some of the older ‘working’
age groups which typically have lower employment rates. Beyond about 2027 there is expected to be
some increase in employment rates in most areas – this is again linked to demographic change with
all areas expected to see population increases in some of the key working age groups. Overall
employment rates are highest in Adur and lowest in Brighton & Hove.
Projected changes in Employment Rates
80%
% of population aged 16-64 in
78%
76%
employment
74%
72%
70%
68%
2011
2012
2013
2014
2015
2016
2017
2018
2019
2020
2021
2022
2023
2024
2025
2026
2027
2028
2029
2030
2031
Adur Arun Brighton & Hove Chichester Lewes Worthing
2.49 By applying these rates to our population figures it is estimated that in mid-2011 there were 386,050
people in employment across the sub-region – this figure has been derived by analysis of 2011
Census data and is consistent with recent figures provided in the Annual Population Survey.
GL Hearn Page 26 of 71Adur, Arun, Brighton & Hove, Chichester, Lewes and Worthing Councils – Demographic Projections – August 2013
Headship Rate Assumptions
2.50 Having estimated the population size and the age/sex profile of the population the next step in the
process is to convert this information into estimates of the number of households in the area. To do
this we use the concept of headship rates. For the purposes of this analysis we have used information
contained in the 2011-based CLG household projections about the relationship between the total
population in an age group and the number of household reference persons (HRPs) in that age group.
2.51 Headship rates can be described in their most simple terms as the number of people who are counted
as heads of households (or in this case the more widely used Household Reference Person (HRP)).
2.52 The figure below shows the estimated average household size in each area in 2001 and 2011 along
with estimated household sizes derived from CLG projections. The data shows in Chichester and
Adur that household sizes have been declining and are expected to continue to do so moving forward
(albeit at a slightly lesser rate). In Arun, Lewes and Worthing household sizes are roughly the same
in 2011 and they were in 2001 – in the future however, these are expected to decline which is more
consistent with a longer-term trend of seeing smaller household sizes.
2.53 In Brighton & Hove the situation is somewhat different; over the past decade we have seen a notable
increase in households sizes and this trend is expected to continue for a few years into the future.
Post about 2015 it is expected that household sizes in Brighton & Hove will start to decline although
the rate of change is far less pronounced when compared with other parts of the sub-region.
2.54 For the purposes of the projection across the whole sub-region it is assumed that average household
sizes start at about 2.26 in 2011 and reduce down to 2.19 in 2031 (although exact figures do vary
depending on the projection being run).
GL Hearn Page 27 of 71Adur, Arun, Brighton & Hove, Chichester, Lewes and Worthing Councils – Demographic Projections – August 2013
Past and projected trends in Average Household Size
2.35
2.30
2.25
2.20
Adur - trend Adur - projected
2.15
Arun - trend Arun - projected
Brighton & Hove - trend Brighton & Hove - projected
2.10 Chichester - trend Chichester - projected
Lewes - trend Lewes - projected
Worthing - trend Worthing - projected
2.05
2001
2002
2003
2004
2005
2006
2007
2008
2009
2010
2011
2012
2013
2014
2015
2016
2017
2018
2019
2020
2021
2022
2023
2024
2025
2026
2027
2028
2029
2030
2031
Source: Derived from ONS and CLG data (including 2011 Census)
2.55 When applying our headship rates to the population data we derive an estimated number of
households in mid-2011 of 354,500. This figure is consistent with the number of households shown
in the 2011 Census and the 2011-based CLG household projections.
Allowance for Vacant and Second Homes
2.56 In converting an estimated number of households into requirements for additional dwellings a small
vacancy allowance has also been factored in which is normal to allow for movement of households
between properties. For the analysis it is assumed that around 3% of additional stock will be vacant
which should be reflective of what can be achieved in new housing stock. This figure also includes
an allowance for growth in second home ownership.
GL Hearn Page 28 of 71Adur, Arun, Brighton & Hove, Chichester, Lewes and Worthing Councils – Demographic Projections – August 2013
3 PROJECTION OUTPUTS FOR SUSSEX COAST HMA
Introduction
3.1 This section provides detailed outputs of the modelling under each of the nine scenarios run to look
at population growth, employment change and housing requirements. All the projections look at the
period from 2011 to 2031 with outputs available for each year of the projection (although these have
generally been summarised for five year periods). The projections run are summarised in the figure
below.
Description of Projections used for Demographic Modelling
Projection Description
PROJ 1 Linked to 2010- and 2011-based SNPP
PROJ 2 SNPP (updated)
Demographic Driven
PROJ 3 10-year migration trends
PROJ 4 5-year migration trends
PROJ A Labour supply
Economic Driven PROJ B Labour demand
PROJ C Experian (updated)
PROJ Y Zero net migration
Component
PROJ Z Zero employment Growth
Population Projections
3.2 The figures below show the expected growth in population under each of the nine scenarios. The
data shows that the two demographic projections linked to the SNPP (PROJ 1 and 2) show population
growth of between 18% and 20% whilst the demographic projections linked to past migration trends
(PROJ 3 and 4) are also within this range (18%-20%). In numerical terms this represents an increase
of between about 146,000 and 159,300 people.
3.3 The three economic projections (PROJ A to C) again show similar levels of population growth to the
demographic projections ranging from 18% to 19% (144,400 to 155,400 more people). With no net
migration we would expect to see virtually no change in population over time whilst to maintain
employment at current (2011) levels would require a population increase of 6% - this is due to the
ageing of the population.
GL Hearn Page 29 of 71Adur, Arun, Brighton & Hove, Chichester, Lewes and Worthing Councils – Demographic Projections – August 2013
Population Estimates 2011 to 2031
2011 2016 2021 2026 2031
800,674 838,833 874,684 910,985 946,675
PROJ 1 (SNPP)
0.0% 4.8% 9.2% 13.8% 18.2%
800,674 840,751 879,264 918,518 957,266
PROJ 2 (SNPP updated)
0.0% 5.0% 9.8% 14.7% 19.6%
PROJ 3 (10-year migration 800,674 839,569 877,545 913,805 946,896
trends) 0.0% 4.9% 9.6% 14.1% 18.3%
PROJ 4 (5-year migration 800,674 842,213 883,272 923,045 959,930
trends) 0.0% 5.2% 10.3% 15.3% 19.9%
800,674 832,025 874,731 916,879 956,034
PROJ A (Labour supply)
0.0% 3.9% 9.2% 14.5% 19.4%
800,674 829,851 870,715 909,762 945,024
PROJ B (Labour demand)
0.0% 3.6% 8.7% 13.6% 18.0%
800,674 839,972 880,520 920,684 955,746
PROJ C (Experian (updated))
0.0% 4.9% 10.0% 15.0% 19.4%
800,674 806,598 808,793 806,915 800,634
PROJ W (Zero net migration)
0.0% 0.7% 1.0% 0.8% 0.0%
PROJ X (Zero employment 800,674 810,207 821,901 837,208 848,279
growth 0.0% 1.2% 2.7% 4.6% 5.9%
Population Change, 2011 – 2031
960,000
PROJ 1 (SNPP)
PROJ 2 (SNPP updated)
940,000 PROJ 3 (10-year migration trends)
PROJ 4 (5-year migration trends)
PROJ A (Labour supply)
920,000
PROJ B (Labour demand)
PROJ C (Experian (updated))
900,000 PROJ Y (Zero net migration)
PROJ Z (Zero employment growth)
Population
880,000
860,000
840,000
820,000
800,000
Year
GL Hearn Page 30 of 71Adur, Arun, Brighton & Hove, Chichester, Lewes and Worthing Councils – Demographic Projections – August 2013
Changes to the Population Structure
3.4 With the changes shown above there will also be a change in the age/sex profile of the population.
We have therefore looked in a bit more detail at population change under PROJ 2 (linked to the
updated SNPP). The figure below shows population pyramids for 2011 and 2031. The ‘pyramids’
show the growth in population overall and highlight the ageing of the population with a greater
proportion of the population expected to be in age groups aged 60 and over (and even more so for
older age groups) - in particular the oldest age group (85+) shows an increase from 26,700 people to
47,800.
Distribution of Population 2011 and 2031 (PROJ 2 – updated SNPP)
2011 2031
Ages 85+ 8,640 18,057 Ages 85+ 19,624 28,195
Ages 80-84 10,327 14,687 Ages 80-84 18,116 21,250
Ages 75-79 13,699 17,071 Ages 75-79 19,352 21,858
Ages 70-74 16,494 18,943 Ages 70-74 24,141 26,199
Ages 65-69 20,823 22,399 Ages 65-69 29,560 31,848
Ages 60-64 24,541 26,025 Ages 60-64 29,975 31,789
Ages 55-59 21,966 22,958 Ages 55-59 27,101 28,803
Ages 50-54 24,787 25,547 Ages 50-54 27,062 28,358
Ages 45-49 29,322 30,137 Ages 45-49 28,973 28,896
Ages 40-44 29,309 29,449 Ages 40-44 31,687 30,300
Ages 35-39 25,450 26,396 Ages 35-39 31,214 29,157
Ages 30-34 24,022 24,728 Ages 30-34 28,737 26,161
Ages 25-29 24,916 24,086 Ages 25-29 27,273 24,770
Ages 20-24 27,507 27,800 Ages 20-24 29,868 30,062
Ages 15-19 23,640 22,716 Ages 15-19 26,886 26,993
Ages 10-14 21,380 19,785 Ages 10-14 25,010 24,127
Ages 5-9 20,558 19,298 Ages 5-9 24,420 23,383
Ages 0-4 22,360 20,851 Ages 0-4 23,610 22,508
50000 25000 0 25000 50000 50000 25000 0 25000 50000
Female Male Female Male
3.5 The figure below summarises the findings for key (15 year) age groups. The largest growth will be in
people aged over 60. In 2031 it is estimated that there will be 301,900 people aged 60 and over. This
is an increase of 90,200 from 2011, representing growth of 43%. The population aged 75 and over is
projected to increase by an even greater proportion, 56%.
3.6 Looking at the other end of the age spectrum we can see that there are projected to be around 15%
more people aged under 15 with more moderate increases seen for all other age groups.
GL Hearn Page 31 of 71Adur, Arun, Brighton & Hove, Chichester, Lewes and Worthing Councils – Demographic Projections – August 2013
Population Change 2011 to 2031 by Fifteen Year Age bands
Age group Population Population Change in % change
2011 2031 population from 2011
Under 15 124,232 143,059 18,827 15.2%
15-29 150,665 165,853 15,188 10.1%
30-44 159,354 177,256 17,902 11.2%
45-59 154,717 169,192 14,475 9.4%
60-74 129,225 173,511 44,286 34.3%
75+ 82,481 128,396 45,915 55.7%
Total 800,674 957,266 156,592 19.6%
3.7 The figure below shows the percentage changes for each five year age group. The most stark trend
is the increase in the population aged 85 and over (up 79%) which may have implications for future
housing delivery as many of this group may require some form of specialist housing. In contrast we
see only moderate increases (and some decreases) in most age groups up to age 65.
Forecast Population Change by Age Group 2011 – 2031
90%
79%
80%
70%
%age population change 2011-2031
60% 57%
50%
42% 42%
40% 34%
30% 24%
22%
20% 19%
20% 16% 16%
13%
8% 10%
10% 7% 6% 5%
0%
0-4
5-9
10-14
15-19
20-24
25-29
30-34
35-39
40-44
45-49
50-54
55-59
60-64
65-69
70-74
75-79
80-84
85+
-3%
-10%
Changes in Labour Supply & Employment
3.8 The figures below show the estimated number of people living in the sub-region who are working
under each of our nine projections. The two demographic projections linked to the SNPP (PROJ 1
and 2) show increases in the number of residents who are working of between 13% and 15% whilst
the demographic projections linked to past trends (PROJ 3 and 4) are very slightly higher with
increases in the number of residents who are working ranging from 14% to 16% (53,200 to 61,200 in
numerical terms).
GL Hearn Page 32 of 71Adur, Arun, Brighton & Hove, Chichester, Lewes and Worthing Councils – Demographic Projections – August 2013
3.9 The three economic projections (PROJ A to C show forecast increases in the number of people
working of between 13% and 15% - roughly the same as the two SNPP based projections. With no
net migration we would expect to see a notable decline in the working population – this would fall
from 386,000 people in 2011 to 362,800 in 2031 – a decrease of 6%.
Employment Estimates 2011 to 2031
2011 2016 2021 2026 2031
386,050 402,147 415,145 425,103 437,157
PROJ 1 (SNPP)
0.0% 4.2% 7.5% 10.1% 13.2%
386,050 403,939 419,115 431,147 445,249
PROJ 2 (SNPP updated)
0.0% 4.6% 8.6% 11.7% 15.3%
PROJ 3 (10-year migration 386,050 403,167 417,969 428,346 439,273
trends) 0.0% 4.4% 8.3% 11.0% 13.8%
PROJ 4 (5-year migration 386,050 404,872 421,710 434,174 447,219
trends) 0.0% 4.9% 9.2% 12.5% 15.8%
386,050 398,507 415,582 428,823 442,435
PROJ A (Labour supply)
0.0% 3.2% 7.6% 11.1% 14.6%
386,050 397,304 413,467 425,110 436,641
PROJ B (Labour demand)
0.0% 2.9% 7.1% 10.1% 13.1%
386,050 403,115 418,827 430,695 442,067
PROJ C (Experian (updated))
0.0% 4.4% 8.5% 11.6% 14.5%
386,050 384,507 380,024 371,368 362,830
PROJ W (Zero net migration)
0.0% -0.4% -1.6% -3.8% -6.0%
PROJ X (Zero employment 386,050 386,050 386,050 386,050 386,050
growth 0.0% 0.0% 0.0% 0.0% 0.0%
3.10 A key issue is what weight should be attached to the economic-driven projections. The projections
are sensitive to:
• changes in the proportion of people in different age groups in work;
• the balance of commuting in and out of each District;
• performance of different sectors within the local economy;
• the investment/disinvestment decision of individual businesses;
• enterprise and growth in the small business base within each District;
• The potential for ‘double jobbing’ where people can hold down more than one job.
3.11 There are multiple assumptions which feed into the projections and while they are important in
considering issues regarding homes-jobs balance, in our view greater weight should be attached to
the demographic-driven projections.
GL Hearn Page 33 of 71Adur, Arun, Brighton & Hove, Chichester, Lewes and Worthing Councils – Demographic Projections – August 2013
Employment Change, 2011 – 2031
450,000
PROJ 1 (SNPP)
PROJ 2 (SNPP updated)
440,000 PROJ 3 (10-year migration trends)
PROJ 4 (5-year migration trends)
430,000 PROJ A (Labour supply)
PROJ B (Labour demand)
PROJ C (Experian (updated))
420,000
Number of people working
PROJ Y (Zero net migration)
PROJ Z (Zero employment growth)
410,000
400,000
390,000
380,000
370,000
360,000
Year
Household Growth
3.12 The figures below show the projected growth in the number of households under each of the nine
scenarios. The two demographic projections linked to the SNPP (PROJ 1 and 2) show household
growth of between 22% and 23% (76,700 to 81,900 additional households) between 2011-31 whilst
figures derived under the demographic projections linked to past trends are broadly similar
(household growth of between 78,000 and 83,000).
3.13 The economic projections (PROJ A to C) are again consistent with demographically-based
projections with household growth in the range of 22% to 23% which is up to 81,400 more households.
With no net migration we would expect to see an increase in households of 5.5% despite this
projection showing no change in population. This is related to changes in the age structure of the
population and how people of different ages occupy homes. To achieve stable employment levels it
is expected that the number of households would need to increase by about 11%.
GL Hearn Page 34 of 71Adur, Arun, Brighton & Hove, Chichester, Lewes and Worthing Councils – Demographic Projections – August 2013
Household Estimates 2011 to 2031
2011 2016 2021 2026 2031
354,537 372,748 391,877 411,356 431,269
PROJ 1 (SNPP)
0.0% 5.1% 10.5% 16.0% 21.6%
354,537 373,714 394,077 414,976 436,464
PROJ 2 (SNPP updated)
0.0% 5.4% 11.2% 17.0% 23.1%
PROJ 3 (10-year migration 354,537 373,352 393,509 413,289 432,569
trends) 0.0% 5.3% 11.0% 16.6% 22.0%
PROJ 4 (5-year migration 354,537 374,226 395,547 416,683 437,490
trends) 0.0% 5.6% 11.6% 17.5% 23.4%
354,537 370,453 392,314 414,363 435,885
PROJ A (Labour supply)
0.0% 4.5% 10.7% 16.9% 22.9%
354,537 369,581 390,670 411,486 431,438
PROJ B (Labour demand)
0.0% 4.2% 10.2% 16.1% 21.7%
354,537 373,473 394,664 415,949 435,925
PROJ C (Experian (updated))
0.0% 5.3% 11.3% 17.3% 23.0%
354,537 360,536 366,350 370,825 374,166
PROJ W (Zero net migration)
0.0% 1.7% 3.3% 4.6% 5.5%
PROJ X (Zero employment 354,537 362,111 371,636 382,891 393,092
growth 0.0% 2.1% 4.8% 8.0% 10.9%
Household Change, 2011 – 2031
440,000
PROJ 1 (SNPP)
PROJ 2 (SNPP updated)
430,000
PROJ 3 (10-year migration trends)
PROJ 4 (5-year migration trends)
420,000 PROJ A (Labour supply)
PROJ B (Labour demand)
410,000 PROJ C (Experian (updated))
PROJ Y (Zero net migration)
PROJ Z (Zero employment growth)
Households
400,000
390,000
380,000
370,000
360,000
350,000
Year
GL Hearn Page 35 of 71You can also read