Product User Guide - IASI level2 TS, T,Q release 1 - Eumetsat
←
→
Page content transcription
If your browser does not render page correctly, please read the page content below
Product User Guide – IASI level2 TS, T,Q release
                        1

                 DOI: 10.15770/EUM_SEC_CLM_0027

                                                                                                 EUMETSAT
Doc.No.   :   EUM/OPS/DOC/19/1085967                          Eumetsat-Allee 1, D-64295 Darmstadt, Germany
                                                                                         Tel: +49 6151 807-7
Issue     :   v3 e-signed                                                             Fax: +49 6151 807 555
Date      :   22 January 2021                                                        http://www.eumetsat.int

WBS/DBS :

                                              © EUMETSAT
                      The copyright of this document is the property of EUMETSAT.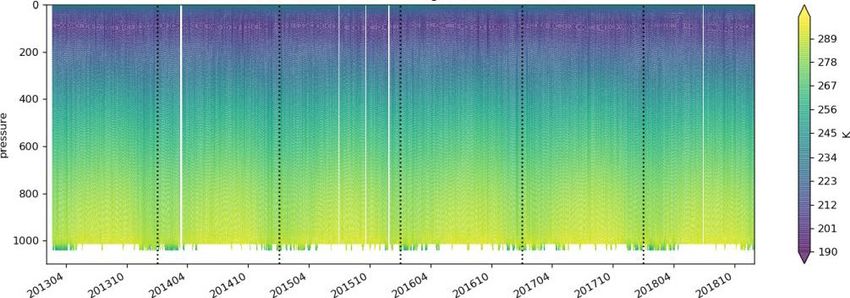
EUM/OPS/DOC/19/1085967
                                                                                v3 e-signed, 22 January 2021

                                           Product User Guide – IASI level2 TS, T,Q release 1

Document Change Record

       Issue /         Date         DCN. No                    Changed Pages / Paragraphs
      Revision

 v1              27 May 2020                    First Draft for Internal Review.

 v2              10 August 2020                 Version for RSP review

 v2a             31 October 2020                Final version for DRR

 v2b             3 December 2020                Version to implement Rids changes

 v2c             11 December 2020               Version to implement changes after DRR meeting

 v3              22 January 2021                Final version for publication

                                       Page 3 of 38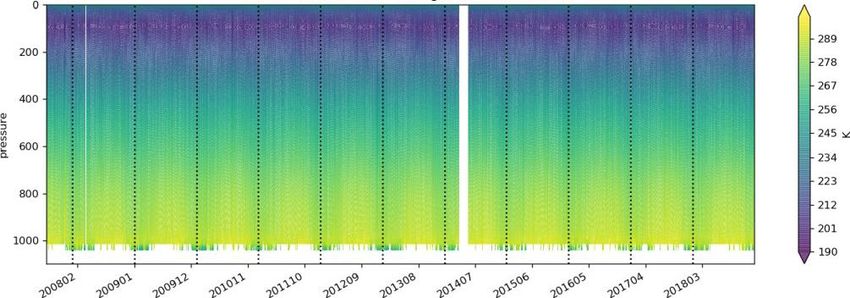
EUM/OPS/DOC/19/1085967
                                                                                                                  v3 e-signed, 22 January 2021

                                                                      Product User Guide – IASI level2 TS, T,Q release 1

Table of Contents
1    Introduction ................................................................................................................................. 7
     1.1 Purpose and Scope ............................................................................................................ 7
     1.2 Document Structure ............................................................................................................ 7
     1.3 Reference documents ........................................................................................................ 8
     1.4 Acronyms and Abbreviations .............................................................................................. 8
2    Background ............................................................................................................................... 10
     2.1 The IASI Instrument .......................................................................................................... 10
     2.2 The AMSU-A and MHS microwave instruments .............................................................. 11
     2.3 The PWLR3 algorithm ....................................................................................................... 11
3    Data record overview................................................................................................................ 13
4    Product definition ..................................................................................................................... 14
     4.1 Physical definition ............................................................................................................. 14
     4.2 Data files content and organisation .................................................................................. 16
           4.2.1 Time ..................................................................................................................... 16
           4.2.2 Geolocation and geometry................................................................................... 16
           4.2.3 Vertical grid .......................................................................................................... 17
     4.3 Variables ........................................................................................................................... 17
           4.3.1 Atmospheric Temperature ................................................................................... 17
           4.3.2 Atmospheric Water Vapour.................................................................................. 18
           4.3.3 Surface Temperature ........................................................................................... 18
     4.4 Processing flags and quality information .......................................................................... 19
           4.4.1 Uncertainty estimates .......................................................................................... 19
           4.4.2 FLG_IASIBAD ...................................................................................................... 20
           4.4.3 FLG_AMSUBAD .................................................................................................. 20
           4.4.4 FLG_MHSBAD .................................................................................................... 21
           4.4.5 FLG_INITIA .......................................................................................................... 21
           4.4.6 OmC: Observation minus Calculation ................................................................. 21
     4.5 Auxiliary information ......................................................................................................... 22
           4.5.1 AVHRR L1B Cloud Fraction ................................................................................ 22
           4.5.2 Elevation .............................................................................................................. 22
           4.5.3 Land Fraction ....................................................................................................... 22
     4.6 Period coverage................................................................................................................ 22
     4.7 List of parameters available in the product ....................................................................... 25
           4.7.1 Global attributes ................................................................................................... 25
           4.7.2 Variables .............................................................................................................. 26
     4.8 Data and file name format description .............................................................................. 31
     4.9 Product generated ............................................................................................................ 31
     4.10 Format .............................................................................................................................. 31
5    Product validation summary ................................................................................................... 32
6    Product ordering ....................................................................................................................... 34
     6.1 Register with the Data Centre .......................................................................................... 34
     6.2 Order Data ........................................................................................................................ 34
7    Product support and feedback ................................................................................................ 34
8    Product referencing .................................................................................................................. 34
Appendix A         list of missing orbits .......................................................................................... 35

                                                                Page 4 of 38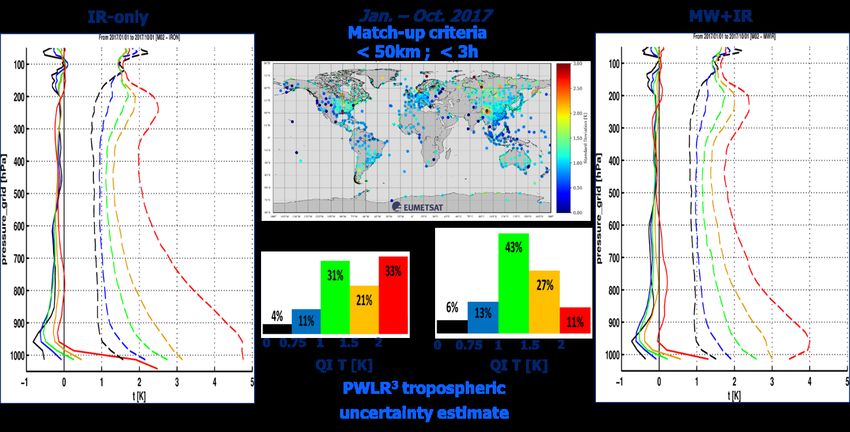
EUM/OPS/DOC/19/1085967
                                                                                                                         v3 e-signed, 22 January 2021

                                                                          Product User Guide – IASI level2 TS, T,Q release 1

List of Tables
Table 1: Extraction of a python script computing the time for each line. .............................................. 16
Table 2: FLG_IASIBAD Enumeration Key ............................................................................................ 20
Table 3: FLG_AMSUBAD Enumeration Key......................................................................................... 21
Table 4: FLG_MHSBAD Enumeration Key ........................................................................................... 21
Table 5: Bitfield enumeration FLG_INITIA ............................................................................................ 21
Table 6: Temporal coverage of the IASI L2 climate data record per satellite. ...................................... 22
Table 7: Number of days with missing orbits per satellite and instrument ............................................ 22
Table 8: Global attributes of each file ................................................................................................... 25
Table 9: Content of the CDR files. One file per orbit. nlin is the number of scan lines per orbit. Second
     dimension is the number of pixels per line and third dimension is the number of vertical levels. 26
Table 10: IASI filename description ...................................................................................................... 31
Table 11: Missing orbits per day for IASI-A .......................................................................................... 35
Table 12: Number of missing orbits per day for IASI-B ........................................................................ 36
Table 13: Number of missing orbits per day for AMSU-A on Metop-A ................................................. 36
Table 14: Number of missing orbits per day for AMSU-A on Metop-B ................................................. 37
Table 15: Number of missing orbits per day for MHS on Metop-A ....................................................... 37
Table 16: Number of missing orbits per day for MHS on Metop-B ....................................................... 38

List of Figures
Figure 1: a) Idealised view of IASI sensing system. b) and c) IASI geometry from level 2 (EUMETSAT,
     2020b). ......................................................................................................................................... 10
Figure 2: Synergy between infrared (IASI) and microwave (MHS and AMSU-A) instruments. ............ 11
Figure 3: Idealised view of the IASI footprint geometry with the associated AMSU-A, MHS footprints.
     Each IASI field of view is composed of 4 IASI pixels, each IASI pixel diameter is approximatively
     12km at nadir. ............................................................................................................................... 11
Figure 4: Overall picture of the operational EUMETSAT IASI level2 atmospheric product. ................. 12
Figure 5: a) 137 hybrid sigma pressure levels and b) an example of a temperature and humidity
     atmospheric profile at one particular location. .............................................................................. 14
Figure 6: Idealised view of a pixel for each orbit scan line. .................................................................. 14
Figure 7: Example of location of IASI individual pixels for a descending orbit (top) and ascending orbit
     (bottom), note grey pixels are not coloured for clarity reasons, otherwise have the same content
     as the coloured pixels. Figures from: IASI_PW3_02_M02_20190126230859Z_20190126231154Z
     ...................................................................................................................................................... 15
Figure 8: Example of the acquisition time (in hours) on the 1st of January 2008. ................................. 16
Figure 9: IASI-A solar and satellite zenith and azimuth angles for ascending and descending part of the
     orbit for the 1st of January 2008.................................................................................................... 17
Figure 10: Example of daily maps of a) Atmospheric Temperature (level #90, see Figure 5a, about
     400hPa) and b) Quality Indicator of the Atmospheric Temperature [Metop-A 2008/01/01] ......... 18
Figure 11: Example of daily maps of a) Atmospheric Humidity (level #90, see Figure 5a, about 400hPa)
     and b) Quality Indicator of the Atmospheric Humidity [Metop-A 2008/01/01] .............................. 18
Figure 12: Example of daily maps of a) Surface Temperature and b) Quality Indicator of the Surface
     Temperature [Metop-A 2008/01/01] ............................................................................................. 19
Figure 13: Temperature retrieval yield and precision in the IRON and MWIR modes stratified against
     the quality indicator (uncertainty estimate), assessed through 2017 with radiosonde measurement
     pre-processed in the NOAA Integrated Global Radiosonde Archive (IGRA). Solid lines are the bias
     and dash lines are the standard deviations. The colours represent data for several QI T
     ranges. .......................................................................................................................................... 20
Figure 14: Example of daily maps of a) Observation minus Calculation and b) AVHRR Cloud fraction
     [Metop-A 2008/01/01] ................................................................................................................... 22
Figure 15: Example of a global IASI-A daily averaged surface temperature (K) in green. Red dots
     represent the percentage of missing data for a specific day. Ts is obtained using PWRL3. ........ 23

                                                                   Page 5 of 38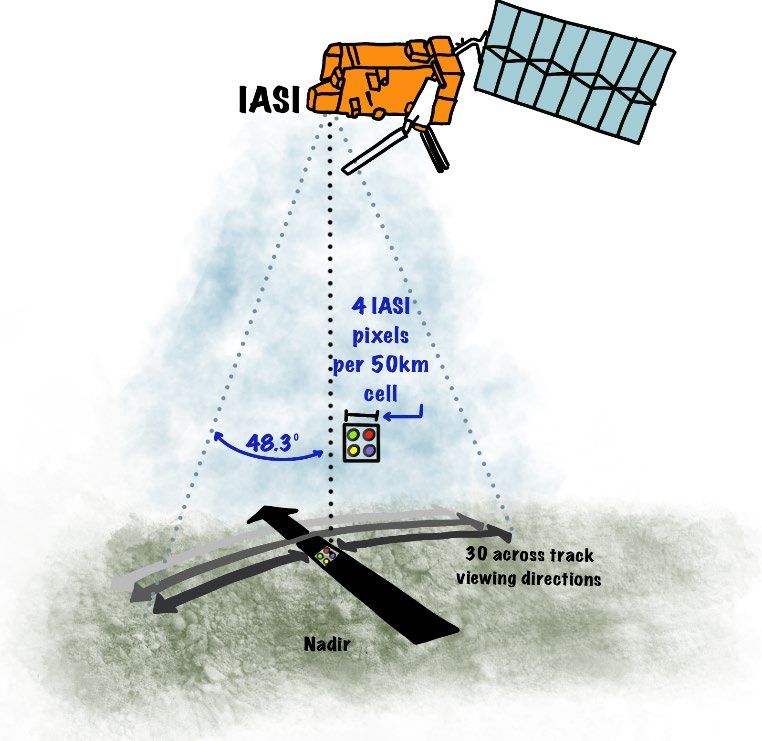
EUM/OPS/DOC/19/1085967
                                                                                                               v3 e-signed, 22 January 2021

                                                                    Product User Guide – IASI level2 TS, T,Q release 1

Figure 16: Hovmoeller plots of IASI-A temperature and specific humidity profiles, global daily average
     over the entire CDR range. .......................................................................................................... 23
Figure 17: Hovmoeller plots of IASI-B temperature and specific humidity profiles, global daily over the
     entire CDR range.......................................................................................................................... 24

                                                              Page 6 of 38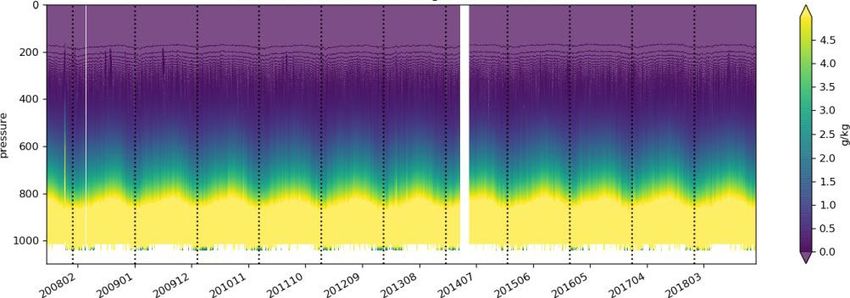
EUM/OPS/DOC/19/1085967
                                                                               v3 e-signed, 22 January 2021

                                                 Product User Guide – IASI level2 TS, T,Q release 1

1     Introduction
1.1    Purpose and Scope

The purpose of this document is to provide users with detailed information about the release 1 of the
reprocessed Metop-A and –B Infrared Atmospheric Sounding Interferometer (IASI) level 2 (L2)
temperature and humidity profiles together with the surface temperature and the total column water
vapour.

The reprocessed “all-sky” IASI temperature and humidity profiles data record (release 1) relies on the
latest algorithms available at the time of the reprocessing (Version 6.5.4, 12/2019) of the operational
EUMETSAT algorithm (August, 2017; EUMETSAT, 2020b) and consists of the outputs of the
statistical retrieval module Piece Wise Linear Regression (PWLR3) only. This release contains data for
IASI-A from the 10th of July 2007 until the 31st December 2018 and IASI-B from 20th February 2013
until 31st December 2018.

The purposes of the reprocessing of the Level 2 IASI temperature and humidity profiles are to provide
a homogeneous Thematic Climate Data Record throughout the time period that is of sufficient quality
for user applications using the best, latest processor version in operations at that time.

For IASI-A, the release 1 of the fundamental climate data record (FCDR) reprocessed IASI L1c
(EUMETSAT, 2019) was used as input up to December 2016. After that date for IASI-A, and for the
entire period for IASI-B, the L1c products from the operational near real time processing were used to
generate this L2 data record. IASI-A reprocessing was only needed for the early period where major
changes happened. IASA-A reprocessed data before 2017 and IASI-A operational data from 2017 used
the same version of the software to generate the data making the IASI-A L1c series fully homogeneous.
IASI-B L1c data was not reprocessed because the operational L1c data are stable and homogeneous and
there have been no major changes potentially affecting the CDR throughout IASI-B period. The two
dataset are fully consistent for the generation of the level 2 product.

This guide provides:
1. Specifications of the data record;
2. Scientific overview on the generation and definition of the data record;
3. Characteristics and limitations of the product, to inform and guide the users in applying best-suited
    data selection for their specific applications;
4. Technical details on the format and the ordering of the data record, as well as information on the
    mechanisms to provide feedback.

1.2    Document Structure

 Section      Contents
 Section 1    Introduction
 Section 2    Background
 Section 3    Data Record overview
 Section 4    Product definition
 Section 5    Product validation summary

                                            Page 7 of 38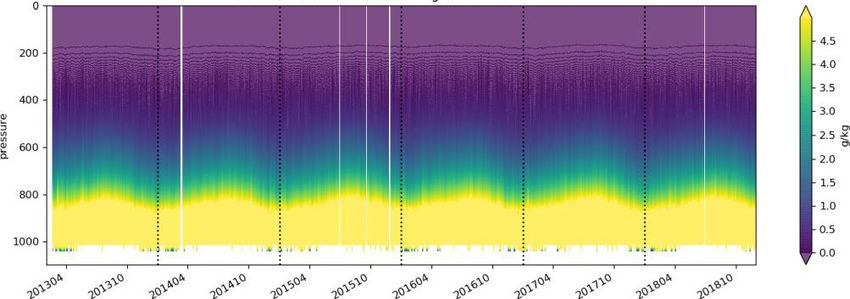
EUM/OPS/DOC/19/1085967
                                                                                 v3 e-signed, 22 January 2021

                                                  Product User Guide – IASI level2 TS, T,Q release 1

 Section 6    Product support and feedback
 Section 7    Product referencing
 Appendix     List of missing orbits

1.3   Reference documents

August, T.: The EUMETSAT operational IASI L2 products and services, from Global to Regional,
Darmstadt,
https://cimss.ssec.wisc.edu/itwg/itsc/itsc21/program/1december/1600_11.01_EUM_IASI_L2___ITSC
-21____August.pdf, 2017.

ECMWF:         ECMWF             L137       model        level       definitions,     ECMWF
https://www.ecmwf.int/en/forecasts/documentation-and-support/137-model-levels, last access: 10
December 2020, 2014.

EUMETSAT: AMSU-A Level 1 Product Generation Specification,                                   https://www-
cdn.eumetsat.int/files/2020-04/pdf_ten_990005-eps-amsal1-pgs.pdf, 2016a.

EUMETSAT:          MHS      Level     1   Product   Generation      Specification,           https://www-
cdn.eumetsat.int/files/2020-04/pdf_ten_990006-eps-mhs-l1-pgs.pdf, 2016b.

EUMETSAT: IASI Level 2 product guide, https://www-cdn.eumetsat.int/files/2020-
07/IASI%20Level%202_%20Product%20Guide.pdf, 2017.

EUMETSAT:       Validation     Report    –          IASI-A      Level     1c     FCDR        release      1,
https://www.eumetsat.int/media/47452, 2019.

EUMETSAT: EUMETSAT data policy, https://www.eumetsat.int/media/45173, 2020a.

EUMETSAT:          IASI    Level 2: Product Generation     Specification,                    https://www-
cdn.eumetsat.int/files/2020-
12/IASI%20Level%202_%20Product%20Generation%20Specification.pdf, 2020b.

EUMETSAT:          MTG-IRS         L2            ATBD,          https://www-cdn.eumetsat.int/files/2020-
06/pdf_mtg_irs_l2_atbd.pdf, 2020c.

Hilton, F., Armante, R., August, T., Barnet, C., Bouchard, A., Camy-Peyret, C., Capelle, V., Clarisse,
L., Clerbaux, C., Coheur, P.-F., Collard, A., Crevoisier, C., Dufour, G., Edwards, D., Faijan, F., Fourrié,
N., Gambacorta, A., Goldberg, M., Guidard, V., Hurtmans, D., Illingworth, S., Jacquinet-Husson, N.,
Kerzenmacher, T., Klaes, D., Lavanant, L., Masiello, G., Matricardi, M., McNally, A., Newman, S.,
Pavelin, E., Payan, S., Péquignot, E., Peyridieu, S., Phulpin, T., Remedios, J., Schlüssel, P., Serio, C.,
Strow, L., Stubenrauch, C., Taylor, J., Tobin, D., Wolf, W. and Zhou, D.: Hyperspectral Earth
Observation from IASI: Five Years of Accomplishments, Bull. Am. Meteorol. Soc., 93(3), 347–370,
https://doi.org/10.1175/BAMS-D-11-00027.1, 2012.

1.4   Acronyms and Abbreviations

The table below lists acronyms and abbreviations used in this document:

                                             Page 8 of 38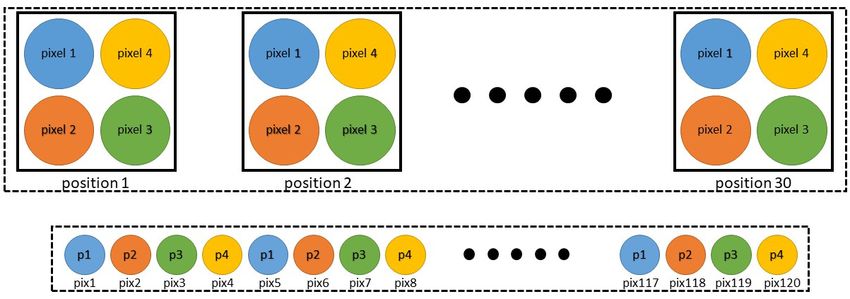
EUM/OPS/DOC/19/1085967
                                                                            v3 e-signed, 22 January 2021

                                            Product User Guide – IASI level2 TS, T,Q release 1

Acronym     Meaning
AMSU-A      Advanced Microwave Sounding Unit-A
ATBD        Algorithm Theoretical Baseline Document
AVHRR       Advanced Very High Resolution Radiometer
CDR         Climate Data Record
DOI         Digital Object Identifier
EARS        EUMETSAT Advanced Retransmission Service
ECMWF       European Centre for Medium-Range Weather Forecasts
ERA         European Reanalysis
EPS         EUMETSAT Polar System
EUMETSAT    European Organisation for the Exploitation of Meteorological Satellites
IASI        Infrared Atmospheric Sounding Interferometer
IFOV        Instantaneous Field of View
IGRA        Integrated Global Radiosonde Archive
IIS         Integrated Imaging Subsystem
IRON        Infra-Red ONly
ITCZ        Inter-Tropical Convergence zone
L1c         Level 1c
L2          Level 2
Metop       Meteorological operational satellite
MHS         Microwave Humidity Sounder
MWIR        Micro-Wave Infra-Red
NOAA        National Oceanic and Atmospheric Administration
OmC         Observation minus Calculation
PPF         Product Processing Facility
PWLR    3
            Piece Wise Linear Regression
TCDR        Thematic Climate Data Record

                                        Page 9 of 38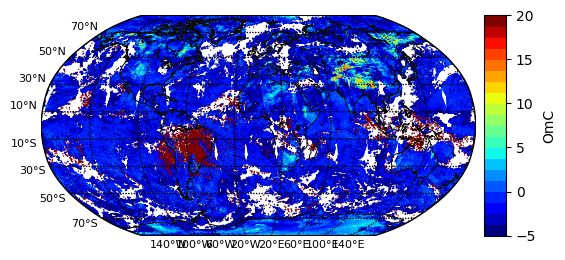
EUM/OPS/DOC/19/1085967
                                                                                  v3 e-signed, 22 January 2021

                                                  Product User Guide – IASI level2 TS, T,Q release 1

2     Background
2.1   The IASI Instrument

The Infrared Atmospheric Sounding Interferometer (IASI) is composed of a Fourier transform
spectrometer and an associated Integrated Imaging Subsystem (IIS) (Hilton et al., 2012). The Fourier
transform spectrometer provides infrared spectra with high spectral resolution between 645 and 2760
cm-1 (3.6 µm to 15.5 µm). The IIS consists of a broadband radiometer with a high spatial resolution.
However, the IIS information is only used for co-registration with the Advanced Very High Resolution
Radiometer (AVHRR). Three IASI instruments are mounted on the Metop satellite series. Metop-A
was launched in 2006, Metop-B in 2012 and Metop-C, the last of the series, was launch in 2018.

The IASI instrument observes the Earth up to a viewing angle of 48.3 degrees on either side of the
satellite track (Figure 1), thus achieving a nearly daily global coverage. For each view, the instrument
analyses an atmospheric cell of about 3.3 degrees x 3.3 degrees, or 50 km x 50 km at nadir. Each cell
is analysed simultaneously by a 2 x 2 array of detectors. This geometrical arrangement, together with
the step-by-step scanning mode, gives IASI a field of view that can be combined with the other
instruments on the platform. The pixel diameter of 12 kilometres at nadir is a trade-off between
radiometric performance and likelihood of acquiring measurements in clear-sky, which was originally
the prime scope of the mission.

 a)                                                            b) IASI scanning geometry

                                                               c) Scan position (SP) numbering and
                                                               viewing angle computation (α, in degrees)

Figure 1: a) Idealised view of IASI sensing system. b) and c) IASI geometry from level 2 (EUMETSAT, 2020b).

                                             Page 10 of 38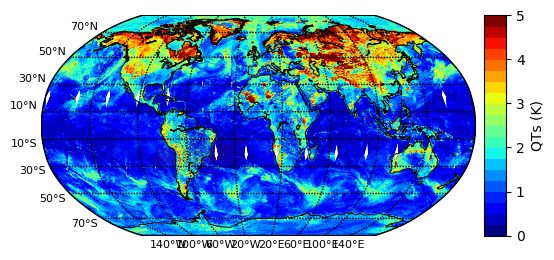
EUM/OPS/DOC/19/1085967
v3 e-signed, 22 January 2021
Product User Guide – IASI level2 TS, T,Q release 1
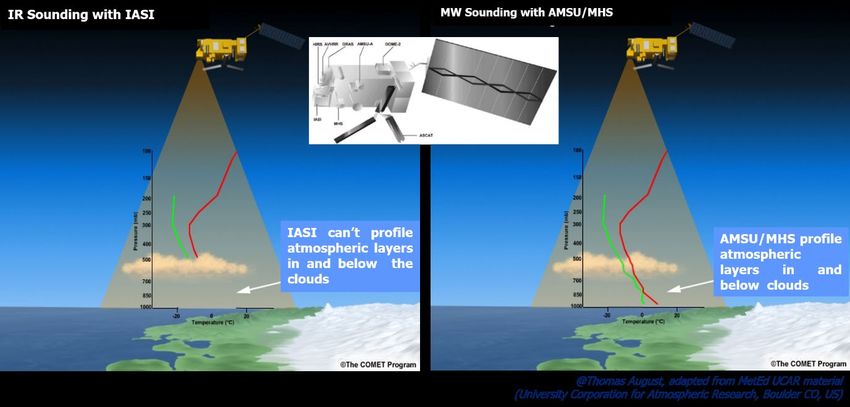
2.2 The AMSU-A and MHS microwave instruments
The retrieval of humidity and temperature profiles uses the infrared measurements of IASI in synergy
with the microwave measurements from the Microwave Humidity Sounder (MHS) (EUMETSAT,
2016b) and the Advanced Microwave Sounding Unit-A (AMSU-A) (EUMETSAT, 2016a) that are all
flying on the Metop platform. The microwave instruments provide complementary information from
the bottom of the atmosphere in cloudy pixels, where IASI cannot get any signal (Figure 2). The
footprint geometry of the three instruments used in the retrieval is shown on Figure 3.
Figure 2: Synergy between infrared (IASI) and microwave (MHS and AMSU-A) instruments.
Figure 3: Idealised view of the IASI footprint geometry with the associated AMSU-A, MHS footprints. Each
IASI field of view is composed of 4 IASI pixels, each IASI pixel diameter is approximatively 12km at nadir.
2.3 The PWLR3 algorithm
EUMETSAT produces several operational IASI Level 2 products coming from different algorithms as
shown in Figure 4.
Page 11 of 38EUM/OPS/DOC/19/1085967
v3 e-signed, 22 January 2021
Product User Guide – IASI level2 TS, T,Q release 1
Figure 4: Overall picture of the operational EUMETSAT IASI level2 atmospheric product.
The climate data record is generated using the Piece-Wise Linear Regression (PWLR3). It is a fast and
accurate statistical “all sky” retrieval scheme that uses a synergy between microwave and IR
measurements from the polar satellite Metop. The input products of this algorithm are the IASI L1C,
the AMSU-A L1B and the MHS L1B. The algorithm provides, for each retrieval, an associated quality
indicator.
The PWLR3 is a machine learning algorithm trained with real satellite observations paired with best
correlative representation of the Earth system. For this TCDR reprocessing, it includes four surface
parameters (surface pressure, surface air temperature, surface air dew point temperature, and surface
skin temperature) as well as the atmospheric profiles of temperature and humidity. In addition, the
algorithm also provides a cloud indicator (the predicted Observation-Calculation in window channels)
and an uncertainty estimate for each product.
The training set used for the algorithm in this reprocessing is composed of the ERA-5 reanalysis for
temperature, humidity and ozone, provided at 137 model levels. It uses 96 days of sensing data, 4 days
(1st, 8th, 15th and 22nd) of each month for 2 years in 2015 and 2016. In total, the training set is made up
of more than 120 million IASI fields of view. The algorithm defines different observation classes based
on the IASI observations and on auxiliary information (e.g. surface type and elevation). Then, for each
observation class, a linear regression is performed from the IASI/AMSU-A/MHS observation to
retrieve the required geophysical parameters. The vertical profiles are retrieved on 138 levels, reflecting
the 137 hybrid levels from the ERA-5 L137 grid plus the surface air level.
Depending on the availability of the microwave inputs, the PWLR3 retrieval works in two different
modes using two different sets of coefficients. The nominal mode is called MWIR (for “Micro-Wave
Infra-Red”) and is using both the IASI and the microwave data from AMSU-A and MHS. If the
microwave data are not available (e.g. because of calibration issues or instrument failure, etc.), the
retrieval is then done with the IASI data alone. This mode is called IRON (for Infra-Red Only) and
provides retrievals of the same quality as the MWIR mode in clear sky condition. For cloudy pixels, the
IRON mode provides retrievals with a slightly lower yield and quality as compared to the MWIR mode.
Page 12 of 38EUM/OPS/DOC/19/1085967
v3 e-signed, 22 January 2021
Product User Guide – IASI level2 TS, T,Q release 1
3 Data record overview
IASI-A and –B climate data record of all sky temperature and humidity
Data record name
profiles release 1
Data record digital
10.15770/EUM_SEC_CLM_0027
identifier
Reprocessed TCDR level 2 IASI-A and –B temperature and humidity
Data record short
General
profiles plus surface temperature, total column water vapour and
description
associated quality indicators retrieved using the PWLR3 algorithm
Record type Thematic Climate Data Record
IASI-A: 10 July 2007 – 31 December 2018
Period covered
IASI-B: 20 February 2013 – 31 December 2018
IASI level 2 temperature and humidity profiles, surface temperature and
Content
total column water vapour
Instrument name Infrared Atmospheric Sounding Interferometer (IASI)
The Infrared Atmospheric Sounding Interferometer (IASI) is one of the
instruments flying on Metop-A, B and C. The IASI L1c product contains
Instrument
infrared radiance spectra at 0.25 cm-1 sampling. The level 1c product has
description
for each pixel 8461 spectral samples covering the range between 645 cm-
1
and 2760 cm-1.
Instrument
IASI level 1c
MHS
Input data
AMSU-A
AVHRR
IASI level 2, temperature and humidity profiles, surface temperature and
Output data total column water vapour plus some associated quality indicators and
processing flags.
Format The products are provided in NetCDF4
EUMETSAT Data The data set is available from EUMETSAT Data Centre
Centre (https://eoportal.eumetsat.int/)
Access
• ftp push
Delivery
• online pull
• global
Coverage
Spatial
• each pixel (IFOV) has a ground resolution of 12 km at nadir
Temporal ~100 minutes per orbit, 14 orbits per day
Page 13 of 38EUM/OPS/DOC/19/1085967
v3 e-signed, 22 January 2021
Product User Guide – IASI level2 TS, T,Q release 1
4 Product definition
This section provides summary information on file-size, file content, file formats, and file-names for
the IASI-A and –B IASI “all-sky” temperature and humidity release 1 CDR.
4.1 Physical definition
The temperature (in K) and the specific humidity, also called atmospheric water vapour, (in kg/kg) are
provided on the 137 hybrid sigma pressure levels of the ECMWF L137 grid (Figure 5, (ECMWF,
2014)). These levels follow the terrain near the surface and provide a smooth transition to pressure
levels at higher altitude. The CDR contains also the 2-meter air surface temperature (in K) and humidity
(in kg.kg) as well as the total column water-vapour content (TCWV, in mm). The TCWV is computed
after integration of the atmospheric water-vapour profile. There are several associated quality indicators
and flags to help the user filtering the data.
a) b)
Figure 5: a) 137 hybrid sigma pressure levels and b) an example of a temperature and humidity atmospheric
profile at one particular location.
Figure 6: Idealised view of a pixel for each orbit scan line.
Page 14 of 38EUM/OPS/DOC/19/1085967
v3 e-signed, 22 January 2021
Product User Guide – IASI level2 TS, T,Q release 1
Figure 7: Example of location of IASI individual pixels for a descending orbit (top) and ascending orbit
(bottom), note grey pixels are not coloured for clarity reasons, otherwise have the same content as the coloured
pixels. Figures from: IASI_PW3_02_M02_20190126230859Z_20190126231154Z
Page 15 of 38EUM/OPS/DOC/19/1085967
v3 e-signed, 22 January 2021
Product User Guide – IASI level2 TS, T,Q release 1
The data are provided in orbits. Each orbit file contains a similar number of scan lines. The scan starts
on the left side with respect to the flight direction of the spacecraft (Figure 7). Each scan line has 30
measuring positions with four pixels (IFOV) each, leading to 120 pixels on each scan line (Figure 6).
Each pixel is about 12 km size at nadir. More information can be found in (EUMETSAT, 2017).
4.2 Data files content and organisation
Each file contains data from one full IASI dump (Svalbard to Svalbard). Each line contains 120 pixels.
Each orbit contains data acquired during the ascending and descending node for the satellite.
Everyday has about 14 orbits, which allows an almost complete coverage of the Earth twice a day
(Figure 8).
4.2.1 Time
The time of each line can be computed using the two variables SensingTime_day and
SensingTime_msec. For each line, these two variables provide respectively the sensing date (in days
since the 01/01/2000) and the sensing time in the sensing date (in milliseconds). An example of sensing
time computation code is presented in the Table 1. A variable SensingTime has been added giving the
time in milliseconds since the 1st of January 1970.
Table 1: Extraction of a python script computing the time for each line.
Compute the time:
timed = get_var(nc,'SensingTime_day',0)
times = get_var(nc,'SensingTime_msec',0)
td = np.array(timed)
ts = np.array(times)
r = datetime.timedelta(milliseconds=np.float(ts[index]))
ref = datetime.datetime(2000,1,1,0,0,0,0)+
datetime.timedelta(float(td[index]))+r
a) ascending node b) descending node c) entire orbit
d) ascending node e) descending node f) entire orbits
Figure 8: Example of the acquisition time (in hours) on the 1st of January 2008.
4.2.2 Geolocation and geometry
Geolocation and geometry information for each IASI pixel are available. Geolocation is stored in the
variables Latitude and Longitude while the geometry angles can be found in the four variables
SatAzimuth (Satellite Azimuth angle), SatZenith (Satellite Zenith angle), SunAzimuth (Solar Azimuth
angle) and SunZenith (Solar Zenith angle).
Page 16 of 38EUM/OPS/DOC/19/1085967
v3 e-signed, 22 January 2021
Product User Guide – IASI level2 TS, T,Q release 1
Solar zenith angle Solar azimuth angle Satellite zenith angle Satellite azimuth angle
Ascending node
Descending node
Figure 9: IASI-A solar and satellite zenith and azimuth angles for ascending and descending part of the orbit
for the 1st of January 2008.
4.2.3 Vertical grid
For each pixel, the pressure grid associated to the atmospheric profile products (temperature and
humidity) is stored in the variable P. The units is hPa. The variable contains the 137 pressure levels of
the grid. The 138th level stores the PWLR3 retrieval of the surface pressure used to build the 137 hybrid
levels of the pressure grid and is equivalent to the 2m values. The ECMWF L137 pressure grid is
described in (ECMWF, 2014).
The variable QP stores the uncertainty estimate of the surface pressure (in hPa).
4.3 Variables
The CDR contains “all-sky” retrievals of temperature and specific humidity profiles as well as the
surface temperature and the total column water vapour. Temperature and humidity associated quality
indicators are also part of the product (see 4.4.1).
4.3.1 Atmospheric Temperature
The atmospheric temperature retrieval is stored in the variable T. The variable contains the 137 levels
of the temperature profile, the last element (level 138) being the surface air temperature at 2 meters.
The unit is in Kelvin (K).
The atmospheric temperature retrieval is provided with an uncertainty estimate, representative of the
product precision in the lower troposphere, which is stored in the variable QT. The users can rely on
this indicator to tailor data selection for their applications, depending on their requirements. A
temperature retrieval with a quality indicator higher than 4 K is considered highly defective and is
rejected in the near-real time operational IASI L2 processing.
Page 17 of 38EUM/OPS/DOC/19/1085967
v3 e-signed, 22 January 2021
Product User Guide – IASI level2 TS, T,Q release 1
a) Atmospheric Temperature (level 90) b) Atmospheric Temperature Quality
Indicator
Figure 10: Example of daily maps of a) Atmospheric Temperature (level #90, see Figure 5a, about 400hPa) and
b) Quality Indicator of the Atmospheric Temperature [Metop-A 2008/01/01]
4.3.2 Atmospheric Water Vapour
The atmospheric water vapour retrieval is stored in the variable W. The variable contains the 137 levels
of the water vapour profile, the last element being the surface air water vapour content. The unit is
kg/kg.
Similarly to temperature, the atmospheric water vapour retrievals are provided with associated
uncertainty estimate, representative of the product precision in the lower troposphere, which is stored
in the variable QW. The uncertainties are expressed in dew point temperature, in Kelvin (K). This water
vapour uncertainty estimate can be used to select the retrievals with the quality required by the users
for their applications. A water vapour retrieval with a quality indicator higher than 12 K is considered
highly defective and is rejected in the near-real time operational IASI L2 processing.
The variable WC contains the water vapour total column. It corresponds to the integration of the 137
levels of the water vapour profile. It is provided in mm (which is equivalent to total column in kg/m2).
a) Atmospheric Humidity (level 90) b) Atmospheric Humidity Quality
Indicator
Figure 11: Example of daily maps of a) Atmospheric Humidity (level #90, see Figure 5a, about 400hPa) and b)
Quality Indicator of the Atmospheric Humidity [Metop-A 2008/01/01]
4.3.3 Surface Temperature
The surface temperature retrieval is stored in the variable Ts. The unit is Kelvin (K).
The surface temperature retrieval is provided with associated uncertainty estimate, which can be found
in the variable QTs. This temperature uncertainty estimate can be used to select the retrievals with the
quality required by the users for their applications. A surface temperature retrieval with a quality
Page 18 of 38EUM/OPS/DOC/19/1085967
v3 e-signed, 22 January 2021
Product User Guide – IASI level2 TS, T,Q release 1
indicator higher than 5 K is considered highly defective and is rejected in the near-real time operational
IASI L2 processing.
a) Surface Temperature b) Surface Temperature Quality
Indicator
Figure 12: Example of daily maps of a) Surface Temperature and b) Quality Indicator of the Surface
Temperature [Metop-A 2008/01/01]
4.4 Processing flags and quality information
Some additional variables providing information about the quality and the availability of the IASI L2
inputs and processing are available.
4.4.1 Uncertainty estimates
Each retrieved quantity is provided with a quality indicator (QI), which relates to corresponding
retrieval uncertainty estimates. It is stored in the variables QT, QW and QTs for atmospheric
temperature, atmospheric humidity and skin surface temperature, respectively.
Like the retrieved quantities themselves, the uncertainty estimates are also derived by regression from
the measurements. In the training phase, a first regression is performed between the satellite
observations and the geophysical quantities of the training set. A second regression is then performed
to infer the absolute difference between the training set and the retrieved geophysical quantities
resulting from the first training.
In the case of atmospheric profiles, the quality indicators reflects the average of the predicted
uncertainties at the surface air level and in the mid-troposphere. They are provided in K for temperature
and for humidity (dew Point). The quality indicator for surface temperature QTs provides a direct
uncertainty estimate of the surface skin temperature, in Kelvin. The full description of the QIs
calculation can be found in (EUMETSAT, 2020c), section 3.6.2.4.
Figure 13 illustrates the significance of the quality indicator for temperature profiles retrieved in the
IRON (left) and MWIR (right) modes as assessed against radiosondes. It also illustrates the yield in
both retrieval modes for different quality ranges: black (2 K) bar histograms. Better retrievals are usually achieved for cloud-free pixels.
A temperature retrieval with a quality indicator higher than 4 K is considered highly defective and is
rejected in the near-real time operational IASI L2 processing.
These statistics were obtained with the IASI L2 operational products and with IR-only retrievals
especially generated for the purpose of this sensitivity study (the present TCDR nominally exploits the
MWIR synergy). They were generated with the same algorithm version as used for this climate dataset.
Page 19 of 38EUM/OPS/DOC/19/1085967
v3 e-signed, 22 January 2021
Product User Guide – IASI level2 TS, T,Q release 1
The figure is meant as an information to the users of how to use the quality indicator in this IASI L2
TCDR in relation to the desired yield and precision range.
Figure 13: Temperature retrieval yield and precision in the IRON and MWIR modes stratified against the quality
indicator (uncertainty estimate), assessed through 2017 with radiosonde measurement pre-processed in the
NOAA Integrated Global Radiosonde Archive (IGRA). Solid lines are the bias and dash lines are the standard
deviations. The colours represent data for several QI T ranges.
4.4.2 FLG_IASIBAD
The flag flg_iasibad provides information about the availability and quality of the IASI L1C data. It is
described in the Table 2.
Table 2: FLG_IASIBAD Enumeration Key
Value Meaning
0 The IASI measurements and side information are available and of good quality for L2 processing
1 The IASI L1c products are of degraded quality according to IASI L1c flags, no L2 processing.
Quality control indicates that the IASI L1c data are of degraded quality (not indicated by the IASI
2
L1c flags), no L2 processing.
4.4.3 FLG_AMSUBAD
The flag flg_amsubad provides information about the availability and quality of the AMSU-A L1B
data. It is described in the Table 3.
Page 20 of 38EUM/OPS/DOC/19/1085967
v3 e-signed, 22 January 2021
Product User Guide – IASI level2 TS, T,Q release 1
Table 3: FLG_AMSUBAD Enumeration Key
Value Meaning
The expected AMSU-A measurements are available, of good quality and collocated with IASI for
0
processing.
AMSU-A data are available but of degraded quality (according to AMSU-A L1 flags or QC tests)
1
and not used for processing.
2 No coincident (time and space) AMSU-A measurements available for processing.
4.4.4 FLG_MHSBAD
The flag flg_mhsbad provides information about the availability and quality of the MHS L1B data. It is
described in the Table 4.
Table 4: FLG_MHSBAD Enumeration Key
Value Meaning
The expected MHS measurements are available, of good quality and collocated with IASI for
0
processing.
MHS data are available but of degraded quality (according to MHS L1 flags or QC tests) and not
1
used for processing.
2 No coincident (time and space) MHS measurements available for processing.
4.4.5 FLG_INITIA
The flag flg_initia indicates the measurements used in PWLR3 retrieval and hence the PWLR3 retrieval
mode that has been used for the processing of this pixel (see section 2.3). It is described in Table 5.
Most commonly used are Infra-Red Only (IRON), with bit 1 set to 1, translating to a 1 and Micro-Wave
Infra-Red (MWIR), with bits 1 to 3 set to 1, translating to a bit value of 7.
Table 5: Bitfield enumeration FLG_INITIA
Bit number and Value Meaning
0 (all Bits set to 0) Default value, no PWLR3 retrieval
Bit 1 = 1 IASI included
Bit 2 = 1 AMSU-A included
Bit 3 = 1 MHS included
Bit 4-8 Spare
4.4.6 OmC: Observation minus Calculation
The variable OmC provides the PWLR3 prediction of the IASI observation-calculation assuming clear-
sky in selected window channels (Figure 14a). This variable relates to the cloud signal and can be used
as a first order cloud filtering. Retrievals with an OmC value between -1 K and 1 K have a high
probability to be clear pixels. The full description of OmC calculation can be found in (EUMETSAT,
2020c) section 3.6.2.3.
Page 21 of 38EUM/OPS/DOC/19/1085967
v3 e-signed, 22 January 2021
Product User Guide – IASI level2 TS, T,Q release 1
4.5 Auxiliary information
Additional auxiliary information are provided and described in the following sections.
4.5.1 AVHRR L1B Cloud Fraction
The variable CloudFraction provides the cloud mask coming from the AVHRR L1B cloud mask
integrated within the IASI field of view. It is a direct copy from the information provided in the IASI
L1C products. It varies between 0% (clear) and 100% (fully cloudy).
4.5.2 Elevation
The variables Height and HeightStd respectively provide the mean and the standard deviation of the
elevation within the IASI field of view, in meters.
4.5.3 Land Fraction
The variable LandFraction provides the ratio of land surface in the IASI field of view. It varies between
0% (water only) and 100% (land only)
a) Obs minus Calc (OmC) b) AVHRR Cloud fraction
Figure 14: Example of daily maps of a) Observation minus Calculation and b) AVHRR Cloud fraction [Metop-
A 2008/01/01]
4.6 Period coverage
The data record covers the periods listed in Table 6Error! Reference source not found..
Table 6: Temporal coverage of the IASI L2 climate data record per satellite.
Satellite Start Date End Date
Metop-A – IASI 10.07.2007 31.12.2018
Metop-B – IASI 20.02.2013 31.12.2018
A detailed list of missing input data is available in the Appendix. Table 7 lists the number of days with
missing orbits per instruments.
Table 7: Number of days with missing orbits per satellite and instrument
Instrument Days with missing orbits
IASI – Metop-A 138
IASI – Metop-B 42
AMSU-A – Metop-A 47
AMSU-A – Metop-B 5
MHS – Metop-A 108
MHS – Metop-B 8
Page 22 of 38EUM/OPS/DOC/19/1085967
v3 e-signed, 22 January 2021
Product User Guide – IASI level2 TS, T,Q release 1
Figure 15 shows the average global surface temperature retrieved in MWIR mode per day (green dots)
for IASI on Metop-A from 2007 to end 2017. In addition, the percentage of missing data (no MWIR
nor IRON retrieval available) is given in red. Most of the time, data are not available when the IASI
instrument is performing maintenance activities (calibration, decontamination etc.). From the 26 of
March to 22 of May 2014, the PWLR3 had to run in IRON mode because of an outage of the MHS
instrument.
Figure 15: Example of a global IASI-A daily averaged surface temperature (K) in green. Red dots
represent the percentage of missing data for a specific day. Ts is obtained using PWRL3.
The daily averaged global profiles in MWIR mode over the entire period is shown in Figure 16 for
IASI-A and Figure 17 for IASI-B, displaying the temperature and humidity profiles respectively.
a) Profile of the global daily atmospheric temperature (in K)
b) Profile of the global daily atmospheric specific humidity (in g/kg)
Figure 16: Hovmoeller plots of IASI-A temperature and specific humidity profiles, global daily average over the
entire CDR range.
Page 23 of 38EUM/OPS/DOC/19/1085967
v3 e-signed, 22 January 2021
Product User Guide – IASI level2 TS, T,Q release 1
a) Profile of the global daily atmospheric temperature (in K)
b) Profile of the global daily atmospheric specific humidity (in g/kg)
Figure 17: Hovmoeller plots of IASI-B temperature and specific humidity profiles, global daily over the entire
CDR range
Page 24 of 38EUM/OPS/DOC/19/1085967
v3 e-signed, 22 January 2021
Product User Guide – IASI level2 TS, T,Q release 1
4.7 List of parameters available in the product
This section describes the files content.
4.7.1 Global attributes
Table 8: Global attributes of each file
Name Description
title IASI climate data record of temperature and humidity profiles
retrieved using the all sky PWLR3 algorithm.
creation_time File creation date as of yyyy-mm-ddThh:mm:ssZ
creator_email ops@eumetsat.int
creator_url www.eumetsat.int
id DOI: 10.15770/EUM_SEC_CLM_0027
institution EUMETSAT
source Observational satellite observation: IASI + AMSU-A and MHS as
input
history Release 1
references DOI: 10.15770/EUM_SEC_CLM_0027
summary This is the first release of the all-sky temperature and humidity
profiles climate data record and their associated quality parameters.
This data record was processed using the operational EUMETSAT
algorithm v6.5.4. It corresponds to the EARS-IASI L2 data. Each
file contains one full IASI orbit (Svalbard to Svalbard).
comment The input to the product is the IASI level 1C reprocessed product
(doi:10.15770/EUM_SEC_CLM_001) for IASI on Metop-A
(until January 2017) and the operational IASI level 1C product for
IASI on Metop-B and for Metop-A after January 2017.
Reprocessed and operational L1C inputs are homogeneous as
produced with the same software version.
instrument IASI
platform Metop-A (or Metop-B)
keywords IASI, level 2, profiles, temperature, specific humidity, atmospheric
water vapour, surface temperature, water-vapour total column
processing_level 2
processing_algorithm_version 6.5.4
product_version Release 1
sensing_start_time yyyy-mm-ddThh:mm:ssZ
sensing_stop_time yyyy-mm-ddThh:mm:ssZ
cdr_start_time 2007-07-10T07:23:58Z for Metop-A data
2013-02-20T03:56:55Z for Metop-B data
first date of Metop-A or –B reprocessed data
cdr_end_time 2018-12-31T23:24 :00Z Metop-A
2018-12-31T22:47 :55Z Metop-B
last date of Metop-A or –B reprocessed data
processing_mode R
disposition_mode O
no_scalines Number of scanline in the orbit
Conventions CF-1.9
Page 25 of 38EUM/OPS/DOC/19/1085967
v3 e-signed, 22 January 2021
Product User Guide – IASI level2 TS, T,Q release 1
4.7.2 Variables
There are 26 variables stored in the NetCDF file. They are listed in Table 9.
Table 9: Content of the CDR files. One file per orbit. nlin is the number of scan lines per orbit. Second dimension is the number of pixels per line and third dimension
is the number of vertical levels.
Variable short Description Dimension Long name Fill value Range Units
name
P Pressure grid [137 [nlin,120,138 Pressure 3.4028235e+ [0; 1150] hPa
atmospheric levels + surface ] 38
pressure]
Ps Surface pressure [nlin,120] Surface Pressure 3.4028235e+ [0; 1150] hPa
38
Ts Surface temperature [nlin,120] Surface 3.4028235e+ [100;400] K
temperature 38
(FG_SURFACE_TEMPE
RAURE)
T Temperature profile [137 [nlin,120,138 Temperature 3.4028235e+ [100;400] K
atmospheric levels + surface ] profile 38
air (2m)] (FG_ATMOSPHERIC_T
EMPERATURE)
WC Water-vapour total column [nlin,120] Total column water 3.4028235e+ [0;300] mm
vapour 38 (corresponds
(FG_ to kg/m2)
INTEGRATED_WATER_
VAPOUR)
W Atmospheric water-vapour [nlin,120,138 Atmospheric water 3.4028235e+ [0,1] kg/kg
profile [137 atmospheric ] vapour profile 38
levels + surface air (2m)] (FG_ATMOSPHERIC_W
ATER_VAPOUR)
QP Quality indicator for [nlin,120] Quality indicator 3.4028235e+ [0,1000] hPa
surface pressure for the surface 38
(~uncertainties in hPa) pressure
Page 26 of 38EUM/OPS/DOC/19/1085967
v3 e-signed, 22 January 2021
Product User Guide – IASI level2 TS, T,Q release 1
Variable short Description Dimension Long name Fill value Range Units
name
QTs Quality indicator for skin [nlin,120] Quality indicator 3.4028235e+ [0;400] K
surface temperature for surface 38
(~uncertainties in K) temperature
(FG_QI_SURFACE_TE
MPERATURE)
QT Quality indicator for [nlin,120] Quality indicator 3.4028235e+ [0;400] K
temperature (~uncertainty for temperature 38
estimates of surface air (FG_QI_ATMOSPHERI
temperature in K) C_TEMPERATURE)
QW Quality indicator for water- [nlin,120] Quality indicator 3.4028235e+ [0,300] K
vapour (~uncertainty for water vapour 38
estimates of surface air (FG_QI_ATMOSPHERI
water-vapour, for humidity C_WATER_VAPOUR)
expressed in Dew point
temperature )
FLG_IASIBAD Availability and quality of [nlin,120] IASI quality flag 3.4028235e+ [0;2] N/A
IASI L1 measurements 38
0=The IASI measurements and
side information are
available and of good
quality for L2 processing
1=The IASI L1c products are
of degraded quality
according to IASI L1c flags,
no L2 processing
2=Quality control indicates
that the IASI L1c data are
of degraded quality (not
indicated by the IASI L1c
flags), no L2 processing
FLG_AMSUBAD 0=The expected AMSU-A [nlin,30] AMSU-A quality 3.4028235e+ [0;2] N/A
measurements are available, flag 38
of good quality and
Page 27 of 38EUM/OPS/DOC/19/1085967
v3 e-signed, 22 January 2021
Product User Guide – IASI level2 TS, T,Q release 1
Variable short Description Dimension Long name Fill value Range Units
name
collocated with IASI for
processing
1=AMSU-A data are available
but of degraded quality
(according to AMSU-A L1
flags or QC tests) and not
used for processing
2=No coincident (time and
space) AMSU-A measurements
available for processing
FLG_MHSBAD 0=The expected MHS [nlin,120] MHS quality flag 3.4028235e+ [0;2] N/A
measurements are available, 38
of good quality and
collocated with IASI for
processing.
1=MHS data are available but
of degraded quality
(according to MHS L1 flags
or QC tests) and not used for
processing
2=No coincident (time and
space) MHS measurements
available for processing
FLG_INITIA Bit field indicates the [nlin] Measurement used 3.4028235e+ [0; 7] N/A
measurements used in the for FG retrieval 38
PWLR3 retrieval.
0 (all Bits set to 0) =
Default value, no PWLR3
retrieval
Bit 1 = 1 IASI included
Bit 2 = 1 AMSU-A included
Bit 3 = 1 MHS included
OmC Cloud signal (radiative [nlin,120] OBS minus CALC 3.4028235e+ [-200; 100] K
impact of cloud). Predicted parameter 38
Page 28 of 38EUM/OPS/DOC/19/1085967
v3 e-signed, 22 January 2021
Product User Guide – IASI level2 TS, T,Q release 1
Variable short Description Dimension Long name Fill value Range Units
name
OBS-CALC assuming clear-sky
[K] averaged over a few
selected window channel
Latitude Latitude of the pixel centre [nlin,120] Latitude 3.4028235e+ [-90; 90] degrees
38 N>0
Longitude Longitude of the pixel [nlin,120] Longitude 3.4028235e+ [-180; 180] degrees
centre 38 E>0
SatAzimuth Satellite azimuth angle [nlin,120] Satellite azimuth 3.4028235e+ [0; 360] degrees
angle 38
SatZenith Satellite zenith angle [nlin,120] Satellite zenith 3.4028235e+ [0; 90] degrees
angle 38
SunAzimuth Solar azimuth angle [nlin,120] Solar azimuth 3.4028235e+ [0; 360] degrees
angle 38
SunZenith Solar zenith angle [nlin,120] Solar zenith 3.4028235e+ [0; 180] degrees
angle 38
SensingTime_day Sensing date, day since 01 [nlin] Sensing date in 3.4028235e+ [2747; day since
January 2000 days since 1st 38 6939] 1/1/2000
January 2000
SensingTime_msec Sensing time in milliseconds [nlin] Sensing time in 3.4028235e+ [0; milliseconds
in the sensing date milliseconds in 38 8,64e+7]
the sensing date
SensingTime Sensing time in milliseconds [nlin] Sensing time of 3.4028235e+ [189388800 milliseconds
since the 1st of January 2000 the scanline in 38 000;
milliseconds 6311520000
since 1st January 00]
2000
Height average surface elevation [nlin,120] Surface elevation 3.4028235e+ [0; 10000] meters
within the field of view (SURFACE_Z) 38
HeightStd stddev of the elevation [nlin*120] Standard 3.4028235e+ [0,10000] meters
within the field of view deviation of the 38
surface elevation
(STD_SURFACE_Z)
Page 29 of 38EUM/OPS/DOC/19/1085967
v3 e-signed, 22 January 2021
Product User Guide – IASI level2 TS, T,Q release 1
Variable short Description Dimension Long name Fill value Range Units
name
LandFraction land fraction as computed [nlin,120] Land fraction 3.4028235e+ [0; 100] %
with AVHRR collocated data 38
(copied across from IASI
L1C)
CloudFraction integrated cloud fraction [nlin,120] AVHRR cloud 3.4028235e+ [0; 100] %
from AVHRR fraction 38
Page 30 of 38EUM/OPS/DOC/19/1085967
v3 e-signed, 22 January 2021
Product User Guide – IASI level2 TS, T,Q release 1
4.8 Data and file name format description
Reprocessed files can be identified by their filenames for which the processing mode is set to R. A
reprocessed IASI level 2 filename follows the convention:
Table 10: IASI filename description
Convention _________
Product IASI_PW3_02_M02_20160130110852Z_20160130124756Z_R_O_20180216145847Z_01
name 00.nc
4.9 Product generated
The reprocessing was done by EUMETSAT, using IASI L2 PPF version 6.5.4.
4.10 Format
The data record is produced and archived in NetCDF format.
Page 31 of 38EUM/OPS/DOC/19/1085967
v3 e-signed, 22 January 2021
Product User Guide – IASI level2 TS, T,Q release 1
5 Product validation summary
The present IASI L2 CDR (Release-1) consists of IASI-A and -B temperature and humidity profiles
and surface parameters reprocessed for the period July 2007 to December 2018. The reprocessing was
done using the IASI Level-2 PPF version 6.5.4. The IASI L1c data, used as input for this CDR, are
homogeneous throughout the entire period as IASI L1c are retrieved using the same software version
(IASI-A L1c for the earlier period until January 2017).
The three main purposes of the reprocessing of the level-2 IASI temperature and humidity profiles are
to provide a dataset to the user community:
- of suitable quality for scientific studies;
- using the best and most up-to-date version of the operational algorithm;
- homogeneous and consistent throughout the time series.
This report demonstrates that both points were achieved. Comparison to radiosonde measurements pre-
processed in the NOAA/IGRA project and ERA-Interim reanalysis outputs have been used to analyse
the quality of the IASI temperature and humidity profiles.
The temperature and humidity profiles retrieved using IASI flying on board Metop-A (IASI-A) and
Metop-B (IASI-B) show very similar performance when compared to other measurements and
reanalysis outputs. However, systematic deviations between IASI-A and -B appear mainly for
ascending nodes over land and for cloudy situations. The cause for this difference is not fully
understood, and it requires further study before the next reprocessing.
The precision of global averaged temperature profiles lies within 1 K for most of the troposphere, which
is consistent with the requirements expressed in the EUMETSAT polar system end-users requirements
document (EUMETSAT, 2017). Near the surface, the precision is slightly less, because of the reduced
sensitivity and vertical resolution inherent to passive infrared sounding, especially when the thermal
contrast between atmospheric layers and surface is low.
The precision of the humidity profiles in the lower troposphere typically varies between 1 to 1.5 g/kg
depending on the actual moisture content and with seasonal and regional variations. The bias towards
radiosondes shows negative values of up to 0.25 g/kg near the surface, turning to a same magnitude
positive bias in the mid troposphere. The absolute errors are smaller in drier atmospheres, and vice
versa. Best retrievals are usually achieved for cloud-free pixels, but the joint use of IASI with
microwave observations enables useful retrievals in most cloudy scenes as well. A small bias of up to
a few tenth of Kelvin is possible outside of the training period of the retrieval algorithm (2015 and
2016).
The profile retrievals are supplied with quality indicators, representative of the products uncertainty
estimates in the lower troposphere, which can be used for quality control and data selection depending
on the yield and precision required by the user’s applications.
The validation against radiosondes shows in particular:
• A long-term and very stable agreement with the IGRA data;
• Only minor seasonal differences;
Page 32 of 38You can also read