Gene-Based Association Tests Using GWAS Summary Statistics and Incorporating eQTL
←
→
Page content transcription
If your browser does not render page correctly, please read the page content below

Gene-Based Association Tests Using GWAS Summary Statistics and Incorporating eQTL Xuewei Cao Michigan Technological University Xuexia Wang University of North Texas Shuanglin Zhang Michigan Technological University Qiuying Sha ( qsha@mtu.edu ) Michigan Technological University Research Article Keywords: extended Simes procedure, Gaussian copula approximation, eQTL - derived weights, GWAS summary statistics, gene-based association study Posted Date: June 17th, 2021 DOI: https://doi.org/10.21203/rs.3.rs-611304/v1 License: This work is licensed under a Creative Commons Attribution 4.0 International License. Read Full License
Gene-based Association Tests Using GWAS Summary Statistics and
 Incorporating eQTL

 Xuewei Cao1, Xuexia Wang2, Shuanglin Zhang1, Qiuying Sha1,*

1
 Department of Mathematical Sciences, Michigan Technological University, Houghton,
Michigan, USA
2
 Department of Mathematics, University of North Texas, Denton, Texas, USA
*
 Corresponding author: QIUYING SHA, Department of Mathematical Sciences,
Michigan Technological University, Houghton, Michigan 49931, USA. E-mail:
qsha@mtu.edu
Abstract

Although genome-wide association studies (GWAS) have been successfully applied to
a variety of complex diseases and identified many genetic variants underlying complex
diseases, there is still a considerable heritability of complex diseases that could not be
explained by GWAS. One alternative approach to overcome the missing heritability
caused by the genetic heterogeneity is gene-based analysis, which considers the
aggregate effects of multiple genetic variants in a single test. Another alternative
approach is transcriptome-wide association study (TWAS). TWAS aggregates genomic
information into functionally relevant units that map to genes and their expression.
TWAS is not only powerful, but can also increase the interpretability in biological
mechanisms of identified trait associated genes. In this study, we propose two powerful
and computationally efficient gene-based association tests, Overall and Copula. These
two tests aggregate information from three traditional types of gene-based association
tests and also incorporate expression quantitative trait locus (eQTL) data into GWAS
using GWAS summary statistics. Overall utilizes the extended Simes procedure and
Copula utilizes the Gaussian copula approximation-based method. We show that after
a small number of replications to estimate the correlation among the integrated gene-
based tests, the P values of these two methods can be calculated analytically.
Simulation studies show that these two tests can control type I error rate very well and
have higher power than the tests that we compared. We also apply these two methods
to two schizophrenia GWAS summary datasets and two lipids GWAS summary
datasets. The results show that these two newly developed methods can identify more
significant genes than other methods we compared with.

Keywords: extended Simes procedure; Gaussian copula approximation; eQTL -
derived weights; GWAS summary statistics; gene-based association study
Introduction

Although genome-wide association studies (GWAS) have successfully identified
thousands of single nucleotide polymorphisms (SNPs) associated with a wide range of
complex human traits1,2, there is a common limitation in which GWAS focus on only a
single genetic variant with a trait at a time. This limitation may limit the power to identify
clinically or biologically significant genetic associations3. Furthermore, many genome-
wide significant genetic variants are in linkage disequilibrium (LD). Different LD patterns
can cause non-replication results of the same variant in different populations4,5.
Therefore, several powerful gene-based statistical association tests, in which the
genetic information is combined using all genetic variants in a gene to obtain more
informative results, have been developed6, such as the Burden Test (BT)7, the
Sequence Kernel Association Test (SKAT)8, and the Optimized SKAT (SKATO)9.

 When individual-level genotype and phenotype data are not available, the
traditional gene-based association tests, BT, SKAT, and SKATO, can be extended by
using GWAS summary statistics10. Currently, there are many GWAS summary
statistics available in public resources11. In GWAS summary statistics, the Z-scores of
genetic variants in a gene are assumed to asymptotically follow a multivariate normal
distribution with a correlation matrix among all genetic variants in a gene under the null
hypothesis12, where the correlation matrix can be estimated by LD among the genetic
variants in the gene13,14. When individual-level data are not available, LD is usually
estimated using external reference panels15,16 (i.e., 1000 Genomes Project17). Due to
the small sample size of reference panels used to estimate LD, statistical noise (i.e.,
inflated type I error rates or large numbers of false positives) often exists which needs
to be accounted for18,19. One way to reduce the statistical noise is to correct the
estimated LD by a regularization procedure20. In the regularization procedure, a
statistical white Gaussian noise is added to the LD matrix which is estimated by a
reference panel. After correcting the estimated LD by the regularization procedure, we
can assume that, under the null hypothesis, the Z-scores from GWAS summary
statistics asymptotically follow a multivariate normal distribution with the correlation
matrix being the corrected LD matrix among the genetic variants in a gene.
To increase statistical power to identify genes that are associated with complex
diseases, PrediXcan21 and transcriptome-wide association study13,22 (TWAS) were
developed by incorporating expression quantitative trait locus (eQTL) data into GWAS.
As pointed out by Zhang et al.16, PrediXcan and TWAS can be viewed as a simple
weighted linear combination of genetic variants with an eQTL - derived weight. In fact,
the genetic architecture of complex traits is rarely known in advance and is likely to vary
from one region to another across the genome and from one trait to another16.
Therefore, only considering one single eQTL - derived weight, such as in PrediXcan and
TWAS, may lose statistical power in identifying significant genes. Zhang et al.16
developed an omnibus test (OT) using Cauchy combination method to integrate
association evidence obtained by BT, SKAT, and SKATO based on GWAS summary
data with multiple eQTL‐derived weights. They showed that OT using multiple eQTL -
derived weights had some potential advantages.
 Inspired by the advantage of OT, in this paper, we propose two powerful and
computationally efficient methods, Overall and Copula, to aggregate the information
from three traditional types of gene-based association tests (BT, SKAT, SKATO) with
multiple eQTL - derived weights using GWAS summary statistics. To combine
information from the three gene-based association tests, the Overall method utilizes
the extended Simes procedure5,23 and the Copula method utilizes the Gaussian copula
approximation-based method24,25. To apply these two methods, it is necessary to
estimate the correlation matrix among the three gene-based association tests with
eQTL - derived weights under the null hypothesis. We provide an estimation method
using a replication procedure. The replication procedure only needs to be used once to
obtain the correlation matrix for each gene. Then, the p-values of these two methods
can be analytically computed without using permutations. In these two methods, the
LD structure among all genetic variants within a gene can be estimated using the
regularization procedure10,20. To calculate the p-values of the three types of gene-
based association tests (BT, SKAT, SKATO) using GWAS summary statistics with
eQTL - derived weights, we use the “sumFREGAT” package in R (https://cran.r-
project.org/web/packages/sumFREGAT/index.html)10. Once we obtain the p-values of
these three tests, the p-values of our proposed two methods, Overall and Copula, can
be easily calculated using their theoretical distributions. The extensive simulation studies show that these two methods can control type I error rates well and have higher power than the comparison methods across most of the simulation settings. Similar to Zhang et al.16, we apply these two methods to two schizophrenia (SCZ) and two lipids trait (HDL) GWAS summary data sets. Compared with OT, the proposed two methods can identify more significant genes, and some significant genes reported by GWAS catalog are only identified by our proposed methods. Statistical Models and Methods Statistical Models Consider a set of M genetic variants in a gene. Let Z Z1 , , Z M be an M 1 vector T of Z-scores of the genetic variants. Note that Z-score Z m is either directly provided by publicly available GWAS summary statistics or calculated from a GWAS individual- level genotype and phenotype data set. We are interested in testing the null hypothesis H 0 that none of the genetic variants in the gene is associated with a trait, whereas the alternative hypothesis is that at least one genetic variant in the gene is associated with a trait. Under the null hypothesis, Z Z1 , , Z M MVN 0, R , T where R is the correlation matrix among Z , which can be estimated by LD among the genetic variants in the gene13,14. If individual-level data are not available, LD can be estimated using external reference panels (i.e., 1000 Genomes Project17). However, if the sample size of a reference panel is small, LD may not be estimated correctly that will induce statistical noise (i.e., inflated type I error rates or large numbers of false positives)18,19. One way to correct the estimated LD is to use a regularization procedure by adding a statistical white Gaussian noise10,20. Let I M be an M M identity matrix, and the corrected correlation matrix U can be defined as U aR 1 a I M , 0 a 1,
where a is a scalar tuning parameter which represents the coefficient of proportionality between the corrected correlation matrix U and the original R estimated using an external reference panel. The optimal tuning parameter a can be estimated by maximizing the log-likelihood function of the distribution of Z MVN 0, U . That is, aˆ arg max log L Z : 0,U , a0,1 ˆ aˆR 1 aˆ I . Therefore, under the null then the corrected correlation matrix U M hypothesis, we consider Z Z1 , , ZM T ˆ . MVN 0, U Suppose that there are a total of K different eQTL - derived weights from gene expression data (i.e., Genotype-Tissue Expression (GTEx) project ˆ diag Wˆ k , (https://gtexportal.org/home/)), denoted as Wk 1 , WˆMk for k 0,1, , K , ˆ diag 1, where W ,1 represents a status without using any weight. In order to avoid 0 the influence of the scale among genetic variants within each weight, we first standardize the eQTL - derived weights Wk as Wmk Wˆmk Wˆmk for m 1, M m 1 ,M . Based on the standardized weights, the overall weighted Z-score also follows a multivariate normal distribution for the k th weight. That is, Wk Z ˆ , Σ MVN 0, Σ k ˆ W UW k k ˆ . k We extend the three types of gene-based association tests, BT7, SKAT8, and SKATO9, to incorporate the eQTL - derived weights based on GWAS summary statistics10,26. For the k th eQTL - derived weight, the three gene-based test statistics can be written as Z T Wk 1M , k 2 QBT Wk Z Wk Z , k T QSKAT k QSKATO min 1 QSKAT k QBT k , 0,1 where 1M is an M 1 vector with elements of all 1s. Under the null hypothesis, QBT k
follows a 2 distribution with 1 degree of freedom; QSKAT k follows a weighted sum of 2 k distributions with 1 degree of freedom; and QSKATO follows a mixture of 2 distribution which can be used to calculate p-value analytically with high accuracy in the tail9. The p-values of these three test statistics can be easily calculated using the “sumFREGAT” package in R (https://cran.r-project.org/web/packages/sumFREGAT/index.html)10. Methods To aggregate information from these three gene-based association tests with multiple eQTL - derived weights, we develop two novel methods, Overall and Copula. Overall utilizes the extended Simes procedure5,23 and Copula utilizes the Gaussian copula approximation-based method24,25. Overall Method k k k Let pBT , pSKAT , pSKATO be the p-values of BT, SKAT, SKATO with k th eQTL - derived weight for k 0,1, , K , respectively, where k 0 denotes a status without using any weight. Thus, there are a total of L 3 K 1 p-values from these three gene-based association tests with different weights. Let p1 , , p L be a sequence of the ascending p-values, where p1 min k 0, , K p k BT k , pSKAT k , pSKATO and p L max pBT k k , pSKAT k , pSKATO . The Overall method combines these L p-values using k 0, , K the extended Simes procedure5,23, and the overall p-value is defined as me pl poverall Min , l 1, , L mel where me is the effective number of p-values among the L gene-based association tests with multiple weights, pl is the l th element of the ascending p-values, and mel is
the effective number of p-values among the top l association tests. We use a more robust measure to obtain the effective numbers me and mel , which was proposed by Li et al.5. The values of mel and me can be estimated as l mel l i 1 I i 1 and me me L , i 1 where i denotes the i th eigenvalue of the correlation matrix Ω of p-values from L association tests with multiple weights (the estimation of Ω will be discussed in the later section), I is an indicator function. If the L association tests are independent, all eigenvalues i equal 1, and me l l for l 1, , L ; if the L association tests are perfectly dependent, then 1 l which is the number of tests used to calculate mel and the other eigenvalues equal 0. So in this case, me l l l 1 1 for l 1, , L . Copula Method Given the p-values from the L gene-based association tests, the most common method to combine the information among these p-values is the minimum p-value (minP) method that selects the most significant p-value27. In the Copula method, we use the smallest p-value among the L association tests as a test statistic, TCopula min k 0, , K p k BT k , pSKAT k , pSKATO , k k k where pBT , pSKAT , pSKATO are the p-values of BT, SKAT, SKATO with the k th eQTL - derived weight for k 0,1, , K , respectively. The p-value of TCopula is usually estimated by the Monte Carlo (MC) simulation which is computationally intensive28. Instead of using MC simulation, we use the Gaussian copula approximation to estimate the p- value25. Under the null hypothesis, the p-values follow the uniform distribution between 0 k and 1, so their inverse-normal transformed values qBT qnorm 1 pBT k ,
k qSKAT qnorm 1 pSKAT k , and qSKATO k qnorm 1 pSKATO k for k 0,1, , K follow the standard normal distributions. We apply a Gaussian copula approximation24 for the k joint distribution of qBT k , qSKAT k , and qSKATO for k 0,1, , K . That is, the joint distribution k of all inverse-normal transformed q-values, qBT k , qSKAT k , and qSKATO for k 0,1, , K , is asymptotically a multivariate normal distribution with mean 0 and variance-covariance matrix Ω1 . We will discuss how to estimate Ω1 under the null hypothesis later. Therefore, the p-value of TCopula can be calculated as pCopula 1 Φ L 1 1 TCopula 1L ; Ω1 , where Φ L indicates the joint distribution function of a multivariate normal distribution, 1 is the inverse CDF of the standard normal distribution, and 1L is an L 1 vector with elements of all 1s. In practice, the Gaussian copula approximation method has been applied to aggregate information from different gene-based association tests and it showed a good performance24,25. Estimation of Ω and Ω1 under the null hypothesis To apply our proposed two methods, Overall and Copula, we need to estimate the correlation matrix of p-values Ω and the correlation matrix of inverse-normal transformed q-values Ω1 under the null hypothesis. Since the exact correlations among all L gene-based association tests are unknown, we perform the estimation procedure with B replications. For each replicate b , b 1, , B , we implement the following three steps: Step 1: We first generate a new Z-score vector Z null under the null hypothesis. That is, Z null follows a multivariate normal distribution with mean 0 and variance- covariance matrix R , where R can be estimated by LD among the genetic variants in a gene using external reference panels (i.e., 1000 Genomes Project).
Step 2: We use the regularization procedure to obtain the corrected correlation matrix k b k b k b of Z-scores Û . Then, we calculate QBT , QSKAT , QSKATO and the corresponding p- k b k b k b values pBT , pSKAT , pSKATO using the simulated Z null for k 0,1, , K . The distributions of QBT , QSKAT k b k b k b , QSKATO depend on the corrected correlation matrix Û , and the standardized eQTL - derived weights Wk for k 0,1, , K . Step 3: We calculate the inverse-normal transformed q-values of three gene-based k b association tests, qBT k b qnorm 1 pBT k b , qSKAT k b qnorm 1 pSKAT , and k b qSKATO k b qnorm 1 pSKATO for k 0,1, ,K . To estimate the correlation matrix of p-values Ω used in the Overall method, we use the sample correlation matrix of the p-values obtained from the replications. We denote the sample correlation matrix of p-values as Ω̂ . For example, ̂12 is the (1,2)- element of Ω̂ which is the estimated correlation between BT and SKAT without using T pBT , , pBT be a B 1 vector of the p-values of BT 0 01 0 B any weight. If we let pBT T 01 pSKAT be a B 1 vector of the p-values 0 0 B without using any weight and pSKAT , , pSKAT of SKAT without using any weight obtained from the replications, then the sample ˆ cor p0 , p0 , correlation of p-values between these two tests is defined as 12 BT SKAT where cor is the sample correlation. Similarly, we can use the sample correlation matrix of the q-values, Ω̂1 , obtained from the permutation procedure to estimate the correlation matrix of q-values Ω1 . The estimation procedure to estimate Ω and Ω1 is independent of our proposed methods, Overall and Copula, therefore we only need to perform this procedure once for each gene. Since the p-values of these two methods can be computed analytically without using permutation, the two developed methods, Overall and Copula, are computationally efficient.
Simulation Studies Materials and Comparison Methods In our studies, we use four data sets to obtain the eQTL - derived weights downloaded from the functional summary-based imputation website (http://gusevlab.org/projects/fusion/#reference-functionaldata). The resources to obtain the four eQTL - derived weights are listed in Table 1. For each eQTL data set, we use the weights estimated by the Best Linear Unbiased Prediction (BLUP)29. We compare our proposed methods with OT16 that uses the Cauchy combination method to integrate association evidence obtained by BT, SKAT, and SKATO. OT is also based on GWAS summary data and incorporates multiple eQTL‐ derived weights. The Number of Replications in Estimation of Ω and Ω1 To apply our proposed two methods, Overall and Copula, we first need to estimate the correlation matrix of p-values, Ω , and the correlation matrix of the inverse-normal transformed q-values, Ω1 , under the null hypothesis for each gene. Following the estimation procedure introduced in the method section, we generate Z-scores instead of generating individual-level genotype and phenotype data. To determine the number of replications needed in the estimation of Ω and Ω1 , we consider ten genes which contain different number of SNPs and have different LD structures (Table S1). We simulate a Z-score vector from a multivariate normal distribution with mean 0 and variance-covariance matrix R , Z MVN 0, R , where R is the LD matrix of each gene which can be estimated using the 1000 Genome project (ftp://ftp.1000genomes.ebi.ac.uk/vol1/ftp/). First, we use B 104 replications to estimate Ω and Ω1 under the null hypothesis, where the estimated matrices are denoted by Ω̂ and Ω̂1 , respectively. Then, we denote Ω̂0 and Ω̂10 as the correlation
matrix of p-values and the correlation matrix of q-values estimated by using B0 replications, respectively. We vary the value of B0 from 16 to 5,000, and test the null hypothesis that the two correlation matrices, Ω̂0 and Ω̂ for p-values ( Ω̂10 and Ω̂1 for q- values), are the same by using “lavaan” package (https://CRAN.R- project.org/package=lavaan)30. Figures S1-S2 show that the p-values of the hypothesis testing for each gene are greater than 0.05 after B0 1,000 replications. Therefore, we only need to use 1,000 replications to obtain Ω̂ and Ω̂1 , for each gene under the null hypothesis. Consequently, 1,000 replications are used in the following sessions to evaluate the type I error rates and powers of Overall and Copula. Type I error rate To evaluate if our proposed methods, Overall and Copula, can control type I error rates, we consider 23 genetic variants in gene AGTRAP (chr1:11736084-11754802; see Figure S3 for the LD block structure of these 23 genetic variants). We generate Z- score vectors under the null hypothesis, Z MVN 0, R , where R is the LD matrix of gene AGTRAP which is estimated using the 1000 Genome project. Then, we use the regularization procedure to obtain the corrected correlation matrix of Z-scores Û , and calculate the three types of gene-based association tests, BT, SKAT, and SKAT-O, with or without the four eQTL - derived weights (NTR, YFS, METSIM, CMC) based on the corrected correlation matrix Û . Finally, we apply our proposed Overall method to combine the p-value using the estimated correlation matrix of p-values, Ω̂ , with 1,000 replications. We also apply our proposed Copula method using the estimated correlation of inverse-normal transformed q-values, Ω̂1 . Figure S4 shows that the estimated correlation matrices Ω̂ and Ω̂1 for gene AGTRAP, respectively. In this paper, we use 107 replications that can reach a Bonferroni corrected significance level 1.75 106 to obtain the empirical type I error rates (i.e., for 28,625 genes in the real data analysis section, the Bonferroni corrected significance level is
0.05 28625 1.75 106 at 5% significance level). Table 2 shows the estimated type I error rates for different significant levels and different methods. From this table, we can see that our proposed methods, Overall and Copula, and the three traditional types of gene-based association tests with or without eQTL - derived weights can control type I error rates very well under various nominal significance levels 5 102 , 1102 , 1103 , 1104 , 1105 , and 1.75 106 . Power Comparison To evaluate the performance of our proposed two methods, Overall and Copula, we use several simulations to compare the performance of these two methods with OT and three types of gene-based association tests with or without eQTL - derived weights. Following the simulation settings in Nagpal et al.31 and Zhang et al.16, the genotype data are generated based on a protein-coding gene C3orf22 (chr3: 126,524,439- 126,558,965; see Figure S3 for the LD block structure). We generate individual-level genotypes, phenotypes, and different expression levels using the following steps: (1) The genotype data are generated using the haplotypes of gene C3orf22 obtained from the 1000 Genomes Project reference panel. This data set contains 295 haplotypes for 42 variants (18 common variants and 24 rare variants with the rare variant threshold 0.05; the minor allele frequency (MAF) ranging from 0 to 0.43558). To generate the genotype of an individual, X g , we select two haplotypes according to the haplotype frequencies from the haplotype pool and then remove genetic variants with MAF
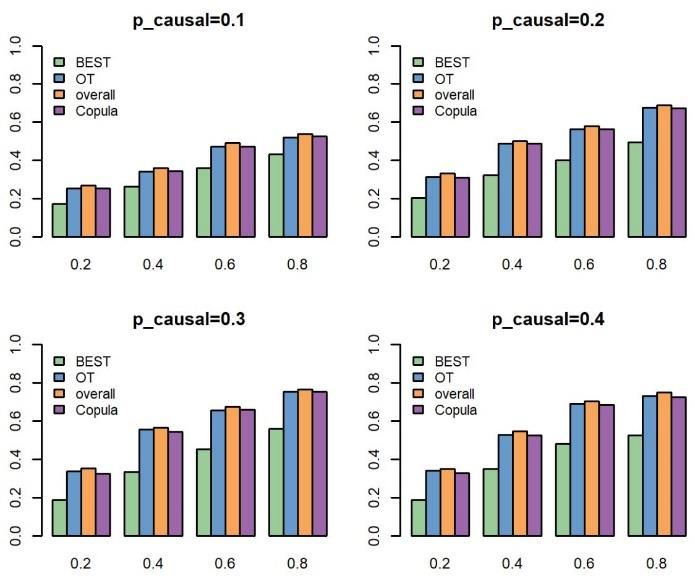
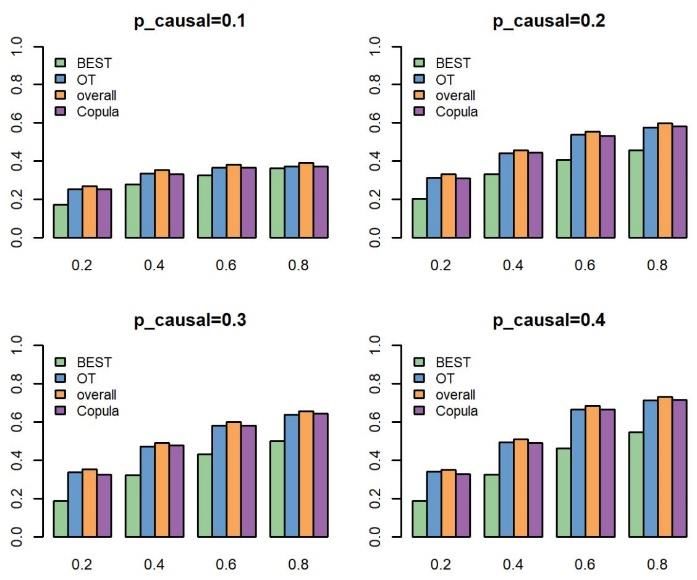
wmk 0 . After we rescaled the weights to ensure the targeted expression heritability he2 , we generate the k th gene expression level by Ek X g wk εe with each element of εe follows N 0,1 he2 . (3) Let E E1 , , E K be the matrix of gene expression levels. Phenotypes are generated by using a formula Y Eβ ε p with each element of ε p follows N 0,1 hp2 , where β 1 , , K is a vector of genetic effect sizes which can T be assigned based on the phenotypic heritability h p2 . (4) The Z-score vector is estimated from individual-level genotype and phenotype data using the ordinary least squares regression. In our simulation studies, we consider K 4 different gene expression levels. To compare the performance of our proposed methods with the OT method and the traditional three types of gene-based association tests with or without eQTL - derived weights, we vary the proportion of causal variants with values pcausal 0.1, 0.2, 0.3, 0.4 and consider two different directions of genetic effects: 1 2 3 4 (Scenario 1: Uni-directional effects) and 1 2 3 4 (Scenario 2: Bi-directional effects). For each simulation scenario, we also vary the proportion of gene expression heritability and the phenotypic heritability with different values of he2 and h p2 . We consider the sample size to be 2,000 and the power is calculated as the proportion of 1,000 replications with p-value 1.75 106 . Figure 1 shows the results of power comparisons based on gene C3orf22 under the Uni-directional effects ( 1 2 3 4 ) with pcausal 0.1, 0.2, 0.3, 0.4 . We consider the following two settings. First, we vary phenotypic heritability h p2 with a fixed expression heritability he2 0.2 (Figure 1(a)). We compare the power of Overall, Copula, OT, and BEST, where BEST represents the maximum power of the three traditional
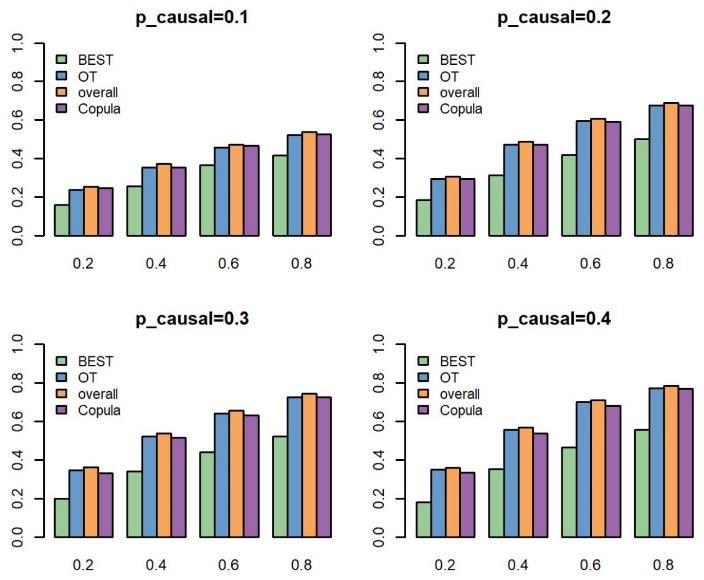
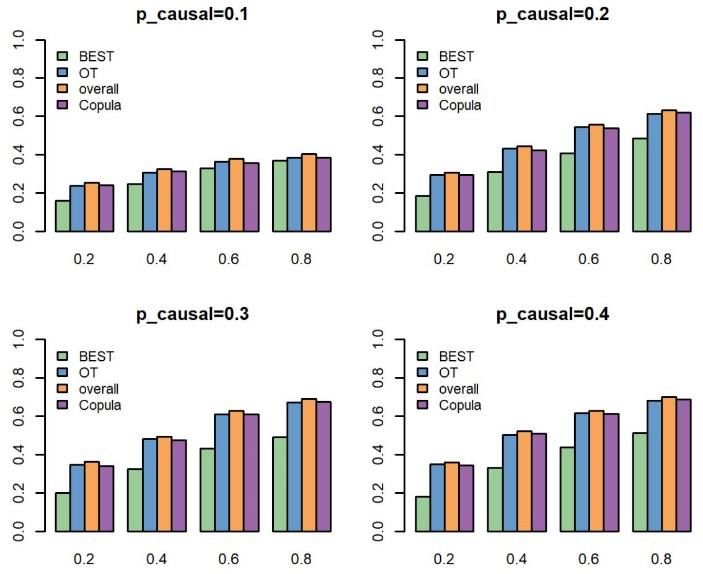
gene-based association tests, BT, SKAT, and SKATO with and without an eQTL - derived weight. From Figure 1(a), we can see that our proposed two methods, Overall and Copula, perform better than BEST. In particular, Overall performs uniformly best than the other three methods; Copula has a similar performance with OT and has a higher power than OT when the proportion of causal variants is small ( pcausal 0.1 and 2 0.2 ). Second, we vary the expression heritability he with a fixed phenotypic heritability hp2 0.2 (Figure 1(b)). Figure 1(b) shows that Overall still has the highest power and performs the best in all cases we considered; Copula has comparable power with OT; and BEST is the least powerful test. Figure 2 shows the results of power comparisons based on gene C3orf22 under the Bi-directional effects ( 1 2 3 4 ) with pcausal 0.1, 0.2, 0.3, 0.4 . In Figure 2, we also consider two simulation settings, power against the phenotypic heritability h p2 with a fixed expression heritability he2 0.2 and power against the expression heritability he2 with a fixed phenotypic heritability hp2 0.2 . The pattern of the power is the same as what we observe in Figure 1. Overall performs the best in all settings. Copula and OT have similar performance and have higher power than BEST. We also generate genotype data based on gene AGTRAP which contains 458 haplotypes for 23 variants (11 common variants and 12 rare variants with the rare variant threshold 0.05; the minor allele frequency (MAF) ranging from 0 to 0.39775). Figures S5-S6 show the results of power comparisons under the Uni-directional effects and under the Bi-directional effects with pcausal 0.2, 0.3, 0.4, 0.5 , respectively. The patterns of power comparisons are similar to those of Figures 1-2. Real Data Analysis To evaluate the performance of our proposed methods in the real data analysis, we use the same GWAS summary statistics data sets as in Zhang et al.16: two SCZ GWAS summary data sets and two lipid GWAS summary data sets. Due to the outperformance of the OT method proposed by Zhang et al.16 compared with the three types of gene-based association tests with or without different eQTL – derived weights,
we aim to evaluate if our proposed two methods, Overall and Copula, perform better
than the OT method and also the traditional tests regardless of the use of any eQTL -
derived weights. We estimate the LD between genetic variants using the 1000
Genomes Project reference panel17, and obtain the corrected matrix of Z-score after
the regularization procedure. We consider the same four eQTL - derived weights
estimated by the BLUP method using the resources listed in Table 1 (NTR, YFS,
METSIM, CMC). All of the traditional gene-based association tests (BT, SKAT,
SKATO) with or without these weights can be easily obtained using the “sumFREGAT”
package in R.

Application to the SCZ GWAS summary data

We consider two SCZ GWAS summary data sets, SCZ1 and SCZ2, which can be
downloaded from the Psychiatric Genomics Consortium website
(https://www.med.unc.edu/pgc/results‐and‐downloads/)32. SCZ1 is a meta-analysis of
SCZ GWAS data set with 13,833 cases and 18,310 controls. SCZ2 is a more recent
and larger SCZ GWAS summary data set with 36,989 cases and 113,075 controls for
partial validation33. In our real data analysis, we define a gene to include all of the
SNPs from 20 kb upstream to 20 kb downstream of the gene and test the association
between each gene and the trait using BT, SKAT, and SKATO with and without eQTL -
derived weights, Overall, Copula, and OT. We consider all genes according to the
GENCODE version 35 (GRCh37) human comprehensive gene annotation list which
can be downloaded from the GENCODE website
(https://www.gencodegenes.org/human/release_35lift37.html).

 To make fair comparisons among all these weighted tests, the genetic variants
are removed if there is at least one weight missing in the four eQTL - derived weights.
After pruning, there are 28,660 genes in SCZ1 and 17,823 genes in SCZ2 in our final
analyses. Therefore, the Bonferroni corrected significance level for gene-based
association analysis is defined as 0.05 over the number of genes. First, we apply BT,
SKAT, and SKATO with and without an eQTL - derived weight, OT, Overall, and Copula
to the SCZ1 and SCZ2 data sets. To obtain the p-values of our proposed two methods,
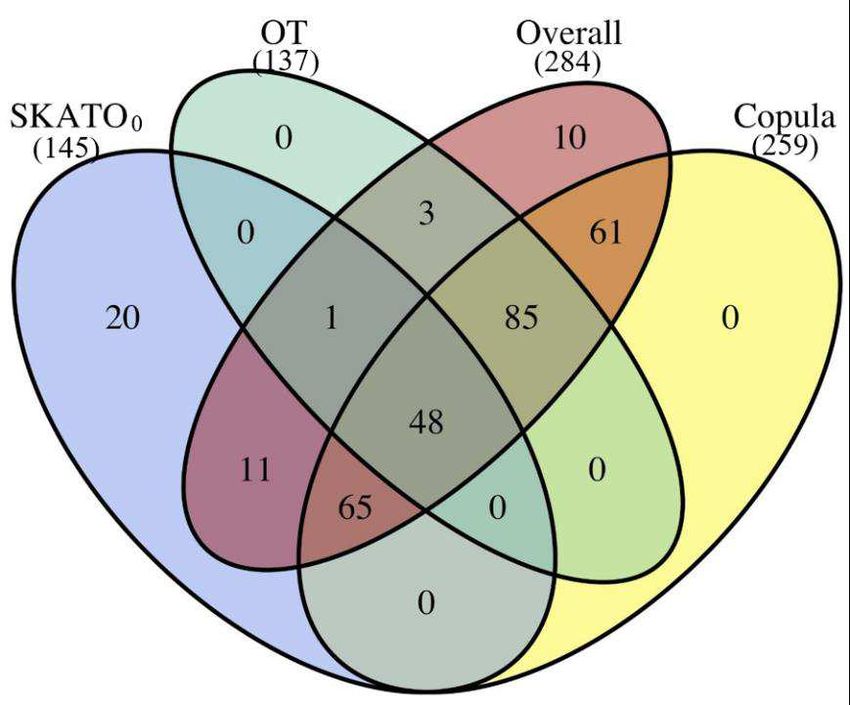
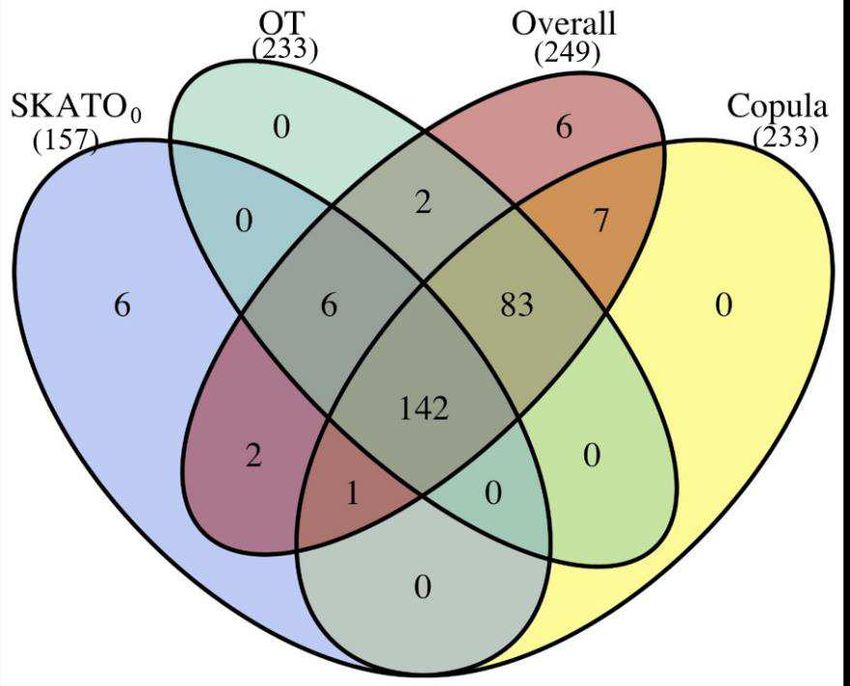
Overall and Copula, we use 1,000 replications to estimate the correlation matrices of p- values and q-values for each gene. Table 4 (SCZ1 and SCZ2) shows the number of significant genes identified by each method for the SCZ data sets, respectively. As we can see in Table 4, Overall can identify more significant genes than other methods for two SCZ GWAS summary data sets. Among the three types of gene-based association tests, BT, SKAT, and SKATO, with or without different eQTL – derived weights, SKATO0 identify the most significant genes. Therefore, in Figures 3 and 4, we only show the number of significant genes identified by Overall, Copula, OT, and SKATO0. Figure 3 shows the comparison of these four tests for SCZ1 data set. The number below each method indicates the total number of significant genes identified by the corresponding method. Figure 3 shows that our proposed two methods can identify more significant genes than OT and SKATO0. Overall identifies all of the genes identified by OT and Copula. Meanwhile, 65 significant genes are identified by Overall, Copula, and SKATO0, but are not identified by OT; 11 genes are only identified by Overall and SKOTO0. 71 novel genes are only identified by our proposed two methods and 48 genes are identified by all of these four methods. For the SCZ2 data set, the number of significant genes identified by each method is shown in Table 4 and Figure 4. Figure 4 shows that Overall identifies the most significant genes; significant genes identified by Copula are also identified by Overall; genes identified by OT are identified by Overall, except two genes. Meanwhile, 11 significant genes identified by Overall, Copula, and SKATO0 are not identified by OT; 24 novel genes are only identified by Overall and Copula; and 304 genes are identified by all of these methods. We further investigate the novel genes only identified by Overall and Copula for the SCZ data sets by searching the GWAS catalog (https://www.ebi.ac.uk/gwas/). Among the 71 novel genes for the SCZ1 data set, there were 10 genes reported in the GWAS catalog; among the 24 novel genes for the SCZ2 data set, there were six genes reported in the GWAS catalog (Table 3). In Figure 3 and Figure 4, Overall uniquely identify 10 genes in the SCZ1 data set and 14 genes in the SCZ2 data set. Among these 24 genes, six genes (ZBED4, AL669918.1, YPEL1, LINC00606, ERLIN1, AC024597.1) have been reported by Goes et al.34 and Lam et al.35 (Bold-face in Table 3). Furthermore, we search for genome-wide significant SNPs ( p 5 108 ) from the
two SCZ GWAS summary data sets and consider the genes covering at least one
genome-wide significant SNP from 20 kb upstream to 20 kb downstream of the gene.
There are 63 genome-wide significant genes in SCZ1, and 2422 genes in SCZ2. Table
4 (GWASSCZ1 and GWASSCZ2) summarizes the numbers of genome-wide significant
genes identified by each method for the two SCZ data sets. Overall and Copula identify
16 out of 63 genome-wide significant genes for the SCZ1 data set; OT only identify 6
genes and SKATO0 identify 15 genes. Meanwhile, among 2422 genes in SCZ2, Overall
identifies 167 genome-wide significant genes; OT identifies 166 genes; Copula identifies
161 genes; and SKATO0 identifies 153 genes.

Application to the lipids GWAS summary data

We consider two lipids GWAS summary data sets, HDL1 and HDL2, which can be
downloaded at the Center for Statistical Genetics (CSG) at the University of Michigan.
HDL1 is a meta-analysis of HDL GWAS data set with about 100,000 samples
downloaded at the website (http://csg.sph.umich.edu/willer/public/lipids2010/)36. HDL2 is
the follow-up data with about 189,000 samples for partial validation downloaded at the
Global Lipids Genetics Consortium (http://csg.sph.umich.edu/willer/public/lipids2013/)37.
In the analysis, we define a gene to include all of the SNPs from 20 kb upstream to 20
kb downstream of the gene, and there are 17,389 genes in HDL1 and 16,917 genes in
HDL2 remained after pruning and removing the genetic variants with missing weights.
Therefore, we use the same Bonferroni corrected significance level for gene-based
association analysis as in the analyses of the SCZ GWAS summary data. We apply
three traditional gene-based association tests, BT, SKAT, and SKATO with and without
eQTL - derived weights, Overall, Copula, and OT to the HDL1 and HDL2 data sets.
Also, we use 1,000 replications to estimate Ω̂ and Ω̂1 for each gene. Table 6 (HDL1

and HDL2) shows the number of significant genes identified by each method for the two
lipids data sets, respectively. As we can see from Table 6, among the three traditional
gene-based association tests with and without eQTL - derived weights, SKATO0
identifies the most significant genes in HDL1 and BT0 identifies the most significant
genes in HDL2. Therefore, in Figures 5 and 6, we only compare the significant genes
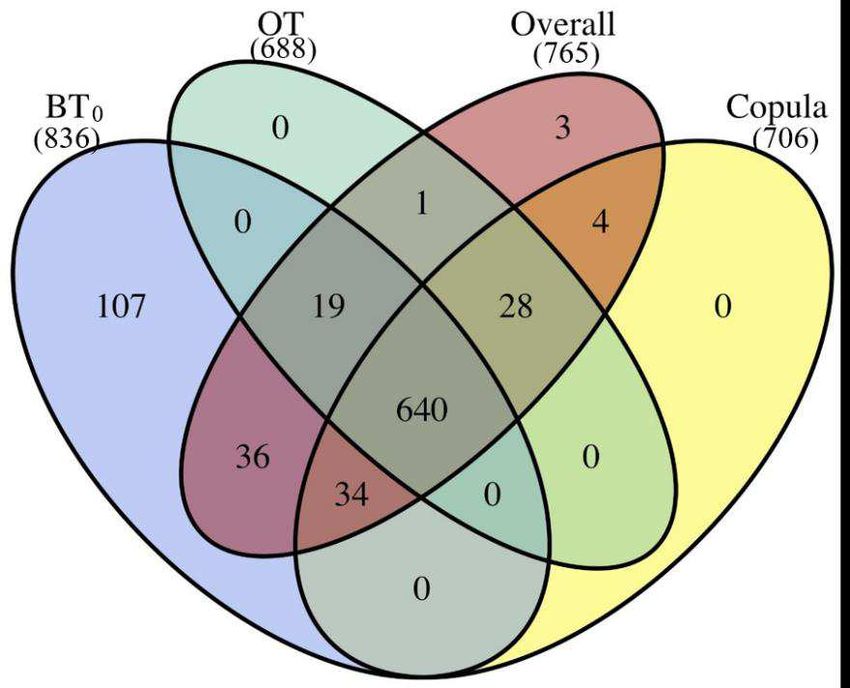
identified by SKATO0 and BT0 along with Overall, Copula, and OT, respectively. Figure 5 shows the number of significant genes identified by each of the methods for HDL1 data set. Again, we observe that Overall identifies the most significant genes; all genes are identified by Copula and OT are also identified by Overall; Meanwhile, two genes identified by Overall but not identified by OT were identified by SKATO0; there are 13 novel genes only identified by our proposed two methods and 142 genes identified by all of these four methods. For the HDL2 data set, the number of significant genes identified by each method is shown in Figure 6. All significant genes identified by OT and Copula are also identified by Overall. Meanwhile, there are 36 genes identified by Overall but not identified by OT were identified by BT0; 7 genes are only identified by our proposed two methods and 640 genes are identified by all of these four methods. To ensure that the novel genes only identified by our proposed methods are significant, we search the GWAS catalog (https://www.ebi.ac.uk/gwas/). Five out of 13 novel genes based on HDL1 data set have been reported, and one out of 7 novel genes has been reported on HDL2 data set (Table 5). Figure 5 and Figure 6 show that the Overall method uniquely identifies six genes and three genes in HDL1 and HDL2 data set, respectively. There are three genes (AFF1, NHLRC2, AC106779.1) that have been reported by some researchers38-47 (Bold-face in Table 4). Same as the analyses for the SCZ GWAS summary data, we search for genome-wide significant SNPs ( p 5 108 ) from two lipids GWAS summary statistics and consider the genes covering at least one genome-wide significant SNP from 20 kb upstream to 20 kb downstream of the gene. There are 1,911 genome-wide significant genes for HDL1, and 2,682 genes for HDL2. Table 6 (GWASHDL1 and GWASHDL2) summarizes the numbers of significant genome-wide significant genes identified by each method for the two lipids data sets. We can see that among three traditional gene-based association tests, BT, SKAT, and SKATO, with and without an eQTL - derived weight, SKATO0 identifies the most significant genes; among the three methods using four eQTL – derived weights, Overall, Copula, and OT, Overall identifies 122 genes, OT identifies 120 genes, and Copula identifies 118 genes for HDL1 data set; the number of genes identified by any of these methods, Overall, Copula, and OT, are more than the number of genes identified by the three traditional
gene-based association tests without using eQTL – derived weights or using one eQTL
– derived weight. For HDL1 data set, Overall identifies 192 significant genes, OT and
SKATO0 identify 190 significant genes, and Copula identifies 185 significant genes.

Discussions

In this paper, we develop two powerful and computationally efficient methods, Overall
and Copula, for gene-based association studies using only GWAS summary data.
These two methods aggregate information from three traditional types of gene-based
association tests (BT, SKAT, SKATO) and also incorporate eQTL data. Both our
simulation studies and real data analysis confirm that our proposed two methods can
control type I error rate correctly and have very good performance compared with other
methods. In real data analysis, the proposed two methods identify more significant
genes than other methods, and there are some genes reported by GWAS catalog
which are only identified by our proposed methods.

 There are some advantages of our proposed two methods. First, these two
methods adaptively aggregate information from multiple gene-based association tests.
Most combination tests (i.e., Fisher’s combination test48) assume that the p-values
should be calculated from independent tests. To combine information from highly
correlated gene-based association tests, Overall utilizes the extended Simes
procedure5,23 and Copula utilizes the Gaussian copula approximation-based
method24,25. It is shown that these procedures to combine multiple tests are stable and
effective regardless of whether the tests are highly correlated25,49. Second, Overall and
Copula are more powerful than the traditional gene-based association tests and some
other combination tests (i.e., ominous test16). By aggregating information from different
tests and incorporating multiple eQTL - derived weights, Overall and Copula can
achieve a higher statistical power under a variety of situation setups. Meanwhile, our
simulation studies and real data analyses show that the extended Simes procedure
and Gaussian copula approximation-based method are more powerful than the
Cauchy combination, especially if the proportion of causal variants in a gene is small.
Third, the p-values of these two methods can be analytically compute without using
permutations, so the two proposed methods are more computationally efficient than
permutation. The estimation procedure of the correlation matrices is separated from
the association tests, so we only need to use 1,000 replications once for each gene to
obtain these matrices. Finally, by using the regularization procedure to correct the LD
can reduce the potential statistical noise in the LD estimation if LD is estimated using a
small sample size of a reference panel. In addition, these two methods can be easily
applied to genetic association studies with either individual-level data or GWAS
summary statistics. In this paper, we combine three traditional types of gene-based
association tests (BT, SKAT, SKATO). However, the combination procedure use in the
paper is very general, other gene-based association tests can also be combined using
the same approach.

CONFLICT OF INTERESTS
The authors declare that there is no conflict of interests.

AUTHOR CONTRIBUTION
Formal analysis: Xuewei Cao; Methodology: Xuewei Cao, Shanglin Zhang, Xuexia
Wang, and Qiuying Sha; Data curation: Xuewei Cao and Xuexia Wang; Visualization:
Xuewei Cao; Writing original draft: Xuewei Cao, Xuexia Wang, and Qiuying Sha; Writing
review and editing: Xuewei Cao, Shuanglin Zhang, Xuexia Wang, and Qiuying Sha.

DATA AVAILABILITY
The data that support the findings of this study are publically available and the links to
the data are provided in the article.

ACKNOWLEDGE
Xuexia Wang was supported by the University of North Texas Foundation which was
contributed by Dr. Linda Truitt Creagh
Table 1. Resources of the four eQTL - derived weights used in the simulation studies.

 Study Tissue # of Samples Reference
 NTR Peripheral blood 1247 Wright et al.50
 YFS Whole blood 1264 Gusev et al.13
 METSIM Adipose 563 Gusev et al.13
 CMC Brain 452 Gusev et al.13
Table 2. Estimated type I error rates at different significance levels with 107 replications. The subscript denotes BT, SKAT, and SKATO using eQTL - derived weights; CMC, METSIM, NTR, and YFS indicate the resources to obtain the eQTL - derived weights. 0 indicates the methods without using eQTL – derived weights. − Level 5 102 1 102 1 103 1 104 1 105 1.75 106 BT0 5.03 102 1.06 102 1.00 103 1.01 104 9.76 106 1.84 106 SKAT0 5.24 102 1.07 102 1.01 103 1.00 104 1.04 105 1.80 106 SKATO0 4.58 102 9.57 103 1.02 103 1.04 104 9.72 106 1.46 106 BTCMC 5.17 102 1.04 102 1.01 103 9.82 105 9.58 106 1.72 106 SKATCMC 5.08 102 9.89 103 9.71 104 9.75 105 9.48 106 1.66 106 SKATOCMC 5.16 102 1.09 102 1.17 103 1.21 104 1.22 105 2.14 106 BTMETSIM 5.02 102 1.03 102 1.02 103 1.01 104 9.86 106 1.66 106 SKATMETSIM 5.30 102 1.08 102 1.02 103 9.91 105 1.00 105 2.12 106 SKATOMETSIM 4.84 102 1.05 102 1.11 103 1.09 104 1.06 105 1.84 106 BTNTR 5.02 102 1.06 102 1.00 103 9.93 105 1.01 105 1.76 106 SKATNTR 5.09 102 1.03 102 9.98 104 1.00 104 1.01 105 2.00 106 SKATONTR 5.08 102 1.18 102 1.34 103 1.45 104 1.52 105 2.92 106 BTYFS 5.10 102 1.02 102 9.95 104 9.95 105 1.05 105 2.10 106 SKATYFS 4.98 102 1.03 102 9.97 104 1.01 104 1.02 105 2.06 106 SKATOYFS 5.58 102 1.32 102 1.43 103 1.55 104 1.69 105 3.50 106 OT 5.75 102 1.17 102 1.16 103 1.14 104 1.22 105 2.12 106 Overall 4.67 102 1.01 102 1.12 103 1.14 104 1.24 105 2.44 106 Copula 4.73 102 8.28 103 6.35 104 6.27 105 7.80 106 1.80 106
Table 3. Reported significant genes only identified by Overall and Copula based on the
two SCZ data sets.

 Gene Data Overall Copula Reference
 SLC7A6 SCZ1 1.35E-14 3.05E-14 Ikeda et al.51; Li et al.52
 Goes et al.34; Ikeda et al.51; Li et
 CNNM2 SCZ1 1.15E-13 1.47E-13
 al.52; Ripke et al.53; Lam et al.35
 Schizophrenia Working Group of
 the Psychiatric Genomics
 Consortium33; Goes et al.34; Ikeda et
 al.51; Li et al.52; Lam et al.35;
 AP001931.2 SCZ1 1.58E-13 2.70E-13 Periyasamy et al.54; Lee et al.55; The
 Autism Spectrum Disorders
 Working Group of the Psychiatric
 Genomics Consortium56; Pardiñas
 et al.57
 ITIH1 SCZ1 5.50E-13 8.52E-13 Sleiman et al.58 ; Lam et al.59
 The Autism Spectrum Disorders
 TWF2 SCZ1 7.05E-12 6.94E-12 Working Group of the Psychiatric
 Genomics Consortium56
 Schizophrenia Working Group of
 the Psychiatric Genomics
 PRRG2 SCZ1 3.28E-09 6.75E-09
 Consortium33; Goes et al.34; Ikeda et
 al.51; Li et al.52; Periyasamy et al.54
 Schizophrenia Working Group of
 the Psychiatric Genomics
 NOSIP SCZ1 2.00E-08 6.95E-08
 Consortium33; Goes et al.34; Ikeda et
 al.51; Li et al.52; Periyasamy et al.54
 Lam et al.9; Ikeda et al.51; Li et al.52;
 Ripke et al.53; Lam et al.35;
 BORCS7- Periyasamy et al.54; Lee et al.55; Yu
 SCZ1 2.18E-08 3.93E-08
 ASMT et al.60; Cross-Disorder Group of the
 Psychiatric Genomics Consortium61;
 Wu et al.62
 MARK2 SCZ1 3.97E-07 8.08E-07 Goes et al.34
 ZBED4 SCZ1 9.02E-07 1.96E-06 Goes et al.34
 RAB11FIP5 SCZ2 1.05E-06 1.70E-06 Goes et al.34; Lam et al.59
 AL669918.1 SCZ2 2.03E-06 3.05E-06 Goes et al.34
 YPEL1 SCZ2 2.80E-06 4.48E-06 Goes et al.34
 LINC00606 SCZ2 2.57E-06 8.94E-06 Goes et al.34
 ERLIN1 SCZ2 2.34E-06 6.33E-06 Goes et al.34
 AC024597.1 SCZ2 2.56E-06 5.36E-06 Lam et al.35

 Notes: Bold-faced genes indicate that the genes are uniquely identified by Overall;
 otherwise, the genes are identified by both Overall and Copula.
Table 4. The numbers of significant genes identified by each method for the two SCZ
data sets. The subscript denotes BT, SKAT, and SKATO using eQTL - derived weights;
CMC, METSIM, NTR, and YFS indicate the resources to obtain the eQTL - derived
weights. 0 indicates the methods without using any weights.

 SCZ1 SCZ2 GWASSCZ1 GWASSCZ2
 BT0 103 166 1 38
 SKAT0 47 305 15 153
 SKATO0 145 394 15 153
 BTCMC 44 137 1 56
 SKATCMC 10 225 1 134
 SKATOCMC 30 263 1 130
 BTMETSIM 46 136 1 48
 SKATMETSIM 23 223 4 132
 SKATOMETSIM 33 205 0 100
 BTNTR 55 119 6 48
 SKATNTR 27 230 8 141
 SKATONTR 45 280 6 143
 BTYFS 93 166 1 53
 SKATYFS 20 223 7 137
 SKATOYFS 48 321 0 140
 OT 137 522 6 166
 Overall 284 559 16 167
 Copula 259 500 16 161

 Notes: SCZ1 indicates the number of significant genes identified by each method for
 SCZ1 data; SCZ2 indicates the number of significant genes identified by each
 method for SCZ2 data; GWASSCZ1 indicates the number of significant genes
 identified by each method in the SCZ1 data; GWASSCZ2 indicates the number of
 significant genes identified by each method in the SCZ2 data.
Table 5. Reported significant genes only identified by Overall and Copula based on the
two lipids data sets.

 Gene Data Overall Copula Reference
 AP002954.1 HDL1 2.37E-11 2.18E-11 Emilsson et al.63
 Lettre et al.53, Kilpeläinen et
 EDC4 HDL1 3.20E-11 1.31E-10
 al.64, Wojcik et al.65
 PACSIN1 HDL1 2.47E-06 4.28E-06 Liu et al.66
 Spracklen et al.38, De Vries et
 AFF1 HDL1 2.54E-06 4.53E-06 al.39, Hoffmann et al.40, Ripatti et
 al.41, Richardson et al.42
 AC106779.1 HDL1 2.85E-06 5.52E-06 Noordam et al.46
 Hoffmann et al.40, Richardson et
 NHLRC2 HDL2 2.03E-06 3.78E-06 al.42, Klarin et al.43, Qi et al.44,
 Klimentidis et al.45, Liu et al.47

 Notes: Bold-faced genes indicate that the genes are uniquely identified by Overall;
 otherwise, the genes are identified by both Overall and Copula.
Table 6. The number of significant genes identified by each method for the two lipids
data sets. The subscript denotes BT, SKAT, and SKATO using eQTL - derived weights;
CMC, METSIM, NTR, and YFS indicate the resources to obtain the eQTL - derived
weights. 0 indicates the methods without using any weights.

 HDL1 HDL2 GWASHDL1 GWASHDL2
 BT0 95 836 50 185
 SKAT0 116 174 99 157
 SKATO0 157 762 104 190
 BTCMC 79 130 46 107
 SKATCMC 105 159 95 146
 SKATOCMC 130 177 96 150
 BTMETSIM 83 160 58 111
 SKATMETSIM 120 259 102 149
 SKATOMETSIM 131 199 98 152
 BTNTR 78 136 49 111
 SKATNTR 105 156 90 148
 SKATONTR 131 183 95 154
 BTYFS 88 154 53 113
 SKATYFS 106 148 94 137
 SKATOYFS 142 185 99 144
 OT 233 688 120 190
 Overall 249 765 122 192
 Copula 233 706 118 185

 Notes: HDL1 indicates the number of significant genes identified by each method for
 HDL1 data; HDL2 indicates the number of significant genes identified by each
 method for HDL2 data; GWASHDL1 indicates the number of significant genes
 identified by each method in the HDL1 data; GWASHDL2 indicates the number of
 significant genes identified by each method in the HDL2 data.
Figure 1. Power comparisons of gene-based association tests at 1.75 106 significance level under uni-directional effects ( 1 2 3 4 ) with pcausal 0.1, 0.2, 0.3, 0.4 based on gene C3orf22. (a) Estimated power against phenotypic heritability h p2 with fixed expression heritability he2 0.2 ; (b) Estimated power against expression heritability he2 with fixed phenotypic heritability hp2 0.2 . BEST indicates the maximum power among the three traditional gene-based association tests with and without eQTL - derived weights. Scenario 1: Uni-directional effects (a) he2 0.2 and hp2 0.2, 0.4, 0.6, 0.8 (b) h p2 0.2 and he2 0.2, 0.4, 0.6, 0.8
Figure 2. Power comparisons of gene-based association tests at 1.75 106 significance level under bi-directional effects ( 1 2 3 4 ) with pcausal 0.1, 0.2, 0.3, 0.4 based on gene C3orf22. (a) Estimated power against phenotypic heritability h p2 with expression heritability he2 0.2 ; (b) Estimated power against expression heritability he2 with phenotypic heritability hp2 0.2 . BEST indicates the maximum power among the three traditional gene-based association tests with and without eQTL - derived weights. Scenario 2: Bi-directional effects (a) he2 0.2 and hp2 0.2, 0.4, 0.6, 0.8 (b) h p2 0.2 and he2 0.2, 0.4, 0.6, 0.8
Figure 3. Venn diagram of the number of significant genes identified by SKATO0, OT,
Overall, and Copula for SCZ1 data. The number below each of the methods indicates
the total number of significant genes identified by the corresponding method.
Figure 4. Venn diagram of the number of significant genes identified by SKATO0, OT,
Overall, and Copula for SCZ2 data. The number below each of the methods indicates
the total number of significant genes identified by the corresponding method.
Figure 5. Venn diagram of the number of significant genes identified by SKATO0, OT,
Overall, and Copula for HDL1 data. The number below each of the methods indicates
the total number of significant genes identified by the corresponding method.
Figure 6. Venn diagram of the number of significant genes identified by BT0, OT,
Overall, and Copula for HDL2 data. The number below each of the methods indicates
the total number of significant genes identified by the corresponding method.
References

1 Fine, R. S., Pers, T. H., Amariuta, T., Raychaudhuri, S. & Hirschhorn, J. N.
 Benchmarker: an unbiased, association-data-driven strategy to evaluate gene
 prioritization algorithms. The American Journal of Human Genetics (2019).
2 Li, R. et al. A regression framework to uncover pleiotropy in large-scale electronic health
 record data. Journal of the American Medical Informatics Association 26, 1083-1090
 (2019).
3 Hebbring, S. J. The challenges, advantages and future of phenome‐wide association
 studies. Immunology 141, 157-165 (2014).
4 Kraft, P., Zeggini, E. & Ioannidis, J. P. Replication in genome-wide association studies.
 Statistical science: a review journal of the Institute of Mathematical Statistics 24, 561
 (2009).
5 Li, M.-X., Gui, H.-S., Kwan, J. S. & Sham, P. C. GATES: a rapid and powerful gene-
 based association test using extended Simes procedure. The American Journal of
 Human Genetics 88, 283-293 (2011).
6 Buil, A. et al. in BMC proceedings. S130 (Springer).
7 Li, B. & Leal, S. M. Methods for detecting associations with rare variants for common
 diseases: application to analysis of sequence data. The American Journal of Human
 Genetics 83, 311-321 (2008).
8 Wu, M. C. et al. Rare-variant association testing for sequencing data with the sequence
 kernel association test. The American Journal of Human Genetics 89, 82-93 (2011).
9 Lee, S., Wu, M. C. & Lin, X. Optimal tests for rare variant effects in sequencing
 association studies. Biostatistics 13, 762-775 (2012).
10 Svishcheva, G. R., Belonogova, N. M., Zorkoltseva, I. V., Kirichenko, A. V. & Axenovich,
 T. I. Gene-based association tests using GWAS summary statistics. Bioinformatics 35,
 3701-3708 (2019).
11 Pasaniuc, B. & Price, A. L. Dissecting the genetics of complex traits using summary
 association statistics. Nature Reviews Genetics 18, 117-127 (2017).
12 Conneely, K. N. & Boehnke, M. So many correlated tests, so little time! Rapid
 adjustment of P values for multiple correlated tests. The American Journal of Human
 Genetics 81, 1158-1168 (2007).
13 Gusev, A. et al. Integrative approaches for large-scale transcriptome-wide association
 studies. Nature genetics 48, 245-252 (2016).
14 Kwak, I.-Y. & Pan, W. Adaptive gene-and pathway-trait association testing with GWAS
 summary statistics. Bioinformatics 32, 1178-1184 (2016).
15 de Leeuw, C. A., Mooij, J. M., Heskes, T. & Posthuma, D. MAGMA: generalized gene-
 set analysis of GWAS data. PLoS Comput Biol 11, e1004219 (2015).
16 Zhang, J., Xie, S., Gonzales, S., Liu, J. & Wang, X. A fast and powerful eQTL weighted
 method to detect genes associated with complex trait using GWAS summary data.
 Genetic Epidemiology (2020).
17 Consortium, G. P. A global reference for human genetic variation. Nature 526, 68-74
 (2015).
18 Deng, Y. & Pan, W. Improved use of small reference panels for conditional and joint
 analysis with GWAS summary statistics. Genetics 209, 401-408 (2018).
19 Shi, H., Kichaev, G. & Pasaniuc, B. Contrasting the genetic architecture of 30 complex
 traits from summary association data. The American Journal of Human Genetics 99,
 139-153 (2016).
20 Pasaniuc, B. et al. Fast and accurate imputation of summary statistics enhances
 evidence of functional enrichment. Bioinformatics 30, 2906-2914 (2014).
21 Gamazon, E. R. et al. A gene-based association method for mapping traits using
 reference transcriptome data. Nature genetics 47, 1091 (2015).
22 Xu, Z., Wu, C., Wei, P. & Pan, W. A powerful framework for integrating eQTL and GWAS
 summary data. Genetics 207, 893-902 (2017).
23 Van der Sluis, S., Posthuma, D. & Dolan, C. V. TATES: efficient multivariate genotype-
 phenotype analysis for genome-wide association studies. PLoS Genet 9, e1003235
 (2013).
24 Sun, R. & Lin, X. Set-based tests for genetic association using the generalized Berk-
 Jones statistic. arXiv preprint arXiv:1710.02469 (2017).
25 Wu, C. Multi-trait genome-wide analyses of the brain imaging phenotypes in UK
 Biobank. BioRxiv, 758326 (2020).
26 Lee, S., Teslovich, T. M., Boehnke, M. & Lin, X. General framework for meta-analysis of
 rare variants in sequencing association studies. The American Journal of Human
 Genetics 93, 42-53 (2013).
27 Kim, J., Bai, Y. & Pan, W. An adaptive association test for multiple phenotypes with
 GWAS summary statistics. Genetic epidemiology 39, 651-663 (2015).
28 Pan, W., Kim, J., Zhang, Y., Shen, X. & Wei, P. A powerful and adaptive association test
 for rare variants. Genetics 197, 1081-1095 (2014).
29 Hogg, R. V., Tanis, E. A. & Zimmerman, D. L. Probability and statistical inference. Vol.
 993 (Macmillan New York, 1977).
30 Rosseel, Y. Lavaan: An R package for structural equation modeling and more. Version
 0.5–12 (BETA). Journal of statistical software 48, 1-36 (2012).
31 Nagpal, S. et al. TIGAR: an improved Bayesian tool for transcriptomic data imputation
 enhances gene mapping of complex traits. The American Journal of Human Genetics
 105, 258-266 (2019).
32 Ripke, S. et al. Genome-wide association analysis identifies 13 new risk loci for
 schizophrenia. Nature genetics 45, 1150 (2013).
33 Consortium, S. W. G. o. t. P. G. Biological insights from 108 schizophrenia-associated
 genetic loci. Nature 511, 421-427 (2014).
34 Goes, F. S. et al. Genome‐wide association study of schizophrenia in Ashkenazi Jews.
 American Journal of Medical Genetics Part B: Neuropsychiatric Genetics 168, 649-659
 (2015).
35 Lam, M. et al. Comparative genetic architectures of schizophrenia in East Asian and
 European populations. Nature genetics 51, 1670-1678 (2019).
36 Teslovich, T. M. et al. Biological, clinical and population relevance of 95 loci for blood
 lipids. Nature 466, 707-713 (2010).
37 Willer, C. J. et al. Discovery and refinement of loci associated with lipid levels. Nature
 genetics 45, 1274 (2013).
38 Spracklen, C. N. et al. Association analyses of East Asian individuals and trans-ancestry
 analyses with European individuals reveal new loci associated with cholesterol and
 triglyceride levels. Human molecular genetics 26, 1770-1784 (2017).
39 De Vries, P. S. et al. Multiancestry Genome-Wide Association Study of Lipid Levels
 Incorporating Gene-Alcohol Interactions. American journal of epidemiology 188, 1033-
 1054 (2019).
40 Hoffmann, T. J. et al. A large electronic-health-record-based genome-wide study of
 serum lipids. Nature genetics 50, 401-413 (2018).
41 Ripatti, P. et al. Polygenic Hyperlipidemias and Coronary Artery Disease Risk.
 Circulation: Genomic and Precision Medicine 13, e002725 (2020).
42 Richardson, T. G. et al. Evaluating the relationship between circulating lipoprotein lipids
 and apolipoproteins with risk of coronary heart disease: A multivariable Mendelian
 randomisation analysis. PLoS medicine 17, e1003062 (2020).
You can also read