Visualizing Information on Watch Faces: A Survey with Smartwatch Users
←
→
Page content transcription
If your browser does not render page correctly, please read the page content below
Visualizing Information on Watch Faces: A Survey with Smartwatch Users
Alaul Islam* Anastasia Bezerianos† Bongshin Lee‡
UniversitÃl’ Paris-Saclay, CNRS, Inria, LRI UniversitÃl’ Paris-Saclay, CNRS, Inria, LRI Microsoft Research
Tanja Blascheck§ Petra Isenberg*
University of Stuttgart UniversitÃl’ Paris-Saclay, CNRS, Inria, LRI
Weather info
Temperature Watch
battery
level
Step
arXiv:2009.00750v2 [cs.HC] 15 Sep 2020
count
Heart rate/ECG
waveform
Distance
traveled Calories burned
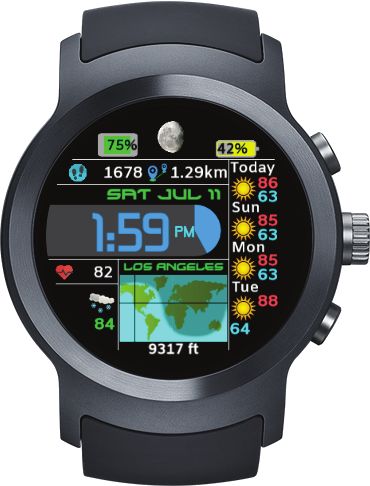
Figure 1: Smartwatch face examples (from Facer [13]) with increasing amounts of data items and representation types. From left to
right: Material Volcano (BlueIceshard), Pie Charts II (Sunny Liao), Minimal Colors H (AK Watch), and Earthshade (Brad C). The
graph on the right shows common pairs of data types displayed on the watch faces our 237 survey participants used. Circle colors
correspond to three data categories: Health & Fitness, Weather & Planetary, and Device & Location.
A BSTRACT home screen wearers see when glancing at or turning on their watch
People increasingly wear smartwatches that can track a wide vari- [3, 29]. These watch faces are typically small, have a resolution
ety of data. However, it is currently unknown which data people between 128–480 px per side with a viewable area of around 30–
consume and how it is visualized. To better ground research on 40mm [5] and show the current time together with several data types,
smartwatch visualization, it is important to understand the current such as step count, location, and weather information. Watch faces
use of these representation types on smartwatches, and to identify are often customizable, allowing wearers to choose the data they
missed visualization opportunities. We present the findings of a want to see regularly and at a glance. Given the large variety of data
survey with 237 smartwatch wearers, and assess the types of data available to display on smartwatches, we were particularly interested
and representations commonly displayed on watch faces. We found to answer the following research questions:
a predominant display of health & fitness data, with icons accompa- Q1: Which data types do people show on their watch faces?
nied by text being the most frequent representation type. Combining Q2: In which form is the data currently represented?
these results with a further analysis of online searches of watch Q3: What more can we visualize?
faces and the data tracked on smartwatches that are not commonly
visualized, we discuss opportunities for visualization research. Sup- To answer these questions, we first conducted an online survey
plementary material is available at https://osf.io/nwy2r/. with smartwatch wearers, then complemented these results with an
online search and analysis of smartwatch face examples, as well as an
Index Terms: Human-centered computing—Visualization— analysis of the technical capabilities of the watches our participants
Empirical studies in visualization; Human-centered computing— reported wearing. We contribute findings of current smartwatch use
Mobile devices and open opportunities for visualization research and design.
1 I NTRODUCTION 2 R ELATED W ORK
According to research and market reports, the demand for smart- Smartwatch use. Similar to our research goal, several prior studies
watches is expected to rise at a Compound Annual Growth Rate investigated smartwatch use in the wild. Schirra and Bentley [24]
(CAGR) of 14.5% between 2020 and 2025 [23]. People already and Cecchinato et al. [6] conducted interviews with early adopters of
use smartwatches as personal data collection devices, and with ad- smartwatches with a focus on why watches were adopted and what
ditional wifi connectivity they have access to various types of data. tasks they were used for. Later studies focused at commonly used fea-
Smartwatches that use visualizations to display data and expose pat- tures of smartwatches, finding that people mainly used smartwatches
terns, trends, or outliers in a compact way and at a glance may have to monitor and track activities or respond to notifications in addition
many potential benefits. Yet, the small display size of smartwatches to timekeeping [1,7,16,20]. Others looked at specific smartwatch use
also creates unique challenges [5] that call for visualization research. such as in classrooms [21], for healthcare purposes [8, 10, 11, 15, 22],
For device-oriented research, it is important to understand current stress detection [25], real-time eating activity detection [26], or un-
use and practices of its adopters. Thus, in this work, we investigate derstanding a wearer’s emotional state [22]. In contrast, we are not
the use of visualizations on watch faces, which are the first screen or interested in particular applications or feature use. Instead we focus
* e-mail: mohammad-alaul.islam | petra.isenberg@inria.fr
on what information is displayed directly on watch faces, and how it
† e-mail: anastasia.bezerianos@lri.fr
is displayed, outside of any particular watch app.
‡ e-mail: bongshin@microsoft.com Visualizations on smartwatches. Research on smartwatches in vi-
§ e-mail: tanja.blascheck@vis.uni-stuttgart.de sualization is still sparse. The few publications that do exist focused
either on studying representations for smartwatches or on designing
representations for these small displays. For example, researchers
studied low-level perceptual tasks to understand glanceability of
smartwatch visualizations [5], the impact of visual parameters (e.g.,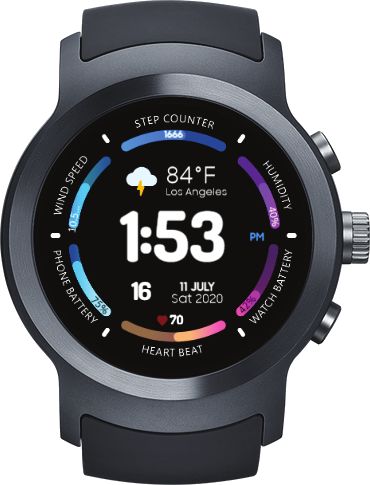
Table 1: Categories of data types shown on watch faces. Table 2: Representation types on watch faces.
Category Data type Representation How data is displayed
Health & Fitness Heart rate/ECG waveform, step count, sleep related info Only Text 68 )
as text, including numbers (e.g., text to display heart rate bpm
(e.g., quality, duration), distance traveled, calories burned, Only Icon as an icon (e.g., a pulsating heart representing heart rate )
floors/stairs climbed, and blood pressure
Icon + Text as text with an icon for context (e. g., a static heart with text to
Weather & Planetary Weather info (e.g., sky condition), temperature, wind show the current heart rate 68 )
speed/direction, moon phase, humidity, and sunset/sunrise
Only as a simple statistical chart (e. g., showing recent heart rates
time
Chart/Graph )
Device & Location Watch battery level, phone battery level, bluetooth, wifi,
Text + as text with a simple chart (e.g., heart rate linechart 68 bpm
)
and location name
Chart/Graph
Other Data and representation type not in our list (open textfield)
Representations
size, frequency, and color) on reaction times [14], or representation Only Text Wind 35mph SE 1355 steps 80% charge
preferences in an air traffic control use case [17]. Only Icon
Others’ visualization research described novel visualization de- Radial bar
Icon + Text Icon + Text
chart Wind 35mph SE 1355 steps
signs specifically for smartwatches. Examples include research on
l
Only Chart/
oa
representing health and fitness data on smartwatches [2, 18], for line
G
Only Icon Only Text Graph
charts [19], temporal data [27], activity tracking more broadly [9], Text +
Chart/Graph
and even for integrating visualizations in watch straps [12]. In con-
trast to these works, our study contributes information on people’s Watch Face Example data and representations
current representation types on watch faces and the results can be Figure 2: Explanatory image of answer choices shown to participants.
used to inform future research such as reported above.
Data quality. We took several steps to ensure the quality of our
3 M ETHODOLOGY
collected data. From the 463 total responses, 177 were incomplete
We conducted an anonymous online survey, for which we recruited and another 31 failed our screening procedure. We asked participants
regular smartwatch wearers at least 18 years of age.1 to wear a smartwatch or at least have it available around them (e.g.,
Survey design. Our survey consisted of three sections, primarily charging, holding) to ensure that they do not answer questions from
containing close-ended questions. The first was designed to elicit memory. We prompted them to verify if that was the case. The 30
general information about a respondent’s watch face. Here, we participants who answered “no” were not allowed to continue to
asked questions about the respondent’s watch shape and in which the survey. We also excluded one participant who did not sign the
form (analog, digital, or both analog & digital) they read the time consent form. We had 255 complete responses for data analysis. We
on the first screen or home screen of their watch. The second sec- discarded 18 additional participants: Five of them reported to seeing
tion focused on which additional data types—such as step count every single kind of data, and their responses did not match the watch
or temperature—were shown on the respondent’s watch face. In face image they provided. Three participants reported the names of
addition to offering common kinds of data types as options, we had several smartwatch models, so we could not determine which one
an other text field for participants to fill out in case their watch face they recorded during the study. Another 10 wore fitness bands rather
showed data not in our list. than smartwatches and were excluded due to their dedicated focus
To derive the list of data types for our survey (Table 1), we con- on fitness data and limited display capabilities. We report results
sulted prior research [28] and analyzed images of popular watch from the remaining 237 valid responses.
faces from Facer [13], a watch-face download and generation
page/app for Android, Samsung, and iOS watches. Inspired by 4 A NALYSIS & R ESULTS
categories used in the Facer app, we grouped possible kinds of data The majority of participants reported wearing a smartwatch with a
into three categories: health & fitness related data, weather & plan- round display (150×), followed by a square (68×), and rectangular
etary data, and device- & location-related data. For each kind of display (17×). Two participants reported having Squaricle / Rounded
data we asked participants to tell us how the data was shown on their square types. Most participants (149×) reported that the data items
watch face. We provided participants with five possible represen- on their watch face are static and do not change (automatically or
tation types accompanied by a text description (Table 2) and by an manually, e. g., by tap or swipe). Forty six participants reported
explanatory image (Fig. 2). These categories were based on how their watch face changed automatically while 42 reported that they
numerical or categorical data are displayed on more than 500 watch could manually swap data shown on their watch face. Participants’
faces that we collected from the Facer app and internet searches. smartwatches came from 20 different brands with Apple (76×),
In the final section of the survey we asked participants to provide Fossil (51×), Samsung (36×), Garmin (17×), and Huawei (12×)
the brand and model name for their smartwatch so we could verify being the top five brand (80% of our respondents).
the plausibility of their responses. We also asked participants to
optionally upload a picture or screenshot of their watch face for veri-
fication. More details about the questions and format are available 40
in the supplementary material. 35
Participants
30
Participant recruitment. To reach a wide range of smartwatch 25
wearers we advertised our survey on popular social media (Reddit, 20
Twitter, Facebook, Instagram, and LinkedIn), and asked colleagues 15
10
to spread the call to their labs. The survey was available online for 5
30 days during April and May, 2020. 0
0 1 2 3 4 5 6 7 8 9 10 11 12 13 14 15 16 17 18
Number of data items reported
1 IRB approved under ref. no Paris-Saclay-2020-002 CER.
Figure 3: Number of data items present on a respondent’s watch face.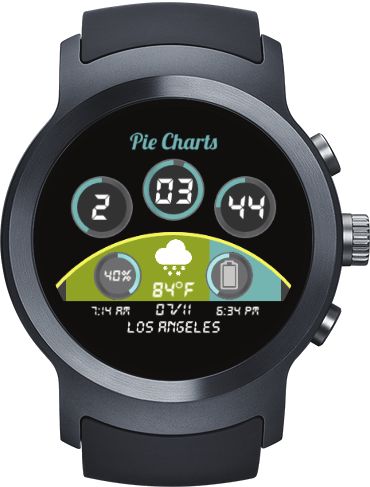
68
Watch battery level 165 Only Text bpm
Temperature 158 Only Icon
Step count 147 Icon + Text 68
Weather info 143 Only Chart/Graph
Heart rate/ECG waveform 104 Text + Chart/Graph 68 bpm
Calories burned 104
Distance traveled 70
Figure 5: Average number of representation types for each participant.
Bluetooth 61
Sunset/Sunrise time 57
Only Text Only Icon Icon + Text Only Chart/Graph Text + Chart/Graph
Phone battery level 56 Heart rate/ECG waveform 20 7 53 4 20
Floors/Stairs climbed 48 Health 530 Step count 40 8 57 10 32
Wifi 43 Sleep related info 2 1 16 7 7
Location Name 36 Weather 447 Distance traveled 24 9 22 4 11
Sleep related info 33 Calories burned 24 11 25 14 30
Moon phase 32 Device 361 Floors/Stairs climbed 16 4 15 1 12
Wind speed/direction 30 Blood pressure 8 1 11 1 3
0 100 200 300 400 500
Humidity 27 Weather info 10 65 53 4 11
Blood pressure 24
Temperature 83 3 52 20
0 50 100 150 200
Wind speed/direction 15 3 10 2
Moon phase 4 13 10 2 3
Figure 4: Distribution of data types participants displayed and saw on Humidity 13 1 11 2
their watch faces (left); aggregated by categories on the right. Sunset/Sunrise time 15 7 26 2 7
Watch battery level 24 22 77 14 28
Phone battery level 7 11 31 3 4
4.1 Q1: Which data types do people show on their
Bluetooth 2 51 6 2
watch faces? Wifi 1 39 3
We were first interested to see whether people had configured their Location Name 20 7 8 1
Participants
watch faces to show a large amount or only a few data items. On 2 18 34 50 66 82
average, participants reported showing a median of 5 different data
items on their watch faces. Fig. 3 shows that having 3, 4, or 5 data Figure 6: Representation types reported for different data types.
items were the most common answers.
Next, we wanted to learn which data types were the most com- Only (M = 0.28, 95% CI: [0.2 , 0.37]) appeared less than once
monly displayed (Fig. 4). From the three categories we asked about, per watch face on average.
health-fitness related data were the most commonly reported (530×). In Fig. 6 we can see how many participants showed each data type
The most common data type in this category was step count (the third with each representation type. Data types most commonly displayed
or Chart+Text 68 were calories
bpm
most common overall, 147×). Temperature was the most frequent with either Chart Only
weather & planetary data type (the second most common overall, burned (14 + 30 = 44×), step count (10 + 32 = 42×), and watch
158×). For device-location related data, watch battery level (165×) battery levels (14 + 28 = 42×).
was the most displayed and also the most common overall. The most Complementary search of representation types. Surprised by the
commonly mentioned data types from the free-text responses were: high number of icons reported, we decided to investigate further
standing up count (43×) and exercise/body movement time (24×). how different information can be displayed on watch faces. We
Next, we wanted to learn about individual watch faces. We conducted an extensive image search, during which we looked for
analyzed, which categories were most common per watch face and examples of each representation type in current use. We looked at
which data types often appeared together. On average, most of the popular watch brands’ websites, searched the internet for images
data shown on an individual watch face came from the health & (keywords: smartwatch face, popular smartwatch, smartwatch, etc.),
fitness category. Participants reported seeing on average: 2.24 health and looked at examples from the Facer watch face creation and
& fitness (Mdn = 2, 95% CI [1.98, 2.48]), 1.89 weather & planetary distribution app. Table 3 shows exemplary graphics for each kind of
(Mdn = 2, 95% CI [1.69, 2.08]) and 1.52 device-location related data data × representation type combination, redrawn for image clarity.
(Mdn = 1, 95% CI [1.35, 1.7]) on their watch face. We found only few examples online of data types represented by an
To know more about which types of data are commonly shown Icon Only display. Yet, Fig. 6 shows that participants reported
together, we performed a co-occurrence analysis of data types par- seeing Icon Only representations for almost every data with
ticipants saw on their watch faces. The graph in Fig. 1 shows on average around one Icon Only display per smartwatch face.
combinations of two kinds of data that can be found on at least 25% We discuss this discrepancy further in Sect. 5.
of our respondents’ watch faces. The thicker the link, the more
frequent the data pair appeared on people’s watch faces. Circle size 4.3 Q3: What more can we visualize?
corresponds to how often participants reported seeing this data type.
Circle color corresponds to the data type category. Only connections Complementary investigation of device capabilities. To find un-
that appeared more than 59 (≈ 237 / 4) times are shown. tapped opportunities for visual representations, we looked at techni-
cal details for the 54 smartwatch models (from the 20 brands) our
participants wore. We found that all smartwatches had fitness or ac-
4.2 Q2: In which form is the data currently represented?
tivity tracking as a core feature, including measuring and display of
Fig. 5 shows the average number of representation types each par- body movement, steps, sleep patterns, or dedicated exercise tracking.
ticipant had on their watch face. Icon+Text 68 was the most com- The smartwatches our participants used also carried a wide variety
mon representation type, used to display on average two kinds of of sensors [11]: activity sensors such as accelerometers (53 models)
data types on each watch face (M = 2.05, 95% CI: [1.78, 2.32]). and gyroscopes (46 models); physiological sensors such as heart rate
The next most common were Text Only bpm 68 (M = 1.38, 95% sensors (47 models); and environmental sensors such as barometric
CI: [1.13, 1.66]), and Icon Only (M = 1.11, 95% CI: [0.93, altimeters (38 models). Many smartwatches allowed for at least
1.3]). Representations using visualizations were less common. bluetooth (54 models) or wifi (43 models) connectivity. By tracking
Chart+Text 68 (M = 0.82, 95% CI: [0.64, 1.03]) and Chart
bpm
which types of sensors were available on people’s smartwatches, we
Table 3: Redrawn example representations from real smartwatch Data seen Data could see
faces. Text color corresponds to the data type category. Bluetooth Watch battery level
and wifi only text and only icon change color based on on/off status. Temperature
Step count
Weather info
Heart rate/ECG waveform
Data Types
Only Only Icon+- Only Text+-
Calories burned
Text Icon Text Chart Chart Distance traveled
Bluetooth
68 68
102
Sunset/Sunrise time
Heart rate / ECG bpm HEART RATE
Phone battery level
Floors/Stairs climbed
52
12AM 6 12PM 6
waveform
Wifi
3168 3168 1596
Location Name
Step count steps Sleep related info
1h13m REM Moon phase
Sleep related info 4h11m light
Zzz 6h53m Wind speed/direction
11:30PM-7:30AM 6h30m
Humidity
1.19 Miles
1 Mile
Blood pressure
Distance traveled DISTANCE 182 0 50 100 150 200 250
Calories burned 64 Cal 1,603 396 Figure 7: Difference between # of watches that tracked each data
type and how many participants actually saw it on their watch face.
Floors/Stairs 31 floors 13 ELEVATION PROFILE
10
climbed
SYS DIA
we cared and did not care about. Yet, participants might not have
Blood pressure 120 81 126/78 146 96
read the instructions carefully and included responses about graphi-
PARTLY CLOUDY
ow
y - cloudy
14F cal icons that do not change based on data. A second possibility for
cloudy - sn
- ra
Weather info
iny - sunn
50% 90%
tly
windy - par
y-
the larger frequency of Icon Only responses might be attributed
Wind Wind ESE at 3mph West 3
to typical Icon+Text 68 displays that due to missing or currently
speed/direction inaccessible data result in an icon-only representation (e.g., :
heart icon with currently blank text). For our analysis reported in
Temperature 31°
C 14C Temp
17 Fig. 7 we had to sometimes infer based on sensors whether a certain
6:34 PM SUNSET 7:14 am 5h 12min derived value such as calories burned would be available on a watch.
Sunset/Sunrise time 7:14 AM SUNRISE
6:34 pm SUNRISE
until sunset
SUNSET
7:14 am 6:34 pm
The supplementary material makes our inferences transparent.
25.45
Moon phase Moon Age: 25.43 Days 17%
Moon MOON
AGE 25.7
A wide variety of data types is available for our participants’
watch faces. The list of frequently presented data types provides
Humidity 40% 42% 40%
starting points for creating visual representations that could be valu-
HUMIDITY
able to a broad range of viewers. In addition, when designing per-
Bluetooth ceptual studies in the future, it might be useful to take into account
Mob
Phone battery level 85% 100% phone
50% participants’ familiarity with this data type.
Our participants had five data items on average on their watch
Location name Paris Normandy
30° 15' 59.9976'' N 97° 43' 59.9880'' W
faces. As five is a relatively large number for a small smartwatch dis-
play, an open research question is how to help people cope with such
Wifi wi-fi G G 3 bars G wifi
0%
a dense data display. Given our analysis of common co-occurrences
88% 50% (especially within the categories) (Fig. 1-right), it may be useful to
Watch battery level WATCH 44%
watch
consider combining them into joint representations.
Our survey results indicate that visualizations are still not as
common as other representations such as text, even though they can
derived the types of data their watches could track and participants
be used to represent some of the most commonly displayed data
could see on their watch faces (Fig. 7).
(e.g., step counts and battery levels). Our online search of technical
There naturally is a mismatch between what our participants could
capabilities of smartwatches also indicates that much of the data
see and what they did see: watch faces do not show all available
tracked wearers do not see. This includes some health & fitness
data. Nevertheless, this mismatch varies. For example, from health
data that most devices track (e.g., calories, distance, sleep and blood
& fitness data that almost all devices track, roughly 62.03% of par-
pressure data). Whether these are explicit customization choices
ticipants see step counts, but this percentage is less when it comes
due to specific tasks they want to carry out, or due to a choice
to heart rate (45.61%), or calories burned (43.88%), and drops
the default displays promote for the smartwatch face, remains an
drastically for distance traveled (34.65%), floors count (22.97%),
open question. Further research needs to investigate representation
sleep, and blood pressure (13.48%). This list of commonly tracked
choices, to determine if the wider adoption of visualizations is a
data that is under-represented can serve as a starting point for visu-
question of preference, tasks, a lack of exposure, and if it requires
alization designers. For example, in past work [4] we found that
us to rethink visual encodings for smartwatches. In addition, future
smartwatch wearers would have liked to see sleep data but a display
work needs to establish at which level of granularity information
on their fitness tracker was not available to them.
should be displayed. For example, are exact wind speeds important
5 D ISCUSSION AND F UTURE W ORK or are broad categories (stormy, light breeze, no wind) enough;
presentation types would change based on this decision.
It is challenging to determine a right vocabulary for wide-audience In summary, our work contributes to the understanding of the
surveys. In our case, while we found few examples of icon only current real-world use of representation types on smartwatches and
displays, participants often reported this type of representation. One additional findings that can inform and inspire the visualization
possibility for these responses might be confusion about what con- community to pursue smartwatch visualization.
stitutes “data.” In the survey instructions, we informed participants
that we only cared about information in the form of numbers or
ACKNOWLEDGMENTS
categories, such as step count (numerical) or weather condition (cat-
egorical). We also asked participants not to consider graphics such as We thank the participants of our survey, and Natkamon Tovanich &
settings, calendar, or music app icons because they do not represent Pierre Dragicevic for their help with the data analysis. The work
numerical or categorical information; and gave examples of graphics was funded in part by an ANR grant ANR-18-CE92-0059-01.R EFERENCES [17] S. M. Neis and M. I. Blackstun. Feasibility analysis of wearables
for use by airline crew. In 2016 IEEE/AIAA 35th Digital Avionics
[1] M. Al-Sharrah, A. Salman, and I. Ahmad. Watch your smartwatch. Systems Conference (DASC), pp. 1–9, 2016. doi: 10.1109/DASC.2016.
In International Conference on Computing Sciences and Engineer- 7778023
ing (ICCSE), pp. 1:1–1:5. IEEE, 2018. doi: 10.1109/ICCSE1.2018. [18] A. Neshati, Y. Sakamoto, and P. Irani. Challenges in displaying health
8374228 data on small smartwatch screens. Studies in Health Technology and
[2] F. Amini, K. Hasan, A. Bunt, and P. Irani. Data representations for Informatics, 257:325–332, 2019. doi: 10.3233/978-1-61499-951-5-325
in-situ exploration of health and fitness data. In Proceedings of the [19] A. Neshati, Y. Sakamoto, L. C. Leboe-McGowan, J. Leboe-McGowan,
Conference on Pervasive Computing Technologies for Healthcare (Per- M. Serrano, and P. Irani. G-sparks: Glanceable sparklines on smart-
vasiveHealth), pp. 163–172. ACM, New York, NY, USA, 2017. doi: watches. In Proceedings of Graphics Interface (GI), pp. 23–1. Canadian
10.1145/3154862.3154879 Information Processing Society, 2019. doi: 10.20380/GI2019.23
[3] Apple Inc. 2015. Apple watch user guide – version 1.0. [20] S. Pizza, B. Brown, D. McMillan, and A. Lampinen. Smartwatch in
https://manuals.info.apple.com/MANUALS/1000/MA1708/ vivo. In Proceedings of the Conference on Human Factors in Comput-
en_US/apple_watch_user_guide.pdf. Last visited: July, 2020. ing Systems (CHI), pp. 5456–5469. ACM, New York, NY, USA, 2016.
[4] R. Aravind, T. Blascheck, and P. Isenberg. A Survey on Sleep Visual- doi: 10.1145/2858036.2858522
izations for Fitness Trackers. Posters of the European Conference on [21] R. Quintana, C. Quintana, C. Madeira, and J. D. Slotta. Keeping watch:
Visualization (EuroVis), 2019. Poster. Exploring wearable technology designs for k-12 teachers. In Extended
[5] T. Blascheck, L. Besançon, A. Bezerianos, B. Lee, and P. Isenberg. Abstracts of the Conference on Human Factors in Computing Systems
Glanceable visualization: Studies of data comparison performance (CHI), pp. 2272–2278. ACM, New York, NY, USA, 2016. doi: 10.
on smartwatches. IEEE Transactions on Visualization and Computer 1145/2851581.2892493
Graphics, 25(1):630–640, 2019. doi: 10.1109/TVCG.2018.2865142 [22] J. C. Quiroz, M. H. Yong, and E. Geangu. Emotion-recognition using
[6] M. E. Cecchinato, A. L. Cox, and J. Bird. Always on(line)? user ex- smart watch accelerometer data: Preliminary findings. In Proceed-
perience of smartwatches and their role within multi-device ecologies. ings of the Conference on Pervasive and Ubiquitous Computing and
In Proceedings of the Conference on Human Factors in Computing Proceedings of the Symposium on Wearable Computers, pp. 805–812.
Systems (CHI), pp. 3557–3568. ACM, New York, NY, USA, 2017. doi: ACM, New York, NY, USA, 2017. doi: 10.1145/3123024.3125614
10.1145/3025453.3025538 [23] Research And Markets. Smartwatch market -
[7] J. Chauhan, S. Seneviratne, M. A. Kaafar, A. Mahanti, and A. Senevi- growth, trends, forecasts (2020 - 2025). https:
ratne. Characterization of early smartwatch apps. In Proceedings of the //www.researchandmarkets.com/reports/4591978/
Conference on Pervasive Computing and Communication Workshops smartwatch-market-growth-trends-forecasts. Last vis-
(PerCom Workshops), pp. 1–6, 2016. doi: 10.1109/PERCOMW.2016. ited: July, 2020.
7457170 [24] S. Schirra and F. R. Bentley. “itâĂŹs kind of like an extra screen for my
[8] N. S. Erdem, C. Ersoy, and C. Tunca. Gait analysis using smartwatches. phone”: Understanding everyday uses of consumer smart watches. In
In Proceedings of the Symposium on Personal, Indoor and Mobile Extended Abstracts of the Conference on Human Factors in Computing
Radio Communications (PIMRC Workshops), pp. 1–6, 2019. doi: 10. Systems (CHI), pp. 2151–2156. ACM, New York, NY, USA, 2015. doi:
1109/PIMRCW.2019.8880821 10.1145/2702613.2732931
[9] R. Gouveia, F. Pereira, E. Karapanos, S. A. Munson, and M. Hassen- [25] P. Siirtola. Continuous stress detection using the sensors of commercial
zahl. Exploring the design space of glanceable feedback for physical smartwatch. In Adjunct Proceedings of the Conference on Pervasive
activity trackers. In Proceedings of the Conference on Pervasive and and Ubiquitous Computing and Proceedings of the Symposium on
Ubiquitous Computing, pp. 144–155. ACM, New York, NY, USA, Wearable Computers, pp. 1198–1201. ACM, New York, NY, USA,
2016. doi: 10.1145/2971648.2971754 2019. doi: 10.1145/3341162.3344831
[10] H. Kalantarian, N. Alshurafa, E. Nemati, T. Le, and M. Sarrafzadeh. [26] S. Stankoski, N. Reščič, G. Mežič, and M. Luštrek. Real-time eat-
A smartwatch-based medication adherence system. In Proceedings of ing detection using a smartwatch. In Proceedings of the Conference
the Conference on Wearable and Implantable Body Sensor Networks on Embedded Wireless Systems and Networks (EWSN), pp. 247–252.
(BSN), pp. 1–6, 2015. doi: 10.1109/BSN.2015.7299348 Junction Publishing, USA, 2020.
[11] A. Kamišalić, I. Fister, M. Turkanović, and S. Karakatič. Sensors [27] A. Suciu and J. Larsen. Active self-tracking and visualization of
and functionalities of non-invasive wrist-wearable devices: A review. subjective experience using VAS and time spirals on a smartwatch. In
Sensors, 18(6):1714, 2018. doi: 10.3390/s18061714 Proceedings of the Data Visualization on Mobile Devices Workshop
[12] K. Klamka, T. Horak, and R. Dachselt. Watch+strap: Extending held at the ACM Conference on Human Factor in Computing Systems
smartwatches with interactive strapdisplays. In Proceedings of the (CHI), 2018.
Conference on Human Factors in Computing Systems (CHI), pp. 1–15. [28] A. Visuri, Z. Sarsenbayeva, N. van Berkel, J. Goncalves, R. Rawas-
ACM, New York, NY, USA, 2020. doi: 10.1145/3313831.3376199 sizadeh, V. Kostakos, and D. Ferreira. Quantifying sources and types
[13] Little Labs, Inc. Facer - thousands of free watch faces for apple watch, of smartwatch usage sessions. In Proceedings of the Conference on
samsung gear s3, huawei watch, and more. https://www.facer.io/. Human Factors in Computing Systems (CHI), pp. 3569–3581. ACM,
Last visited: July, 2020. New York, NY, USA, 2017. doi: 10.1145/3025453.3025817
[14] K. Lyons. Visual parameters impacting reaction times on smartwatches. [29] H. Zhang, H. Wu, and A. Rountev. Detection of energy inefficiencies in
In Proceedings of Conference on Human-Computer Interaction with android wear watch faces. In Proceedings of the Meeting on European
Mobile Devices and Services (MobileHCI), pp. 190–194. ACM, New Software Engineering Conference and Symposium on the Foundations
York, NY, USA, 2016. doi: 10.1145/2935334.2935344 of Software Engineering, pp. 691–702. ACM, New York, NY, USA,
[15] M. Maritsch, C. Bérubé, M. Kraus, V. Lehmann, T. Züger, S. Feuer- 2018. doi: 10.1145/3236024.3236073
riegel, T. Kowatsch, and F. Wortmann. Improving heart rate variability
measurements from consumer smartwatches with machine learning. In
Adjunct Proceedings of the Conference on Pervasive and Ubiquitous
Computing and Proceedings of the Symposium on Wearable Computers,
pp. 934–938. ACM, New York, NY, USA, 2019. doi: 10.1145/3341162
.3346276
[16] D. McMillan, B. Brown, A. Lampinen, M. McGregor, E. Hoggan, and
S. Pizza. Situating wearables: Smartwatch use in context. In Pro-
ceedings of the Conference on Human Factors in Computing Systems
(CHI), pp. 3582–3594. ACM, New York, NY, USA, 2017. doi: 10.
1145/3025453.3025993You can also read