NATIONAL & SUBNATIONAL ESTIMATIONS & PROJECTIONS OF HIV EPIDEMIC, MALAYSIA: 2019 - HIV/STI/Hepatitis C Sector, Ministry of Health, Malaysia
←
→
Page content transcription
If your browser does not render page correctly, please read the page content below
NATIONAL & SUBNATIONAL
ESTIMATIONS & PROJECTIONS OF
HIV EPIDEMIC, MALAYSIA:
2019

 HIV/STI/Hepatitis C Sector, Ministry of Health, Malaysia

2

National and Subnational Estimation and Projection of
            HIV Epidemic Malaysia: 2019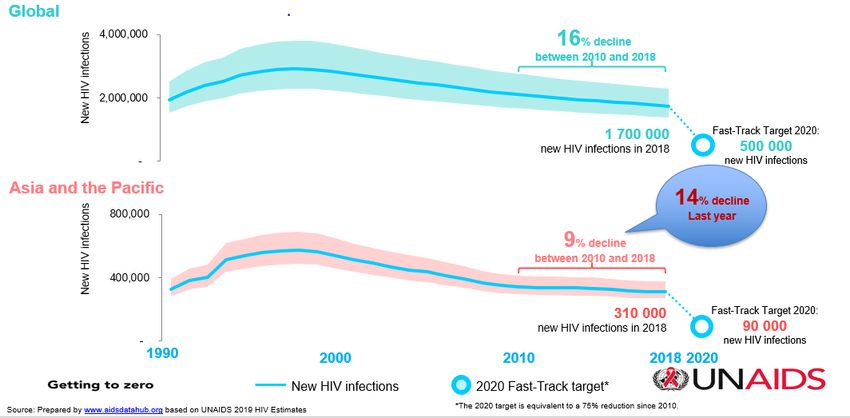
3

National and Subnational Estimation and Projection of HIV Epidemic Malaysia: 2019
April 1, 2021
©Ministry of Health Malaysia, 2021

Published by:
HIV/STI/Hepatitis C Sector
Disease Control Division,
c/o Deputy Director General (Public Health) Office
Ministry of Health Malaysia
Block E10, Federal Government Administrative Centre
62590 Putrajaya,
MALAYSIA
ISBN: 9789672469339
Available at website: http://www.moh.gov.my

This report is copyrighted. Reproduction and dissemination of its contents in part or in whole for research,
educational or non-commercial purposes is authorized without any prior written permission if the source of
reference is fully acknowledged.

Suggested citation:
HIV/STI/Hepatitis C Sector, National and Subnational Estimation and Projection of HIV Epidemic Malaysia: 2019,
Ministry of Health Malaysia: Putrajaya
4

This report was coordinated and produced by HIV/STI/Hepatitis C Sector of Ministry of Health
Malaysia.

Malaysia AEM Core Team:
Dr Anita Suleiman (Modelling Advisor and Team Leader, Public Health Consultant)
Dr Sha’ari Ngadiman (Modelling Advisor, Public Health Consultant)
Dr Mazliza Ramly (Public Health Physician, HIV/STI/Hepatitis C Sector)
Mr Parimelazhagan Ellan (Malaysia AIDS Council)
Ms Nadrah Yusoff (Malaysia AIDS Council)
Ms Syahirah Jhan Abdul Khalil Khan (Malaysia AIDS Council)

Technical Consultant:
Dr Wiwat Peerapatanapokin (East-West Centre Hawaii)
Dr Khin Cho Win Htin (UNAIDS)

Editorial Team:
Dr Anita Suleiman, Chief Editor
Dr Mazliza Ramly, Lead Author
Dato’ Indera Dr Sha’ari Ngadiman
5

TABLE OF CONTENTS
EXECUTIVE SUMMARY ................................................................................................................................... 9
INTRODUCTION ............................................................................................................................................. 11

   BACKGROUND ..................................................................................................................................................... 11
   AIDS EPIDEMIC MODEL (AEM) ............................................................................................................................ 12
   SPECTRUM.......................................................................................................................................................... 13
   AEM-SPECTRUM ................................................................................................................................................ 14
   OBJECTIVES ........................................................................................................................................................ 14

METHODOLOGY ............................................................................................................................................ 15

   NATIONAL CONSULTATIVE WORKSHOPS ............................................................................................................... 15
   NATIONAL ESTIMATES.......................................................................................................................................... 15
       Data inputs and assumptions in the AEM ..................................................................................................... 15
       Data inputs in the Spectrum ......................................................................................................................... 16
       National AEM and Spectrum comparison and adjustments ......................................................................... 16
   SUBNATIONAL ESTIMATES .................................................................................................................................... 17
       Disaggregation analysis method .................................................................................................................. 17
       Subnational Spectrum .................................................................................................................................. 17

RESULTS ....................................................................................................................................................... 19

   NATIONAL HIV ESTIMATES ................................................................................................................................... 19
       People Living with HIV (Adults 15+) ............................................................................................................. 19
       New HIV Infections (Adults 15+) ................................................................................................................... 20
       Adults (15+) New HIV Infections by Risk Population .................................................................................... 21
   SUBNATIONAL HIV ESTIMATES ............................................................................................................................. 22
       HIV Prevalence by subnational .................................................................................................................... 22
       HIV Incidence (per 1000 population) ............................................................................................................ 25
       PLHIV by Subnational, 2018 – 2022 ............................................................................................................. 28

DISCUSSIONS................................................................................................................................................ 29
ENDING AIDS 2030: FUTURE ENDEVEOURS ............................................................................................... 32
ANNEX 1 ......................................................................................................................................................... 33
ANNEX 2 ......................................................................................................................................................... 42
ANNEX 3 ......................................................................................................................................................... 43
REFERENCES ................................................................................................................................................ 45
6 LIST OF FIGURES FIGURE 1: OVERVIEW OF AEM WORKBOOK ............................................................................................................... 13 FIGURE 2: AEM-SPECTRUM PROCESS FOR SUBNATIONAL ESTIMATES ....................................................................... 18 FIGURE 3: TREND OF ESTIMATED PLHIV IN MALAYSIA (AGED 15+), 1985 - 2020 ........................................................ 19 FIGURE 4: TREND OF ESTIMATED NEW HIV INFECTIONS BY GENDER IN MALAYSIA, 1985 – 2020 .................................... 20 FIGURE 5: ANNUAL NEW HIV INFECTIONS BY RISK POPULATION IN MALAYSIA, 1985 - 2020 ......................................... 21 FIGURE 6: ANNUAL NEW HIV INFECTIONS PROPORTION BY RISK POPULATION IN MALAYSIA, 1985-2020 ...................... 21 FIGURE 7: HIV PREVALENCE FOR CATEGORY 1, 1990-2018...................................................................................... 23 FIGURE 8: HIV PREVALENCE FOR CATEGORY 2, 1990-2018...................................................................................... 23 FIGURE 9: HIV PREVALENCE FOR CATEGORY 3, 1990-2018...................................................................................... 24 FIGURE 10: HIV PREVALENCE FOR CATEGORY 4, 1990-2018 .................................................................................... 24 FIGURE 11: INCIDENCE PER 1000 POPULATION FOR CATEGORY 1, 2000 – 2030 .......................................................... 25 FIGURE 12: INCIDENCE PER 1000 POPULATION FOR CATEGORY 2, 2000-2030 ............................................................ 26 FIGURE 13: INCIDENCE PER 1000 POPULATION FOR CATEGORY 3, 2000-2030 ............................................................ 26 FIGURE 14: INCIDENCE PER 1000 POPULATION FOR CATEGORY 4, 2000-2030 ............................................................ 27 FIGURE 15: SUBNATIONAL CONTRIBUTIONS FOR NEW INFECTIONS, 1990 – 2030 .......................................................... 27 FIGURE 16: GLOBAL AND REGIONAL PROGRESS ON HIV INFECTION, 1990-2018 ........................................................ 29 FIGURE 17: NATIONAL HIV DATA, NEW CASES, 1986 - 2018....................................................................................... 30 FIGURE 18: DISTRIBUTION OF HIV INFECTION BY MODE OF TRANSMISSION IN MALAYSIA, 1986-2018 .......................... 30 FIGURE 19: PERCENTAGE CHANGE IN NEW INFECTION BY SUBNATIONAL, 2010-2018................................................... 31 LIST OF TABLES TABLE 1: PLHIV AND NEW HIV INFECTION BY SUBNATIONAL, 2018 - 2021 .................................................................. 28
7

Foreword
                           The first AIDS case was reported in Malaysia in 1986. As of
                           December 2018, Malaysia has a total of 115,263 HIV cases
                           reported to the national surveillance system. Of that, 72,399 people
                           were living with HIV (PLHIV) from estimated of 87,122 based on
                           Asian Epidemic Model (AEM) projection.

                           During the first 25 years into the HIV epidemic the main mode of
                           transmission in Malaysia was through injecting drug use,
                           specifically through the sharing of contaminated needles and
syringes among people who inject drugs (PWID) bearing the brunt of 70%-80% of new cases
annually. In 2014 the share of new infections attributed to sexual transmission had reached
80% of the annual total.

Maintaining business as usual, the AEM model projected that the HIV incidence in Malaysia
will increase dramatically from 2018 onwards and by 2030, Malaysia is estimated to have
162,378 PLHIV. The model projected that Malaysia would have 14,534 new HIV infection in
2030 making it impossible to reach ‘Ending AIDS’ target in 2030. Kuala Lumpur, Sabah, Johor,
Sarawak, and Selangor account for more than 60% (102,976) of new cases, contributed largely
through sexual transmission.

We were successful in realizing our target in Millennium Development Goals by achieving 50%
reduction of new HIV infection through our harm reduction programme ahead of time. However,
the pace of declining has reached flat line. This report demonstrates that the country needs
more focus strategies and interventions to end AIDS epidemic especially to the top five
subnational and their key populations.

This is the second report for national HIV epidemic estimation and projection published by the
Ministry of Health. It is a continuation of report which was produced earlier in 2016 for Ending
AIDS in Malaysia. However, in this round, we include the estimation and projection for
subnational which would help the policy maker and the implementors to understand the HIV
epidemic trend from all aspects including its projection. This is important due to our varied
socio-demographic structure and epidemic progress of each subnational which makes the
interventions unique and different.
8 Lastly, I would like to acknowledge the admirable teamwork and hard work by the Malaysia AEM core team led by Ministry of Health’s Disease Control Division especially the HIV/STI/Hepatitis C Sector and Malaysia AIDS Council as well as the technical consultant from East-West Centre Hawaii and UNAIDS in data gathering, processing, and analyzing, and publishing this report. I would also like to extend my sincere appreciation and gratitude to all the state AIDS Officers, public health physicians, and Family Medicine Specialists for their contribution to this report.
9

EXECUTIVE SUMMARY
A series of national consultative workshops were conducted to develop the National AEM
Baseline workbook as well as to update National Spectrum file and to develop subnational
estimates. The outcomes of these workshops are to provide summary of national and
subnational HIV estimates based on inputs, calculations, data triangulation and assumptions
as well as the consensus agreement of national and subnational AEM and Spectrum update
processes by the end of 2018.

One of the key findings highlighted in this report is the trend of new HIV cases that has reached
a flat line from 2015 onwards. This phenomenon is also observed regionally and globally, where
the declining in new HIV infections in the past 8 years has been stalled far from 2020 Ending
AIDS fast-track target. In the beginning of the epidemic, the new HIV cases increased
exponentially and peaked in year 2002. Subsequently, the infection rate declined steadily until
2015 where it began to stall. Given that IDU is the main mode of transmission for HIV infection
in Malaysia during the earlier phase, the decline in new cases may be contributed by few
reasons among others; (1) the success of the National Harm Reduction program introduced in
2005; and (2) changing addiction behavior among PWID from injecting to taking oral drugs.

After 2018, Spectrum projected that the HIV incidence will increase dramatically. A shift in the
epidemic mode of transmission, from one previously driven by injecting drug use to one of
sexual transmission may have contributed to this intense increase in HIV incidence.

Analysis by subnational reveals the same trend. At the beginning of the epidemic, majority of
the new HIV cases were contributed by subnational with high number of PWID such as Johor,
Terengganu, and Kelantan. While in the recent epidemic, majority of the new cases are mostly
from Kuala Lumpur, Sabah, Sarawak, and Selangor, where majority of the reported cases are
sexually transmitted. Other subnational such as Melaka, Labuan, Penang and Negeri Sembilan
are also seeing increasing in new HIV infections in the last 10 years.

Based on the same analysis, the HIV epidemic in Malaysia by subnational can be summarized
into 4 categories i.e., Category 1: Subnational with prevalence above national average and
increasing. The subnational in this category are Kuala Lumpur; Category 2: Subnational with
prevalence above national average and decreasing. Subnational in this category include Johor,
Perlis, Pahang, Terengganu, Negeri Sembilan, and Kelantan; Category 3: Subnational with
10

prevalence below national average and stabilizing. Subnational in this category include Kedah,
Penang, and Perak; and Category 4: Subnational with prevalence below national average and
increasing. The subnational in this category is Melaka, Selangor, Sarawak, Sabah, and
Labuan.

As predicted, Selangor, Kuala Lumpur, and Johor, contributed more than half of the new HIV
cases in Malaysia in 2018. These subnational are the most developed or urbanized
subnational. Urbanization often comes with social problem associated with dense and diverse
populations especially among young and mobile populations.

Malaysia has a unique demographic structure peculiar to each subnational. Therefore, the
interventions have to tailor to the need of each subnational and not ‘one size fit all’. Focusing
on effective strategies and interventions of the top five (5) subnational and their most affected
key populations will have greater impact in ending AIDS by 2030.
11
INTRODUCTION
Background
Malaysia is a country with concentrated HIV epidemic with infection rates remain above 5%
among key populations (KPs) especially people who inject drugs (PWID), female sex workers
(FSW), transgender (TG) and men who have sex with men (MSM). PWID was the main driver
bearing the brunt of about 70-80% of all new reported cases, yet the trend has started to decline
constantly beginning 2004 and reached 3% in 2018. It is estimated that about 87,041 people
living with HIV (PLHIV) in Malaysia in 2018, in which only 75,040 (86%) PLHIV who know their
HIV status. PLHIV in Malaysia is generally predominant among males (82.9%). The national
surveillance system indicated that the new HIV reported case has declined by 50%, while new
HIV/AIDS reported death has stabilized from 2000 to 20181. Malaysia had been significantly
making progress in expanding antiretroviral (ARV) availability and accessibility as it became
the integral component of care continuum, treatment, and prevention back in 1990. While
approximately 41,486 (48%) PLHIV were on life-saving antiretroviral therapy (ART), the
proportion of women (71%) getting ART was higher than that of men (43%) by the end of 2018.
Therefore, there is much more work to do for Malaysia to achieve 90-90-90 treatment cascade
targets in the global scale.
To predict the future trend of HIV and to assist in the appropriate national strategic planning,
we embarked upon a process of constructing a national epidemic model for 2018 using AIDS
Epidemic Model (AEM) and Spectrum tools. The analytical work and review process started in
February 2019 to November 2019. A technical Working Group consist of expert in National HIV
program, behavioral survey, M&E, representatives from civil societies and UNAIDS was
responsible in collecting, collating, analyzing and triangulating data from various programmatic
and survey data.
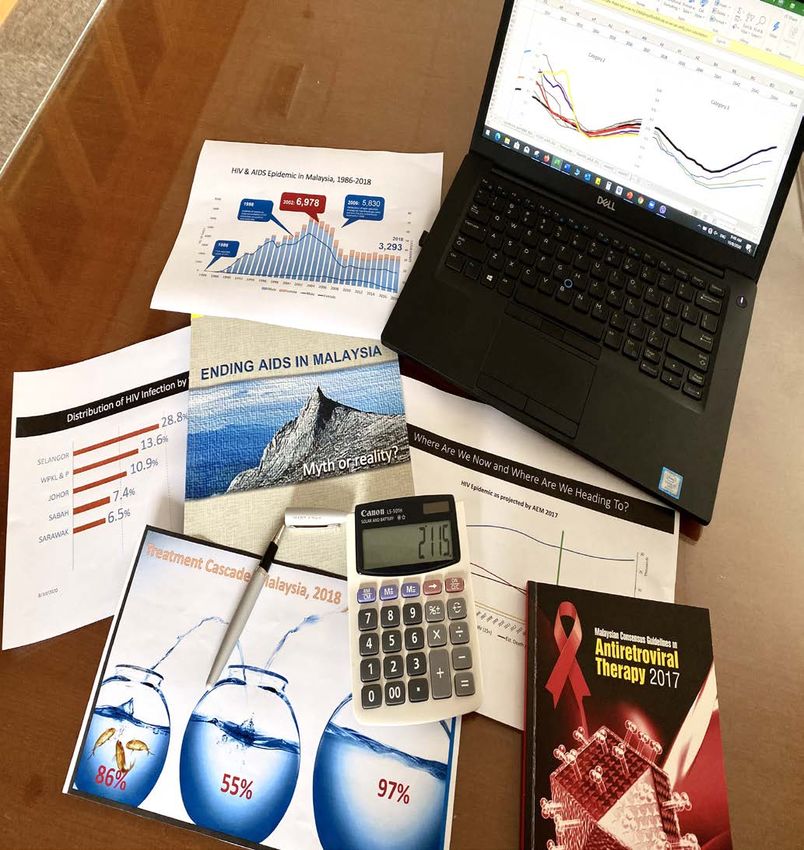
Treatment Cascade, Malaysia, 2018
Gap to reach the 1st Gap to reach the 2nd
90: 12,001 90: 33,639
80,000 Gap to reach the
3rd 90: 1,316
60,000
40,000 86%
55% 97%
20,000
0
PLHIV who know their PLHIV on ARV PLHIV who are virally
HIV status suppressed12
A series of technical workshop were conducted between March 2019 to November 2019 to
develop, validate and analyze a baseline HIV model and estimates for national and subnational
with expert assistance from East-West Center, Hawaii, Dr Wiwat Peerapatanapokin and
UNAIDS data specialist, Dr Khin Cho Win Htin.
AIDS Epidemic Model (AEM)
The AIDS Epidemic Model (AEM) is an adult behavioral process model that generates the HIV
estimates for the population 15 years and above. It is developed by the East-West Center with
support from USAID, UNAIDS, Family Health International, World Health Organization, and
World Bank2. It is mainly used for countries with concentrated epidemics, in which the models
allow countries to build locally tuned models that represent their epidemiological situation.
These models can then be used with a set of analytic tools—the AEM Workbooks (Baseline,
Intervention, and Impact Analysis)—to prepare scenarios that analyze alternative responses to
the epidemic, assess the impact of these responses, and estimate the cost of their
implementation. These scenarios provide essential inputs to national strategic planning
processes, help countries allocate their resources more efficiently, and to identify weaknesses
that must be addressed to strengthen their responses.
The inputs for AEM fall into a number of general categories and are primarily behavioral in
nature:
• The sizes of key populations (total male and female population, male clients, direct and
indirect female sex workers, IDUs, MSM, etc.).
• Sexual risk behaviors (frequency of sexual contact between different partner types,
levels of condom use with different partners).
• Injecting risk behaviors (frequency of injection, levels of sharing).
• Average duration in different key populations (average time in sex work, average time
as a client, etc.).
• Levels of sexually transmitted diseases (STIs by type of partner, e.g., among sex
workers, general population couples, etc.)
• Coverage of ART
• HIV progression and mortality rate (among PLHIV who are on ART and who are not on
ART)
These inputs were used to calculate the number of new infections, PLHIV, and deaths among
each sub-population and total population.13
AEM tool suite includes 3 major workbooks – a) AEM baseline workbook; b) AEM intervention
workbook; and c) AEM analysis workbook (Figure 1). However, in this report, we only develop
National and subnational AEM baseline workbook.
AEM Baseline Collect data to create an AEM projection that replicates
the current epidemic: Stored in an AEM baseline file.
AEM Intervention Create a set of policy scenario (intervention mix,
coverage, cost, and effectiveness) within AEM
Workbook intervention workbooks.
Use the AEM Impact Analysis workbook to import these
AEM Analysis
scenarios and compare them.
Figure 1: Overview of AEM workbook
Spectrum
The software package Spectrum (https://www.avenirhealth.org/software-spectrum.php) is used
to produce estimates of adult incidence, prevalence, and mortality, as well as estimates for
children infected via mother-to-child transmission. Spectrum uses the prevalence curves
(recent versions of Spectrum allow users to import incidence curve from other modeling tools
or directly input incidence curve) and applies a set of assumptions to produce age and sex-
specific estimates of incidence, prevalence, and mortality for adults and children3. These
assumptions are: i) female-to-male prevalence ratio; ii) effects of HIV on fertility; iii) mother-to-
child transmission of HIV; iv) survival time from infection to death (for adults and children); v)
age patterns of prevalence; and vi) effects and coverage levels for ART. The latest version of
Spectrum (version 5.756) which was used in this consensus workshop can read incidence from
AEM output file directly and use this information along with other inputs and assumptions to
calculate the impact of the epidemic.14
AEM-Spectrum
The limitation of AEM is that it can only generate the HIV estimates for the population 15 years
and above, therefore we need to import the incidence trend from AEM model into spectrum
software. This process is required to generate the national estimates that include adults (15+),
children (0-14) and components of mother-to-child transmission of HIV (MTCT).
Objectives
The objectives of the report are:
i. To document the process, methodologies including assumptions, inputs, calculations,
data triangulation and as well as the consensus agreement of national and subnational
AEM and Spectrum update processes
ii. To provide summary of national and subnational HIV estimates
HIV estimates are the center piece of strategic information in tracking the
progress towards ending AIDS targets. It is crucial that HIV estimates truly
reflect the current state of epidemic to inform and guide the responses
towards HIV elimination.15
METHODOLOGY
National Consultative Workshops
There were series of National Consultative Workshops conducted between March 2019 and
November 2019. Participants of these workshops includes AEM consultant from East-West
Centre Hawaii, data specialist from UNAIDS, National HIV Consultant from MOH Malaysia and
representatives from Malaysia AIDS Council. The outcomes of the workshops were to develop
National AEM Baseline workbook, to update National Spectrum file and to develop subnational
estimates. The final findings were presented, discussed, and finalized with inputs and
consensus agreement by stakeholders.
National Estimates
AEM software and Spectrum software were used for national estimation and projection. First,
national AEM baseline model was developed to simulate the epidemic situation for adults
(including key population and general population) in the country from the past to the present.
This AEM baseline model also projects the epidemic situation to the future with assumptions
that the risk behaviors and treatment coverage remain the same level as in 2018. Then overall
adult incidence rate and female to male incidence ratio from AEM baseline model were used
as inputs for Spectrum. With these inputs from AEM and other inputs including ART inputs and
inputs related to mother to child transmission, Spectrum then generated both adult and child
HIV estimates.
Data inputs and assumptions in the AEM
For the AEM data updates, all the relevant documents that were reviewed are listed below:
a) Country population: Population data including demographic information for adults aged 15+
(by age and gender) is based on UN population division data from 1970 to 2050 which were
retrieved from Spectrum V5.756.
b) Population size estimates (PSE) for key populations (KP) derived from the recent PSE for
KP4.
c) Behavior data from five (5) studies:
a. Behavioral Surveillance Survey (BSS), 2004.
b. Integrated Bio-Behavioral Surveillance Survey (IBBS), 2009.
c. Integrated Bio-Behavioral Surveillance Survey (IBBS), 2012.
d. Integrated Bio-Behavioral Surveillance Survey (IBBS), 2014.
e. Integrated Bio-Behavioral Surveillance Survey (IBBS), 2017.16
All the data inputs on key population using the reviewed documents are summarized in Annex
1. Whenever necessary, data were interpolated for missing values and weighted to get national
representativeness. Data were entered into AEM worksheets using AEM Tool as projection
engine. Baseline estimates and projections resulting from the model were finally validated with
national surveillance data and other available programmatic data.
Data inputs in the Spectrum
The AEM baseline workbook was imported into the Spectrum software V5.756. The defaults
data and parameters for population and migration, mother-to-child transmission (MTCT)
transmission probabilities, adult and paediatric HIV transition parameters were maintained.
Whilst data such as Prevention of mother-to-child transmission (PMTCT) program, children (0
to 14 years) on ART, adults (15+ years) on ART and viral load suppression were input based
on data from different sources from programmatic data (Annex 2).
Spectrum output on the impact of the epidemic explored as follow:
• People living with HIV and AIDS.
• New infections
• AIDS deaths
• Treatment needs (e.g., number of children and adults in need of ARV treatment)
• Treatment coverage
• PMTCT
National AEM and Spectrum comparison and adjustments
The results of the following indicators from AEM worksheet file and Spectrum were then
compared to check the consistency of the outputs and results and adjusted accordingly if
needed:
• Number and trend of adults (aged 15+) living with HIV.
• Number and trend of new infections among adults (aged 15+)
• Number and trend of AIDS related deaths among adults (aged 15+)17 Subnational Estimates Disaggregation analysis method Disaggregation analysis using “proxy incidence” method was used to get the incidence rate by sex and subnational. The basic principle of this method is the use of proxy indicator for incidence and building on that, incidence proportion is calculated for sub-nationals (with assumption that proxy incidence proportion is the same as incidence proportion). The national TWG reviewed all the available data sources to get the best proxy incidence indicator such as ANC prevalence data, HIV surveillance data, pre-marital HIV screening data and voluntary counselling and testing (VCT) screening data. Finally, the ANC prevalence data as proxy incidence rate for female were selected to calculate proxy incidence proportion. As for male, we selected proportion from reported HIV cases as proxy incidence proportion. New infections by subnational were then calculated by multiplying proxy incidence proportion for each subnational to total national new HIV infections derived from national AEM/Spectrum. Demographic data by subnational is required by this method. It was calculated by multiplying proportion for each subnational to total national population age 15 to 49 by sex using the demographic data age 15 to 49 for each subnational5. Details on the steps of the calculation as in Annex 3. Subnational Spectrum To get the HIV estimates for each subnational, the latest National Estimations and Projections 2018 were imported into the Spectrum Software version 5.756 data file to create a template in Spectrum file. The incidence input for this template was then changed to use “Direct Incidence Input” option. Using the template, a spectrum file for each subnational was generated. The calculated subnational incidence rate from the disaggregation analysis method above, female to male incidence ratio, demographic data, and program statistic data (from National Surveillance Database) were then entered into the subnational spectrum template to generate other estimates measures such as PLHIV and AIDS-related deaths (Figure 2).
18

    Spectrum template
     based on national
                                          Demographic and
     AEM-Spectrum.
                                     Epidemic calculations
                                      -     Mother-to-child       Results:
       Subnational                                                • PLHIV
                                            transmission
                                                                  • New infection
    Demographic data                        Child model
                                      -                           • AIDS Death
                                      -     Adult model           • Need for ART.
                                                                  • PMTCT
   Subnational Program
         statistics

        Subnational
                                          Incidence rate (using
     Surveillance data
                                       disaggregation method)

Figure 2: AEM-Spectrum Process for Subnational Estimates
19 RESULTS National HIV Estimates The national HIV estimates were based on the output generated from AEM and Spectrum package using the baseline scenario. The Baseline scenario is referred to the impact of HIV epidemic based on maintaining risk behaviors, prevention coverage, and treatment coverage as in 2018 (assuming no additional intervention after that or “business as usual”). People Living with HIV (Adults 15+) Figure 3 showed the trend of estimated PLHIV in Malaysia from 1985 to 2020. Since the beginning of the epidemic, proportion of male PLHIV remained higher than that of female. Total number of adults PLHIV had reached its peaked in 2003 and remained flat line until 2016 where it started to bounce back. This is contributed by the increased of male PLHIV since 2016 while the proportion of female PLHIV remained stable since 2011. Figure 3: Trend of estimated PLHIV in Malaysia (aged 15+), 1985 - 2020
20

New HIV Infections (Adults 15+)
Figure 4 depicts the national trend of estimated new HIV infections with males dominate the
epidemic since the early phase of the epidemic as projected. There were two peaks in the
graph. The first peak is in 1992, where the new HIV infections among adults 15+ has reached
the highest point and then reduced to almost half in 1996. This trend gradually increased and
reached its second peak in year 2001, thereafter stabilizing. However, in 2018, the trend of new
infections started to escalate dramatically especially among male. While new HIV infections
among female remained unchanged since 1997. The estimated new HIV infections among
adults 15+ in 2019 was 6,273.

Figure 4: Trend of estimated new HIV infections by gender in Malaysia, 1985 – 2020
21

Adults (15+) New HIV Infections by Risk Population
As exhibited in Figure 5, the new HIV infections at the beginning of the epidemic was dominated
by IDU until 2002. Since then, the share of total new HIV infections contributed by IDU has
gradually reduced to only 3.7% in 2019 (Figure 6). By 2019, majority of new HIV infections are
among MSM, a significant increase from only 18% to 66% between 2010 and 2019.

Figure 5: Annual New HIV Infections by risk population in Malaysia, 1985 - 2020

Figure 6: Annual New HIV Infections Proportion by risk population in Malaysia, 1985-2020
22

Subnational HIV Estimates
The subnational HIV estimates will be based on outputs generated from Spectrum Software.

HIV Prevalence by subnational
Using the data input by subnational, the HIV prevalence by subnational from 1990 to 2018 were
plotted. Based on the graph, the HIV epidemic in Malaysia can be summarized into 4 categories
as below:

    A. Category 1 (Figure 7): Subnational with prevalence above national average and
       increasing. The subnational in this category are Kuala Lumpur (KL).
       Kuala Lumpur is the only subnational in this category. Its HIV prevalence has constantly
       following above the national average. However, this trend accelerated past the national
       trend in 2011.

    B. Category 2 (Figure 8): Subnational with prevalence above national average and
       decreasing. Subnational in this category include Johor, Perlis, Pahang, Terengganu,
       Negeri Sembilan, and Kelantan. All subnational in this category have always remained
       above the national average in the early phase but gradually declining.

    C. Category 3 (Figure 9): Subnational with prevalence below national average and
       stabilizing. Kedah, Penang, and Perak fall in this category with the HIV prevalence trend
       following below the national average and stabilizing.

    D. Category 4 (Figure 10): Subnational with prevalence below national average and
       increasing. In this category, four (4) subnational have HIV prevalence below the
       national average, but gradually increase with two (2) subnational (Melaka and
       Selangor) surpassed the national average in 2015. The subnational in this category is
       Melaka, Selangor, Sarawak, Sabah, and Labuan.
23
0.7
0.6
0.5
0.4
0.3
0.2
0.1
0
National 06-KL
Figure 7: HIV Prevalence for Category 1, 1990-2018
1
0.9
0.8
0.7
0.6
0.5
0.4
0.3
0.2
0.1
0
National 01-Perlis 07-NS 09-Johor
10-Pahang 11-Terengganu 12-Kelantan
Figure 8: HIV Prevalence for Category 2, 1990-201824
0.4
0.35
0.3
0.25
0.2
0.15
0.1
0.05
0
National 02-Kedah 03-Penang 04-Perak
Figure 9: HIV Prevalence for Category 3, 1990-2018
0.45
0.4
0.35
0.3
0.25
0.2
0.15
0.1
0.05
0
National 13-Sarawak 14-Sabah
15-Labuan 08-Melaka 05-Selangor
Figure 10: HIV Prevalence for category 4, 1990-201825
HIV Incidence (per 1000 population)
The trend for HIV incidence is almost similar to that of HIV prevalence. Therefore, for purpose
of reporting, the subnational were categorized into 4 categories as in HIV prevalence. Overall,
the new infections gradually declined for all subnational from year 2002 until 2015, after which
the new infections for Malaysia began to surge for all subnational in all categories with Selangor
and Kuala Lumpur contributed most of the HIV cases (Figure 11, Figure 12, Figure 13, and
Figure 14). If the interventions continue at the present level, it is predicted that by year 2030,
incidence rate per 1000 population for Selangor and Kuala Lumpur will continuously increase
while remain almost similar to national average. The epidemic is concentrated in Selangor,
Kuala Lumpur, and Johor as it contributes 50% of the new HIV cases in Malaysia (Figure 15).
1
0.9
0.8
0.7
0.6
0.5
0.4
0.3
0.2
0.1
0
National 06-KL
Figure 11: Incidence per 1000 population for category 1, 2000 – 203026
National 01-Perlis 07-NS 08-Melaka
0.7 09-Johor 10-Pahang 11-Terengganu 12-Kelantan
0.6
0.5
0.4
0.3
0.2
0.1
0
Figure 12: Incidence per 1000 population for category 2, 2000-2030
National 02-Kedah 03-Penang 04-Perak
0.45
0.4
0.35
0.3
0.25
0.2
0.15
0.1
0.05
0
Figure 13: Incidence per 1000 population for category 3, 2000-203027
National 13-Sarawak 14-Sabah 15-Labuan 05-Selangor
0.6
0.5
0.4
0.3
0.2
0.1
0
Figure 14: Incidence per 1000 population for category 4, 2000-2030
01-Perlis 02-Kedah 03-Penang 04-Perak 05-Selangor
10000 06-WPKL 07-NS 08-Melaka 09-Johor 10-Pahang
9000 11-Terengganu 12-Kelantan 13-Sarawak 14-Sabah 15-Labuan
8000
7000
6000
5000
4000
3000
2000
1000
0
Figure 15: Subnational contributions for new infections, 1990 – 203028
PLHIV by Subnational, 2018 – 2022
Estimated number of PLHIV by subnational from 2018 to 2022 are as presented in Table 1. The
top 5 subnational with the highest number of PLHIV in 2019 are Selangor (24% of total PLHIV),
Johor (13%), Kuala Lumpur (10%), Kelantan (9%) and Pahang (8%). As for new HIV infections,
in 2019, Selangor has the highest proportion of new HIV infections in Malaysia (29%) seconded
by Kuala Lumpur (14%) and Johor (11%).
Table 1: PLHIV and new HIV infection by subnational, 2018 - 2021
Subnational PLHIV New Infection
2018 2019 2020 2021 2022 2018 2019 2020 2021 2022
Perlis 808 825 846 873 906 46 51 57 63 69
Kedah 4442 4529 4637 4772 4937 233 258 286 317 350
Penang 3728 3880 4055 4256 4488 259 287 318 352 389
Perak 4904 4948 5011 5098 5216 232 257 284 315 348
Selangor 19933 21120 22413 23839 25422 1621 1792 1982 2194 2421
KL 8655 9239 9878 10585 11368 768 849 939 1039 1146
NS 3542 3618 3719 3849 4009 221 245 271 300 331
Melaka 2725 2832 2949 3082 3232 180 199 220 244 269
Johor 11294 11487 11729 12033 12414 616 681 754 834 921
Pahang 6802 6762 6738 6738 6771 248 275 304 337 372
Terengganu 5598 5513 5441 5390 5336 177 196 217 240 265
Kelantan 8157 8046 7946 7870 7826 241 267 296 328 363
Sarawak 3205 3613 4055 4533 5051 420 464 514 569 628
Sabah 3422 3765 4135 4533 4965 365 403 446 495 546
Labuan 118 137 158 180 204 19 21 23 25 26
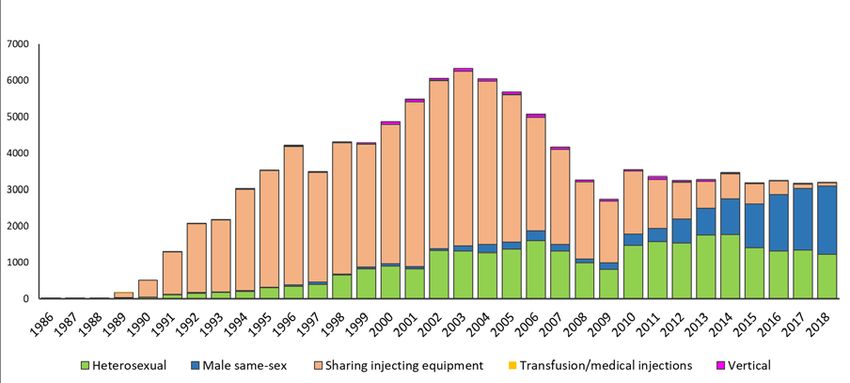
Total (National) 86,616 89,626 93,072 97,063 101,684 5,638 6,236 6,903 7,641 8,43629 DISCUSSIONS Malaysia has seen reduction of new cases by more than half from 2000 peak but in 2015 onwards, the trend has reached a flat line. This phenomenon is also seen globally and regionally, where the declining in new HIV infections in the past 8 years has been stalled and far from Ending AIDS fast-track target year 2020 (Figure 16). Figure 16: Global and Regional Progress on HIV Infection, 1990-2018 As exhibited in the National HIV data in Figure 17, new HIV cases increased from the beginning of the epidemic and peaked in year 2002. Subsequently, this trend has declined and stabilized until 2016. Given that IDU is the main mode of transmission for HIV infection in Malaysia during the earlier phase, the decline in new cases may be contributed by few reasons among others; (1) the success of the National Harm Reduction program introduced in 2005; and (2) changing addiction behavior among PWID from injecting to taking oral drugs. For the past one decade, the country has observed significant changes in the HIV epidemic landscape from predominantly sharing injecting equipment to more sexual transmission (Figure 18). These changes may contribute to dramatic increase in HIV incidence after 2018 as projected by Spectrum (Figure 4).
30

                    8000                                  2002:
                    7000                                        6978
                                                                                                                              2018:
                    6000
                                                                                                                                      3293
  Number Of Cases

                    5000

                    4000

                    3000
                              1986:
                    2000              3
                    1000

                       0
                           1986

                                  1988

                                          1990

                                                 1992

                                                        1994

                                                               1996

                                                                      1998

                                                                             2000

                                                                                    2002

                                                                                           2004

                                                                                                  2006

                                                                                                         2008

                                                                                                                2010

                                                                                                                       2012

                                                                                                                               2014

                                                                                                                                      2016

                                                                                                                                             2018

                                                                                                                                                    2020
Figure 17: National HIV data, new cases, 1986 - 2018

Figure 18: Distribution of HIV Infection by Mode of Transmission in Malaysia, 1986-2018

These changes can also be seen in the top 5 subnational reporting HIV new cases (Table 1).
At the beginning of the epidemic, majority of the new HIV cases were contributed by subnational
with high number of PWID such as Johor, Terengganu, and Kelantan. While in the recent
epidemic, majority of the new cases are mostly from Kuala Lumpur, Sabah, Sarawak, and
Selangor, where majority of the reported cases are sexually transmitted. Other subnational
such as Melaka, Labuan, Penang and Negeri Sembilan are also seeing increasing in new HIV
infections in the last 10 years (Figure 19). While percentage change in new HIV infection in
Kelantan, Pahang, Terengganu, and Perak is decreasing since 2010.
31
5
4
3
Percent change
2
1
0
-1
-2
-3
-4
-5
Figure 19: Percentage change in new infection by subnational, 2010-2018
In 2018, the top 5 subnational (Selangor, Kuala Lumpur, Johor, Sarawak, and Sabah)
contributed almost three quarter (70%) of the new HIV cases in Malaysia. Three of five
subnational (Selangor, Kuala Lumpur, and Johor) are the most developed hence urbanized
subnational while Sabah and Sarawak are separated and located in Borneo island.
Urbanization may have negative impact to the HIV epidemics in Malaysia with dense population
due to migration, young, mobile, diverse populations, they are easy target for social problem.
One interesting finding is observed in Penang, an island-state off the northwestern coast of
Peninsular Malaysia with capital city Malaysia's second largest and takes up the third position
in economy after Selangor and Johor. Contrary to its urban counterparts, Penang’s HIV
prevalence had remained lower than the national average. One critical observation that make
Penang different from the rest of the subnational – it has a well-established NGO that provide
sexual and reproductive health services, supported by many volunteers among health
professionals from both the private and government health facilities. In addition, strong support
from state health department in implementing the prevention and control programs is also a
plus factor.
Top 5 subnational with highest HIV new infection in 2018:
Selangor, Kuala Lumpur, Johor, Sabah & Sarawak32 ENDING AIDS 2030: FUTURE ENDEVEOURS In preparing for our National Strategic Plan for Ending AIDS 2016-2030, we used AEM model to help the country to generates options that will guide the country in future planning6. However, due to unique demographic structure of each subnational, the interventions planned based on the national AEM model may not fit for all subnational. From the projection data, we concluded that the epidemic in Malaysia is driven by five (5) subnational - Kuala Lumpur, Selangor, Johor, Sabah, and Sarawak. The main risk of infection has shifted from sharing of injecting paraphernalia among PWID to sexual risk especially among the MSM. Focusing effective strategies and interventions at these five subnational and their most affected key populations will have greater impact in ending AIDS by 2030. However, if the interventions continue at the present level, the model predicted that the new HIV cases will continue to rise from 2018 onwards. A situational analysis is indeed required to these subnational to ascertain the main driver of the epidemic for a comprehensive and effective interventions.
33

ANNEX 1
Data Input for Malaysia AEM Worksheet
Data Input for Malaysia AEM baseline worksheet is based on the following sources.
Adjustments and assumptions are made when necessary and they are also described in the
document below. The percentage of the in between data points are interpolated and the trend
after the last available data point is kept constant using the last data point percentage. In this
AEM Model, only FSW1 (direct FSW), MSM1 (reachable), MSM2 (not reachable), TG and Male
PWID data are used. Other groups of KPs are not included.

1. Heterosexual sheet
a) FSW1 size estimate

Based on the Consensus 2014 which is 21,000 FSW in 2013 (0.23%). We maintained using
this size estimation throughout from 1975 to 2014. The FSW size estimation was then changed
to 22,000 in 2018 based on the new size estimation of KP study (Malaysia, 2018). Only 1 group
of FSW is modeled (FSW1).

b) Number of clients per day / Days worked per week.

Based on IBBS 2017, the average number of clients is taken as 1.2 per day. Number of days
work per week is 5 days.

c) Percent condom use

Percentage of condom use is assumed at 15% from 1975 to 1990, increasing to 45% in 1995
(Singh & Croft 1992). Then, the trend is increase to 55% in 2000 (Choon et. al. 1997). Using
the IBBS study data in 2012, 2014 and 2017 (after adjusting for over-reporting), the percentage
of condom use frequency with clients (always use) is 63.7%, 61% and 63.9%% accordingly.
The percentages in between are interpolated. The trend after 2017 is kept constant at 63.9%
onwards.

d) Duration of selling sex (year)

The average duration of sex work is taken as 5 years from 1975 to 1990. It is then increased to
12 years in 2012, 14 years in 2014 and 18 years in 2017 which is based on the IBBS studies.
34

The duration in between is interpolated. The duration of 18 years is constant from 2017
onwards.

e) STI prevalence among FSW1

Based on a study by Ramachandran & Ngeow, 1990, total STI incidence is 40.75%. Since this
study was performed in only one site, a reduction of ¾ was used to represent the national
incidence. With assumptions of (1) a person may get infected with STI with average of 4 times
a year and (2) duration of STI of 0.17 year (2 months), the STI prevalence of 7.1% was then
calculated based on formula of prevalence equal to incidence multiply with duration
(Prevalence = Incidence x Duration). The STI prevalence of 7.1% was used to represent
national STI prevalence starting from 1975 onwards until 1990. The STI prevalence was
assumed to reduce at 6.1% in 2014 using data collected from IBBS 2014, which is supported
by an increase in condom use from the same survey. The prevalence was then interpolated in
between while the trend after 2014 is kept constant at 6.1% onwards.

f) Percent of males aged 15-49 visiting sex workers in last year.

The percentage of males visiting sex workers is set to 6.8% (IBBS 2014). The percentage from
1975 and 2014 was interpolated to get the percentage in between and the percentage of 6.8%
was kept constant from 2012 onwards.

g) Duration of buying sex.

Duration of buying sex is derived from IBBS 2014. Based on this survey duration of buying sex
is calculated by subtracting median age of male who came for premarital screening (28 years)
with median age at sex debut (19 years). Therefore, we assume that duration of buying sex
among male is 9 years.

h) Percent of adult males who are circumcised.

Based on country demographic pattern, Muslim contribute to 65% of total population. We
assume that all Muslim males are circumcised.

i) Percent of males engaging in casual sex in the last year.

Based on 2009 HIV Expert Consensus, percent of males engaging in casual sex is 5%.
35

j) Percent of females engaging in casual sex in the last year.

We take percent for female as half of that in male population (2%).

k) Percent condom use with casual partner.

The percentage of condom use before 2004 is set at 10.5% - calculated based on weighted
average of condom use found in BSS 2004. The percentage of condom use in 2009 is 11.8%
(scale down by half to adjust for general population from IBBS 2009). The percentage is
interpolated in between those values. The percentage was constant from 2009 onwards.

l) Average number of sex contacts in the last year (male).

Since there is no available data, we leave this number at default value (15).

m) Number of sexual contacts with spouse or regular partners (per week).

Number of sexual contacts is set at 1 per week.

n) Percent condom use with spouses or regular partners.

The percentage of condom use with spouses or regular partner was set at 2.0% before 1990.
Assuming that most PLHIV are PWID in Malaysia, the percentage of condom use with spouse
or regular partner is taken as percentage of condom use with spouse among PWID which is
32.3% (IBBS 2012). The percentage are interpolated in between those values and was set as
constant from 2012 onwards.

o) STI prevalence in adult population.

The STI prevalence (0.7%) is based on sero-prevalence rate in Western Pacific region.

2. PWID Sheet
a) Percent of adult males 15-49 years of age who inject drugs.

We estimate that the current PWID population at 170,000 based on 2009 consensus. We
maintained using this size estimation throughout from 1975 to 2005. The size estimation of IDU
36

was then changed to 75,000 in 2018 based on the new size estimation of KP study (Malaysia,
2018) which is approximately 56% reduction from the 2009 estimates.

b) PWID mortality

PWID mortality in this exercise is estimated at 1.1% based on MOH Malaysia report 2009.

c) Percent of PWID in high-risk networks

This parameter is considered as a model fitting parameter and the value of 30% was used as
it provided the best fit for HIV prevalence among PWID.

d) Percentage of male PWID who share needles.

For earlier data point (1975 to 2004), we take the mid-point (60%) of data derived from 2 studies
– BSS 2004 and BSS 2007. Data points for 2014 and 2017 are then based on the IBBS study
which is 27.4% and 20.3% respectively. The percentage in between is then interpolated. The
trend is constant from 2017 onwards.

e) Percentage of injection shared among PWID who shared needles.

The percentage is calculated based on median of frequency of needles shared among PWID
who shared needle in BSS 2004 and CAHR 2011 study, which fall in ‘half of the time sharing’.
Thus, 50% were used to get the frequency of injections were shared among PWID who shared
needles from 1975 to 2000. While data point for 2004 were based on the BSS 2004 which is
30% while 19% were used for 2014 data point which is based on the IBBS 2014 study. The in
between data point from 2000 to 2014 are then interpolated while the trend is kept constant
from 2014 onwards.

f) Number of injections each day.

Data points for 1975 to 2004 are based on finding from BSS 2004 i.e., 3 times/day. Data points
from 2012 onwards are based on IBBS 2012, IBBS 2014 and IBBS 2017 i.e., 2.6, 2.4 and 2.0
times/day, respectively. Data from 2004 are interpolated to 2017 and then kept constant from
2017 onwards.
37

g) Average duration of injecting (years).

The average duration of injections is derived from BSS 2004 i.e., 15 years and is used to fit in
data points from 1975 to 2004. Subsequent data points in 2004, 2012 and 2014 are using
finding from BSS 2004, IBBS 2012 and IBBS 2014. The in between data points are then
interpolated and is kept constant from 2014 onwards.

h) Percent visiting female sex workers.

Based on average of 5 studies (BSS 2004: 11.1%, IBBS 2009: 15.1%, CAHR 2011: 22%, IBBS
2012: 8.4% and CAHR 2014: 7.1%), percent visiting female sex workers are set at 12.74% for
all years.

i) Percent condom use with FSW1.

Assuming the data is similar with the percentage of condom use with clients for FSW group 1
in the heterosexual sheet.

j) Percent condom use with spouse or regular partner.

As there is no available data or study in early years, we assume the percentage of condom use
is 2% from 1975 to 1990. The percentages of condom use are 11.7% (BSS 2004), 19.1% (IBBS
2009), 32.3% (IBBS 2012), 30.0% (IBBS 2014) and 28.4% (IBBS 2017). Percentages in
between are interpolated.

k) Number of sexual contacts with regular partner.

We use number of sexual contacts 1 per month or 0.20 per week and set same value throughout
the years (Drug and Alcohol Dependence 2011).

3. MSM Sheet

MSW population is not considered in this AEM Model because of unavailability of data.

General MSM
a) Percentage of males aged 15-49 engaging same sex behavior is set at 2% from 1975 to
   2006 based on National Health Morbidity Survey 2006. The size estimation of MSM was
38

   then changed to 220,000 in 2018 based on the new size estimation of KP study (Malaysia,
   2018) which is approximately 2.5% of male adult population.
b) Percent of MSM in risk group 1 is considered proportion reachable and is set at 30% from
   1975 to 2010 based on consensus in 2010. Based on the new size estimation of KP study
   (Malaysia, 2018), approximately 156,000 MSM are reachable through social media in 2018
   which is about 70.9% of total MSM.
c) Shift from MSM group 1 to group 2 (non-reachable) is assumed at 5% based on consensus.

MSM1 population
a) Percent engaging in anal sex in the last year is set at 95% consistent to the findings from
   IBBS 2009 and IBBS 2012 at 95% and 94.3% respectively.
b) Number of anal sex contacts in the last week is taken at 2.0 based on IBBS 2012, IBBS
   2014 and IBBS 2017.
c) Average duration of same sex behavior is set at 13 years based on IBBS 2012 and IBBS
   2014.
d) Percentages of MSM1 with female partners are based on multiple studies, i.e., Kana & Koh
   2008 (17.8%), VDTS 2009 (16.7%), IBBS 2014 (18.3%) and IBBS 2017 (20.8%). The
   percentage of 17.8% is used from year 1975 to 2008. The percentages in between the data
   points are interpolated to produce trend between year 2009 and 2017. 20.8% is used after
   2017.
e) Percentages of condom use in anal sex with MSM1 are based on several data points from
   Kana & Koh 2008 (23.5% condom used last anal sex), VDTS 2009 (31.4% condom used
   last anal sex), IBBS 2014 (56.7% always used condom) and IBBS 2017 (65% always
   condom used). Earlier data points (1975 to 1985) were taken at 10% assuming there was
   no awareness program for MSM. Data in between are interpolated to get the trend. The
   percentage of 65% is used after 2017 onwards.
f) STI prevalence among MSM1 is based on VDTS 2009 (6.8%), IBBS 2014 (8.1%) and IBBS
   2017 (14.7%) of MSM reported to be tested and have STI. Data in between are interpolated
   to get the trend. The percentage of 14.7% is used from 2017 throughout.

MSM2 population (non-reachable)
Data points for this sub-population are based on assumption as below.
a) Percent engaging anal sex is assuming as half of that of MSM1 (47.5%).
b) Number of anal sex contact in the last week is 0.25 (less by 5 times) compared to MSM1.
c) Average duration of same-sex behavior is set at same proportion as MSM1 (25 years)
d) Percentages of MSM2 with female partner equals to those of MSM1.
e) Percentages of condom used in anal sex with MSM2 equals to those of MSM1.
39

f) STI prevalence among MSM2 is 1.4% which is 5 times lower than that of MSM1.

4. Transgender Sheet

5.1 Transgender population - General
a) Percent of males aged 15-49 who are TG is set at 0.17% throughout the years from 1975
   to 2050 based on the new size estimation of KP study (Malaysia, 2018).
b) Percent of TG who sell sex is 85% in 2009 and 87% in 2014 based on IBBS 2009 and IBBS
   2014. The in between data points are then interpolated and data points from 2014 onwards
   are kept constant at 87%.
c) Percent of TG who engage in casual sex but not sex work is 11.4% (IBBS 2012)

5.2 Transgender Sex workers - Sexual Behavior.
a) Percent of TG sex workers engaging anal sex with clients is 84% throughout. This is based
   on weighted average between IBBS 2009 and IBBS 2012.
b) Number of anal sex contacts in the last week with clients is set at 10 throughout the year
   based on BSS 2004 and IBBS 2012.
c) Percent of anal sex contacts with clients which are receptive is 91.6% based on IBBS 2009.
d) It is assuming that average duration selling sex (in years) is at 7 years in 1975. While in
   2014, the data points are set at 14 years (based on IBBS 2014 in which the median is 7
   years and multiplied with 2). Data points in between are interpolated and data points after
   2014 are set at 14.
e) Percent condom use in anal sex with clients is set at 10% from 1975 to 1990 (the initiation
   of awareness program). Thereafter, data points used are using the condom used last anal
   sex data in BSS 2004 (74.9%) and IBBS 2009 (82.5%) but scale down by 0.6 for each data
   points. Whereas data points for 2012 and 2017 are using frequency of condom use (always
   and often use) (52.2% and 67.3% respectively). Data points in between are interpolated and
   data points after 2017 are set at 67.3%.
f) It is assumed that prevalence of anal STI among TG is much lower than MSM1 as condom
   use behavior is better among TG (based on BSS and IBBS). Thus, percent of anal STIs
   among TG who sell sex is taken at 3.4% which is half of that of MSM1.

5.3 Transgender sex worker – client make up (sums to 100%)
Based on consensus, it is assumed that:
a) 85% of TG clients are low-risk males.
b) 7.5% of TG clients are also clients of female sex workers.
c) 7.4% of TG clients are MSM.
40

5.4 TG engaging in casual sex – sexual behavior.
a) About 92.5% of TG with casual sex partners engaged in anal sex (IBBS 2012)
b) Number of anal sex contacts in the last week is 0.96 (IBBS 2012)
c) About 91.6% of anal sex contacts are receptive (assume similar to that of TGSW)
d) Percent condom use in anal sex is assumed at 0% from 1975 to 2011. The trend is set to
   increase from 2012 and 2017 using recalculated data from IBBS 2012 and IBBS 2017 which
   is 39.3% and 52.3% respectively. The in between data points are interpolated, and data is
   set at 52.3% from 2017 onwards.
e) Percent anal STIs among TG who have casual partners is assumed half of that of TGSW
   which is 1.7%.

5.5 TG Sex Workers – Partner Make up for those with CPs (sums to 100%) Partner make-up is
the same as that of TGSW client make-up.

5.6 TG with regular partners – sexual behaviors
a) About 90% of TGs with regular partners engages in anal sex (IBBS 2012)
b) Number of anal sex contacts with regular partner in the last week is 0.4 (IBBS 2012)
c) Percent of anal sex contacts with regular partner which are receptive is taken as 91.6%
   (assume similar as TGSW)
f) Percent condom use in anal sex with regular partner is assumed at 0% from 1975 to 2011.
   The trend is set to increase from 2012 and 2017 using recalculated data from IBBS 2012
   and IBBS 2017 which is 61.9% and 61.3% respectively. The in between data points are
   interpolated, and data is set at 61.3% from 2017 onwards.
d) Percent anal STIs among transgender who have regular partners only is 0.85% (assuming
   that STI prevalence is about half of that of TG casual sex).

5.7 TG sex workers – regular partner make-up
Regular partner make-up for TGSW is assumed to be similar as TGSW client make-up. Based
on consensus, it is assumed that:
a) 85% of TG clients are low-risk males.
b) 7.5% of TG clients are also clients of female sex workers.
c) 7.0% of TG clients are MSM.
You can also read