D5.1 Methodology and specification of data interfaces and machine improvement strategy for digital twins across lifecycle phases - ITEA 3
←
→
Page content transcription
If your browser does not render page correctly, please read the page content below
Machinaide Deliverable 5.1
Public

 D5.1 Methodology and specification of
      data interfaces and machine
 improvement strategy for digital twins
         across lifecycle phases
                                      WP 5
         Author(s)           Riku Ala-Laurinaho (Aalto University), Özlem Albayrak
                             (TEKNOPAR), Bastiaan Beijer (KE-works), Benno
                             Beuting (Cordis), Zeki Çelik (Dakik), Jeroen Keiren
                             (TU/e), Tuomas Keski-Heikkilä (Aalto University), Heikki
                             Mesiä (Konecranes), Valtteri Peltoranta (Konecranes),
                             Markus Ranta (IDEAL GRP), Pauli Salminen (Aalto
                             University), Jacques Verriet (TNO)
         Version             v1.0
         Date                30/06/2021
         Confidentiality     Confidential

                                            1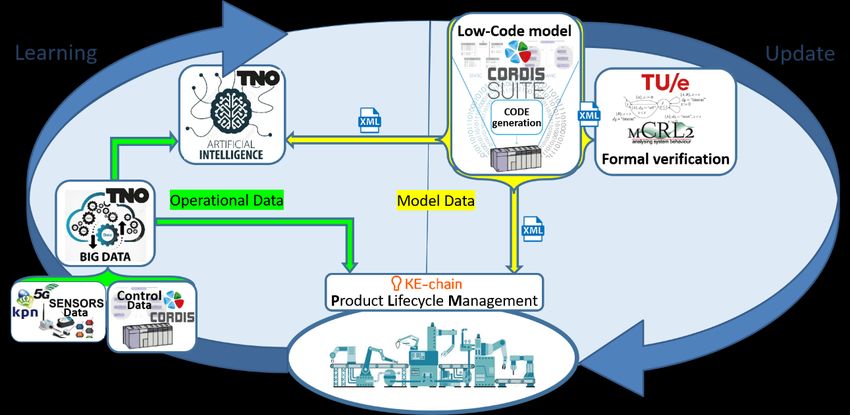
Machinaide Deliverable 5.1
Public

1. Abstract
This deliverable describes a continuous system improvement cycle including methods to support to
improve operational systems during their operational lifecycle. This improved cycle uses the data
collection work from Machinaide WP3. This deliverable presents outlines of architectures and
methods supporting the system improvement cycle; these include methods for product lifecycle
management, visualisation of system data, detection of (expected) anomalous or suboptimal
behaviour, diagnosis of anomalies, and formal verification of (updated) system specifications. A
detailed description of the architectures and methods will be included in Machinaide deliverable D5.2.

2. Change log
 Version, Date                      Description
 v0.1, 19/05/2021                   Initial draft
 v0.2, 24/06/2021                   Contributions by all partners
 v0.3, 24/06/2021                   Consolidation of partner contributions and scoping to method
                                    outlines
 v1.0, 30/06/2021                   Delivery to ITEA

                                                  2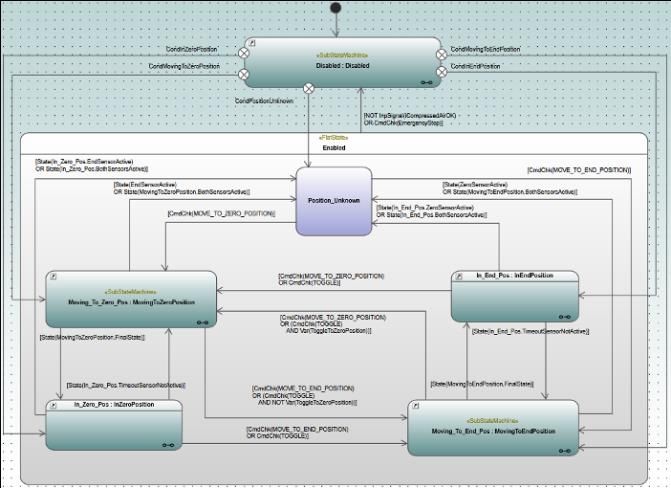
Machinaide Deliverable 5.1
Public

3. Table of Contents
1.     Abstract ........................................................................................................................................... 2
2.     Change log....................................................................................................................................... 2
3.     Table of Contents ............................................................................................................................ 3
4.     Introduction .................................................................................................................................... 4
     4.1.      System improvement cycle ..................................................................................................... 4
     4.2.      Outline..................................................................................................................................... 5
5.     Data collection ................................................................................................................................ 6
     5.1.      Operational data collection .................................................................................................... 6
     5.2.      Model data collection ............................................................................................................. 7
6.     Product lifecycle management ....................................................................................................... 8
7.     Anomaly detection and identification ............................................................................................ 9
8.     Formal verification of low-code models ....................................................................................... 11
9.     Smart Factory Ecosystem .............................................................................................................. 13
     9.1.      Crane lifecycle update requirements.................................................................................... 14
     9.2.      Grinding machine lifecycle update requirements ................................................................ 14
10.         Digital twin management through its lifecycle ......................................................................... 14
11.         Multivariate fuzzy time-series data modelling and prediction ................................................. 15
12.         Time Series Forecasting for Anomaly Detection....................................................................... 17
13.         Conclusion ................................................................................................................................. 19
14.         References ................................................................................................................................ 19
15.         Appendix: Merry-go-Round case study .................................................................................... 20

                                                                             3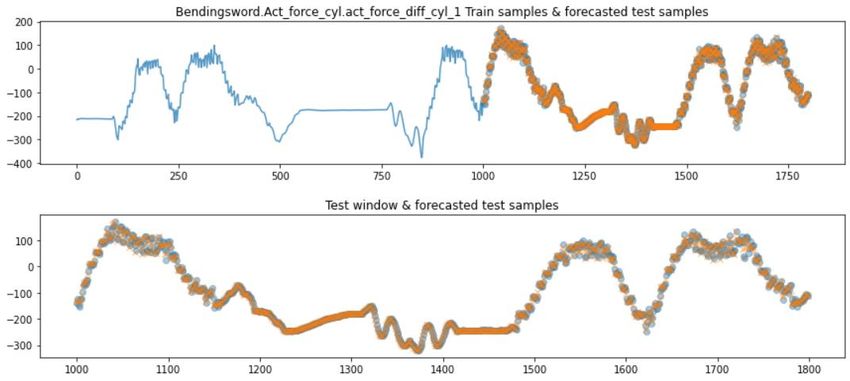
Machinaide Deliverable 5.1
Public

4. Introduction
Machinaide WP5 is dedicated to the investigation of data usage across different lifecycle phases.
Major focus is put on the exploitation of data originating from later lifecycle phases by applications
defined during earlier lifecycle phases like used for planning, engineering, coding and configuring. This
will help eliminating weaknesses and develop updates and upgrades of machine functions.

Information will be transferred via digital twins of machines. Digital twins can be defined as “digital
replicas that are accurate enough that is can be the basis for decisions given a specific purpose”
(Machinaide, 2021). The focus of WP5 is on data analysis and data mining, machine improvement
design and optimisation, verification and release of machines, machine configuration improvements,
and updates to digital twins and machines across their entire lifecycle.

Machinaide WP5 addresses several topics: the discovery of possible machine optimisations from
operational data, the design of the discovered optimisations, the verification and validation of these
optimisations, and the management of the corresponding machine updates across the entire machine
lifecycle.

4.1.     System improvement cycle
This deliverable describes methods to improve a system’s performance during its lifecycle. Figure 4.1
outlines the continuous improvement cycle of systems inspired by the well-known DevOps cycle. The
cycle can be divided into two main phases with a total of seven steps. The first phase, shown top right
in Figure 4.1, involves the monitoring and analysis of an operational system; the second phase, shown
bottom left in Figure 4.1, involves the development and deployment of system improvements.

The cycle starts from an operational system1. Operational system data, e.g. sensor and actuator data
and system controller state information, is being collected from the operational system. This can be
done using the data collection infrastructures described in Machinaide D3.1 (Machinaide, 2021). The
collected data is visualised in dashboards that allow human operators to gain insight into the
behaviour of the system. Moreover, techniques such as artificial intelligence and formal modelling are
applied to analyse specifications and data of the operational system in order to extend the overview
of the state of the operational system. If the gained insights indicate that improvements are needed
to optimise the operational system, then a system update needs to be specified and realised. After
the improvements have been verified and deployed, the cycle is closed.

The system improvement cycle shown in Figure 4.1 is built around data/information. Two types of
data can be distinguished. On the one hand, the data involves systems specification, such as CAD
drawings, control specifications, etc. On the other hand, the data involves data collected from the
operational system, such sensor and actuator data, but also controller logs.

1
  In case of greenfield development, we may also assume that the continuous improvement starts from the
system specification step.

                                                   4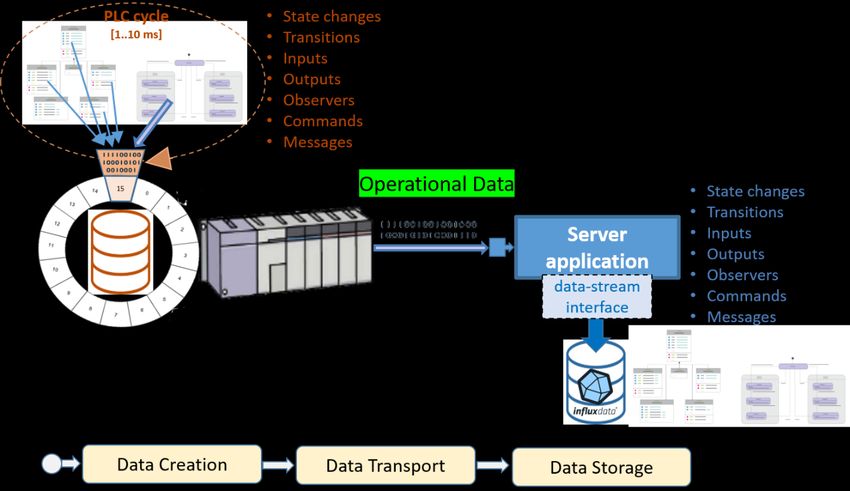
Machinaide Deliverable 5.1
Public

                                                             i

                                                                                                            Operation

                                                       1. Operation

                    7. Deployment
                                                                                                2. Monitoring
                                                                                       • Data collection (WP3)

                                                           Data
                                                        • Actuator
                                                        • Sensor
                                                        • Spec
                6. Verification &                                                                    3. Analysis
                   Validation                                                               • Anomaly detection
           • Model checking                                                                 • Root cause analysis
                                                                                            • Visualisation/dashboarding

                                 5. Realisation
                          • (PLC) Code generation
                                                                       4. Specification
                                                                 • Low code specification

          Update

                                       Figure 4.1 Continuous system improvement cycle

4.2.     Outline
Most of the steps of the continuous improvement cycle shown in Figure 4.1 are addressed in this
deliverable. Chapters 5, 6, 7, and 8 describe elements of the cycle for the Dutch use cases (Machinaide,
2021). Chapter 5 describe the collection of data, which is an element of the monitoring step in Figure
4.1. Chapter 6 describes a methodology for product lifecycle management, i.e. this involves the entire
cycle shown in Figure 4.1. Chapter 7 describes an outline of anomaly detection and identification
methods; this is part of the analysis step in Figure 4.1. The formal verification method presented in
Chapter 8 corresponds to the verification and validation step in Figure 4.1.

Chapters 9, 10 and 11 describe lifecycle-support methodologies for the Finnish use cases (Machinaide,
2021). Requirements for the crane use case and the grinding machine use case are presented in
Sections 9.1 and 9.2, respectively. Section 10 addresses the monitoring step in Figure 4.1 and Section
11 the analysis step. The former describes a method to manage digital twin data during the entire
system lifecycle. The latter uses this information for detection of anomalies, prediction of issues and
identification of system improvements.

Work on the Turkish use cases (Machinaide, 2021) is presented in Chapter 12. It considers a
methodology for system improvements for the ERMETAL use case (Machinaide, 2021) with a special
focus on predictive maintenance. The architecture addresses all steps in the operation phase of the
continuous improvement cycle of Figure 4.1.

                                                             5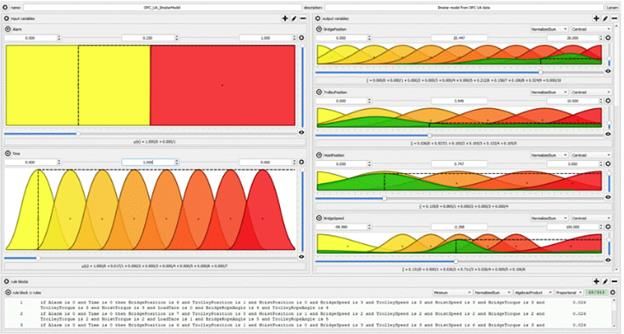
Machinaide Deliverable 5.1
Public
5. Data collection
To support the continuous improvement cycle introduced in Figure 4.1, two types of data are used for
analysing machine improvement design and optimisation, verification and release of machines across
their entire lifecycle:
• Operational system data collected from control systems and sensors in the field
• Model data from the (low-code) system design
Figure 5.1 depicts the types of data that need to be collected for the Dutch use cases. Operational
data is shown in green, model data in yellow. The collections of both types of data are addressed in
Sections 5.1 and 5.2, respectively.
Figure 5.1 Data collection for the Dutch use cases
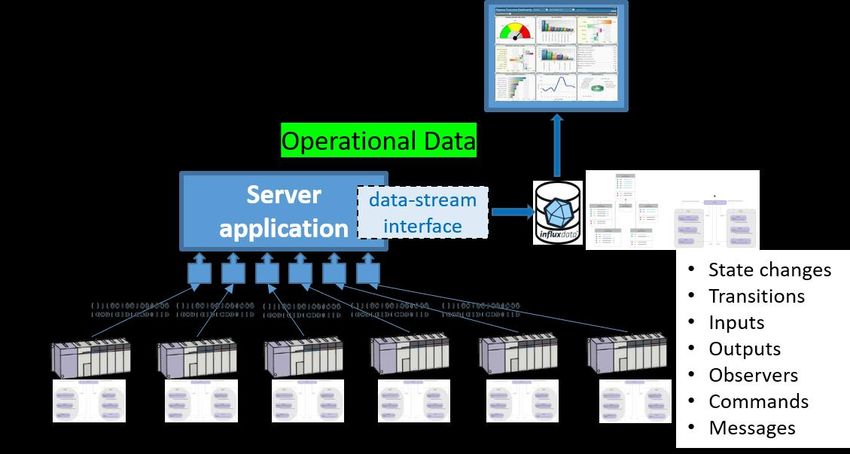
5.1. Operational data collection
Operational system data is collected from sensors in the field and operational data is mined by the
control system (e.g. PLC). When only sensor data is used, in many cases it is very difficult to make a
correct correlation with the system behaviour, and therefore no correct analysis. Therefore also data
from the control system is collected and added to a time-series database. Using the low-code design
application, operational data is logged during execution. These data include the status of:
• States
• Inputs
• Outputs
• Observers
• Commands
• Messages
In order to obtain error-free and high-quality data from the control system, the data collection must
be automated, structured, performant and consistent. Using the low-code modelling platform the
data creation will be automated and will be given structure. Making the collected data performant
and consistent, means that from every PLC cycle (1..10 ms) all the data updated in that cycle, have to
be stored. Therefore also data management is necessary in the PLC control system. In order to readout
this data fast enough by a server application, data streaming processing techniques are necessary for
the data transport (see Figure 5.2).
6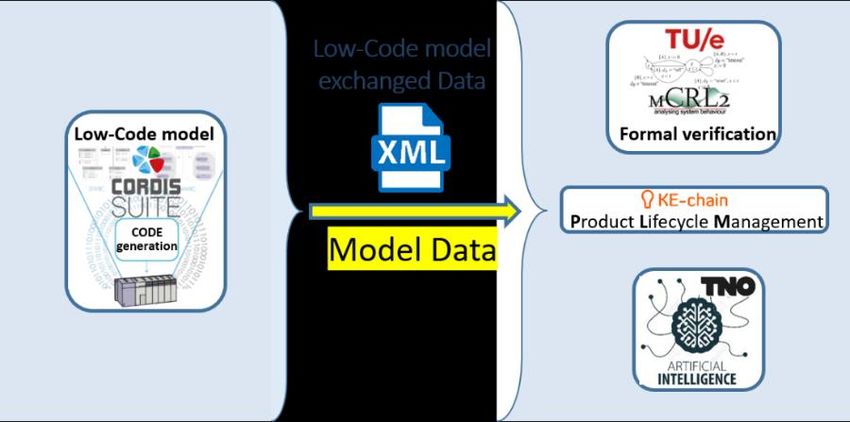
Machinaide Deliverable 5.1
Public

                   Figure 5.2 Operational data collection architecture (single PLC control system)

To be able to stream the data of multiple PLC control systems, the server application will have an own
streaming connector for each PLC control system that handles the data transport and storage in
parallel (see Figure 5.3).

                 Figure 5.3 Operational data collection architecture (multiple PLC control systems)

5.2.     Model data collection
From the low-code design application the complete model specification (e.g. static decomposition of
all components, their relation, the interfaces, observed properties and dynamic state-machine
behaviour) will be exchanged (model-to-model transformation) to the other platforms for product life
cycle management, anomaly detection and identification and formal verification (see Figure 5.4).
These topics are addressed in Chapters 6, 7 and 8, respectively. One and the same generic metadata
exchange description, using XML standard is used for all platforms. Using the same data source for all
platforms ensures the required consistency.

                                                         7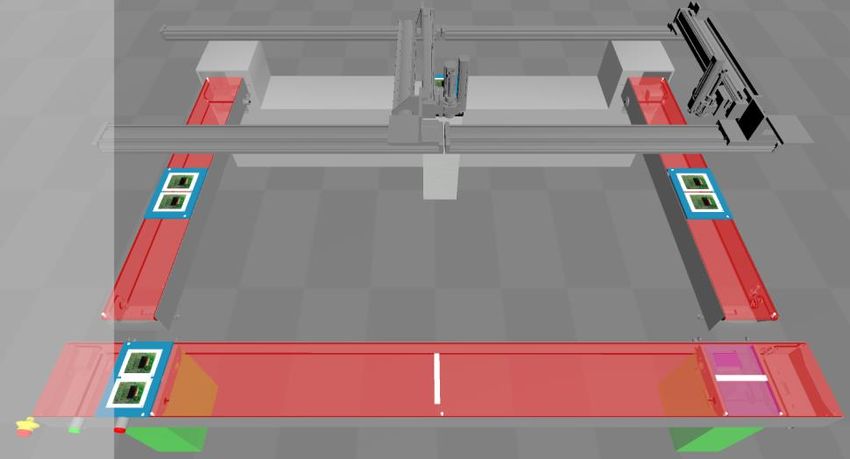
Machinaide Deliverable 5.1
Public

 Figure 5.4 Model data collection for product lifecycle management (see Chapter 6), anomaly detection and identification
                                  (see Chapter 7) and formal verification (see Chapter 8)

6. Product lifecycle management
KE-works implements the product lifecycle management environment for the Dutch use cases
(Machinaide, 2021). This environment addresses all of the steps in the continuous development
process introduced in Figure 4.1. The product lifecycle environment is implemented in KE-chain, a
cloud-based collaboration and integration platform (KE-works, 2021). KE-chain provides access to
MACHINAIDE users to lifecycle templates for various machine configurations. In KE-chain a process
template is implemented which follows the schematic overview shown in Figure 6.1. This process
template consists of five primary steps which can be highly iterative and repetitive:

    -    Specification of system requirements
    -    Specification of (sub-)system design
    -    Specification of software settings and state machines
    -    Implementation of the system model and software
    -    Monitoring the operational behaviour of a machine given the active set of settings.

                       Figure 6.1 Product lifecycle process (per machine) implemented in KE-chain

As can be seen from the product lifecycle process template which needs to be implemented in KE-
chain there are several integrations which need to be implemented:

                                                           8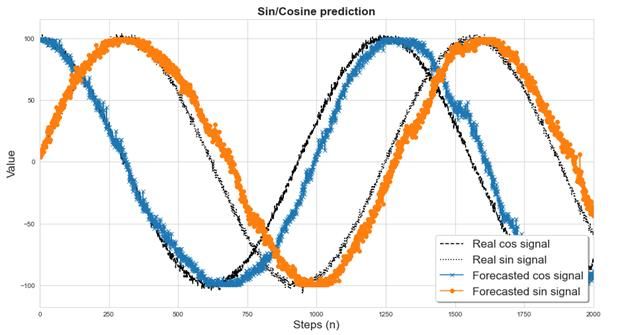
Machinaide Deliverable 5.1
Public

    -    The system model specified using Cordis SUITE (Cordis SUITE, 2021) needs to be imported in
         KE-chain. KE-chain should be able to read and interpret the system model and translate it into
         the KE-chain cloud database.
    -    When the machine server is running, the settings changed need to be updated in KE-chain. In
         KE-chain the settings should be automatically connected to the system model. Settings should
         be traced back to the system model.
    -    During operation of the machine messages, errors and KPIs should be automatically sent to
         KE-chain. KE-chain will display and connect the messages and errors to the system model.
         Moreover, end users should be able to configure the parameters which will be observed.

On top of the individual lifecycle of a single machine, it should be possible to register and compare
multiple machine configurations in the KE-chain environment. The management environment is
schematically illustrated in Figure 6.2. KE-chain should offer the functionality to register new machines
and provide restricted access to the lifecycle data of these machines. During the operation of these
machines, data is accumulated which can be used to compare various operational configurations.

                      Figure 6.2 Product lifecycle process (per family) implemented in KE-chain

7. Anomaly detection and identification
TNO’s contribution to WP5 is focused on the detection of anomalies in the behaviour of operational
systems and the identification of the underlying root causes of detected anomalies. These are
techniques that correspond to the monitoring and analysis steps in the system improvement cycle
introduced in Figure 4.1.

TNO proposes the following three-step anomaly detection and identification procedure.

    •    Phase 1 (Passive diagnosis/passive monitoring): In the first phase, system anomalies/failures
         are detected by observing and analysing the system’s (observable) events. If an anomaly is
         detected, then the second phase starts.
    •    Phase 2 (Active diagnosis): In the second phase, an active diagnoser takes over from the
         normal controller when it receives a trigger from the passive diagnosis/passive monitoring
         phase that an anomaly has been detected. After the active diagnoser has disabled the normal
         control behaviour, it issues specific commands to identify the root cause of the detected
         anomaly. Based on the events coming from the controller, the number of possible root causes

                                                         9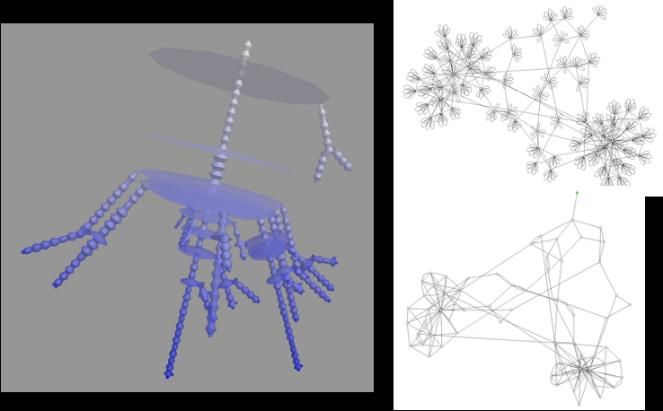
Machinaide Deliverable 5.1
Public

         gets reduced. The active diagnosis phase stops when the number of possible root causes
         cannot be reduced any further, e.g. when a single root cause remains.
    •    Phase 3 (Reporting): In the final step of the method, the remaining possible root causes of the
         detected anomaly get reported to a human operator or service engineer, e.g. via a data
         visualisation dashboard. If there are multiple possible root causes, the human operator or
         service engineer could apply manual steps to identify the actual root cause.

    A visualisation of the anomaly detection and identification method for specifically for control
    applications, is shown in Figure 7.1. The passive diagnoser monitors a system controller and
    activates an active diagnoser. This active diagnoser starts by deactivating the system controller
    and acts as the new system controller. As such, it triggers specifically to identify the nature of the
    detected anomaly. This can be derived from the responses the active diagnoser receives from the
    system. The last step involve reporting the identified root causes to a human operator, who can
    take corrective actions, e.g. the replacement of a broken component.

                        Figure 7.1 Anomaly detection and identification approach (Okker, 2021)

There are many different methods for anomaly detection; see (Chandola, Banerjee, & Kumar, 2012)
and (Pang, Shen, Cao, & van den Hengel, 2021) for overviews. Two main categories of methods can
be distinguished. On the one hand, there are methods that use domain knowledge to specify
conditions that indicate the occurrence of an anomaly. Examples of anomaly detection methods
include rule-based techniques, decision trees, and techniques for run-time verification (Leucker &
Schallhart, 2009). On the other hand, there are anomaly detection techniques that are based on
machine learning. These techniques typically identify the occurrence of an anomaly from deviations
from what was learned to be normal. Both categories of anomaly detection have their strengths and
weaknesses. The methods based on domain knowledge are typically easy to understand, but it
involves a lot of work to specify them and it is impossible to specify all relevant anomalies. Techniques
based on machine learning may be able to detect all anomalous behaviour, but are typically less
understandable.

TNO intends to consider both types of anomaly detection to assess their applicability to machine
control applications, such as control systems specified using Cordis SUITE (Cordis SUITE, 2021). An

                                                       10
Machinaide Deliverable 5.1
Public
implementation of the anomaly detection and identification will be based on the model and
operational data as collected from Cordis SUITE (see Chapter 5). Details about the implementation
and application of the anomaly detection and identification methods will be presented in Machinaide
deliverable D5.2 (Machinaide, 2021). For anomaly detection using machine learning, deliverable D5.2
will address data preparation and learning anomalies using different types of autoencoders. For
anomaly detection based on domain knowledge, deliverable D5.2 will present a rule-based language
to formally specify anomalous behaviour in a modular manner. The specified rules are translated are
translated into timed automata that are used for run-time verification. Furthermore, deliverable D5.2
will present an active diagnoser which interacts with Cordis SUITE to identify the root cause of
identified anomalies. The anomaly detection and identification is supported by dashboarding
functionality; the dashboard is used to visualise system data and to report findings.
8. Formal verification of low-code models
TU/e focuses on the verification and validation of low-code specifications. More specifically, it has
developed a verification methodology for the low-code models that are specified in Cordis Modeller
(Cordis SUITE, 2021). This corresponds to the verification and validation step in the system
improvement cycle introduced in Figure 4.1. An overview of the verification process is given in Figure
8.1. We next describe the verification approach.
Figure 8.1 Overview of the verification and validation process of low-code models
The Cordis low-code models in essence consist of class diagrams and state machine diagrams, in which
some of the behaviour is described using PLC code in structured text. The semantics of such models
has been formalised using the mCRL2 language (Groote & Mousavi, 2014). This results in a full
behavioural model of the low-code models. The translation of low-code models to mCRL2 is
automated, and the resulting mCRL2 model can be used for studying the full state space of the model,
and formal verification of requirements using the mCRL2 toolset (Bunte, et al., 2019). In particular,
the full behaviour of the low-code models, i.e. the state machine diagrams including the structured
text code, can be studied. This includes the be haviour of the system for all possible inputs, including
input combinations that are unlikely, but not impossible, in practice. This enables, for instance,
studying the behaviour of the system when input sensors are faulty and other situations that are hard
or impossible to obtain during simulation.
Safety and liveness requirements on low-code models can be formulated in terms of inputs, outputs,
and states in the low-code model. Subsequently these requirements can be formalised using temporal
11Machinaide Deliverable 5.1
Public
logic formulas (in this case the model mu-calculus). These formulas can be verified automatically, and
if they are violated a counterexample is produced. These counterexamples then serve as input to
improve the low-code models.
The Merry-go-Round system described in Chapter 15 is used as a case study for the prototype of the
verification. For the Cylinder and Gantry components of the system, requirements have been
identified, formalised and verified. Part of the Cylinder model in Cordis modeller is shown in Figure
8.2. Different representations of the state space corresponding to the semantics of the model are
shown in Figure 8.3.
Figure 8.2 Cylinder state machine in Cordis Modeller
Figure 8.3 Views of the state space of the Cylinder control software generated using the mCRL2 toolset
During the case study it was observed that the semantics is not yet completely clearly defined. In
particular, the order in which objects and state machines execute needs clarification. To this end,
Cordis models will be extended with an explicit order of execution. This clarifies the behaviour to the
creator of the model, and it eases the verification process developed by TU/e. A second complication
in the verification process is the size of the state space. Even for the case study’s relatively simple
12Machinaide Deliverable 5.1
Public
models, state spaces already are in the order of 10s of millions of states. This is mainly due to the
unrestricted inputs in the model.
In the remainder of the project, TU/e plans to scale verification of low-code models to industrial
models. As a first step, the Merry-go-Round demo model will be fully verified out-of-the-box. For this,
the verification methodology will be extended with symbolic model checking techniques, which
enables the scaling to much larger state spaces (100s of billions of states and beyond). Additionally,
improvements to the translation of low-code models to mCRL2 will be investigated that result in
smaller state spaces and an accurate representation of the semantics. The merit of compositional
verification techniques will also be investigated in the context of the verification. It is expected that
this leads to improved scalability of the verification on the one hand, and incremental verification of
updates to the low-code models in the feedback cycle on the other hand.
Ultimately, the improved verification shall be applied to industrial low-code models provided by Lely
and/or Additive Industries.
9. Smart Factory Ecosystem
The Finnish demonstration in the Machinaide project involves five partners, Konecranes, Aalto
University, Remion, RollResearch International and Ideal. The use case for Finnish consortium is an
industrial smart crane, Ilmatar (Autiosalo, 2018) combined with an intelligent grinding machine in a
Smart Factory Ecosystem. The Ecosystem, including different machines, represents a central platform
and research environment when developing new technologies for the machines of the Ecosystem and
ways to integrate them seamlessly to operate in smart and connected factories of the future.
This test platform represents a part of an actual production process and can be used for developing,
evaluating and demonstrating Digital Twin (DT) enabled process optimisation, processing of multiple
DTs, HMIs and lifecycle management. Figure 9.1 shows an example update cycle that can be run on
the platform.
Figure 9.1 Update cycle for the Smart Factory ecosystem located at Aalto Industrial Internet Campus
13Machinaide Deliverable 5.1
Public
9.1. Crane lifecycle update requirements
Crane-specific lifecycle update needs are in the following development areas: (1) upkeeping the Digital
Twin architecture and data, (2) increasing knowledge/intelligence of the Digital Twin based on lifecycle
data analytics during lifecycle, and (3) enabling new control, automation and remote monitoring
features by updating the crane via Digital Twin. At least the following usage scenarios should be
handled via the Digital Twin:
1. Storing all control parameter history and control component information (model, serial
number, spare part ID) as part of the Digital Twin. Enabling updates and restoration of control
parameters via the Digital Twin when replacing control components in physical crane.
2. Enabling user access control updates/changes for the crane via the Digital Twin. Different
users may be given different levels of access to features and new features may be added
during the lifecycle. (VDMA OPC UA data model)
3. Updating predictive maintenance planning of the Digital Twin based on collected data from a
population of similar products.
4. Applying and updating machine learning algorithms to identify anomalies and trends based
on condition monitoring data from crane sensors. (Edge computing solution)
9.2. Grinding machine lifecycle update requirements
In most of the industrial cases the grinding machines (Machinaide, 2021) are not part of the
production, but part of maintenance. The exception is the roll manufacturers, who sell the rolls to the
customers in the paper and steel industry. Therefore, the grinding machine is not viewed here as a
part of the production, but part of maintenance.
Grinding machine specific lifecycle needs for the Digital Twin come mainly from the availability
guarantee of the grinding machine, which can be as high as 95 to 99 percent. During different phases
of the lifecycle the needs change. In the beginning optimal grinding procedures are the main focus.
Operators are still unfamiliar with the new control system and make operating errors. When the
machine gets older, monitoring of the motors and other automation system parts becomes more
important to determine the optimal time for replacing old parts with new ones. Also, the need for a
mechanical overhaul can be estimated, e.g. from the power consumption changes of the motors.
The grinding machine continuously collects data about the ground rolls. The usage of the data in
combination with the production line data can provide also new insights about the optimal shape of
the rolls, their optimal operation time, etc.
The mentioned topics require constant updates in the Digital Twin. Also, the feedback from the
grinding machine to the digital twin must be present during the lifecycle of the machine.
Summarized it can be said that predictive maintenance, operator learning and data analyses are the
most important topics that can be tested on the Machinaide Finnish test platform.
10. Digital twin management through its lifecycle
IDEAL GRP participates in WP5 in defining how the information related to a digital twin is managed
through its lifecycle. This includes information on machine improvement design and optimisation,
verification as well as release of machines, machine configuration improvements and updates. IDEAL
GRP’s definitions are mostly implemented in the Finnish use cases including the Crane and Grinding
machine digital twin lifecycle.
14Machinaide Deliverable 5.1
Public
Development focuses on following key areas: (1) managing the as-is state of the production machinery
via the digital twin definitions, (2) managing the digital twin information during design, optimisation
and verification, (3) updating the digital twin information with the released configuration and (4)
enabling the updates to be released to the machine.
At least the following use cases should be handled:
1. Understanding the current state of the machine through digital twin including control
parameter history and components
2. Viewing the change history for the digital twin
3. Analysing the effect of the updates to the digital twin performance (through data collected in
previous WPs)
4. Enabling predictive maintenance use cases by providing platform for storing component
information, historical data and through previous WPs run simulations of the digital twin
5. Studying how the release of updates are done to the machine through digital twin
11. Multivariate fuzzy time-series data modelling and prediction
Aalto University contributes to the analysis step of the system improvement cycle introduced in Figure
4.1. Machine data modelling has been studied in Aalto University as a part of ongoing master´s thesis
project by Tuomas Keski-Heikkilä, and for WP5 one example is presented as an example. It is data
analysis with multivariate time-series data from an industrial crane Ilmatar (Autiosalo, 2018). When
data is analysed, it can be used to update machine parameters to improve its operations. In the study,
a fuzzy modelling method was developed, and three usage scenarios were targeted: (1) data
visualisation, (2) prediction, and (3) anomaly detection. The crane stores data from sensors, a total of
96 variables. Large amounts of data are available and the main challenges for the modelling method
are high dimensionality of the data, being able to provide real-time analysis and the scalability of the
modelling method.
In the fuzzy modelling method, the raw data is compressed in a fuzzy format. Fuzzy modelling reduces
the required file size, improves data processing efficiency, provides in-built aggregation, and increases
the interpretability of the model. In the fuzzy modelling method, the raw variable data is saved as a
set of if-then rules, which are based on membership functions defined for each variable in a fuzzy
model. Storing the data in a fuzzy format introduces a minor inaccuracy in the data, depending mainly
on the number of membership functions used and the method of determining the if-then rule weights.
Figure 11.1 shows a graphical representation of a fuzzy model through QtFuzzylite 6 (FuzzyLite
Limited, 2021), which is a graphical fuzzy control design tool. Defining variables can be included in the
fuzzy model, which allows the user to easily view the model in any state. An example of a defining
variable can be time or alarm data. An analyst may for example want to see how different machine
parameters behaved in a specific time frame when an alarm has been active. This may provide
valuable information, which can be used to improve the design or usage of the machine.
15Machinaide Deliverable 5.1
Public
Figure 11.1 Overview of the user interface of a graphical fuzzy control design tool QtFuzzylite 6. The user interface consists
of three main elements: input variables on the left, output variables on the right and the rule block below
Visualisation can be done directly from a fuzzy model that has analysed the raw data (see Figure 11.2).
By visualising the built fuzzy models, the usage of the machine can be better understood. The visual
information may also help to recognise harmful anomalies or such machine behaviour or machine
usage that could be non-optimal over the lifetime of the crane. For example, if all heavy lifting is done
at the same spot, we may predict that wear to cables is highest in the affected spot. Thus, maintenance
engineers should be vigilant when inspecting these spots. Or better, control algorithm parameters
could be adjusted to extend machine lifecycle between maintenance or failures by avoiding having all
high load peaks at the same locations.
Figure 11.2 Examples of visualisation from raw data points (left) and from heat maps fuzzy model (2D in the middle and 3D
on the right)
The second targeted usage scenario, prediction, has been tested and developed for cumulative signals
and periodical signals. With periodical signals the fuzzy predictive system was taught with noisy sine
and cosine signals, and this predictive system was then used to iteratively forecast the signals from a
given starting point. Figure 11.3 shows the comparison between the real continued signals and the
forecasted signals. The goal of the predictions is to be able to predict complex N-signal systems.
Currently, the developed method only works for limited types of signals. Potentially the predictions
could suggest changes to configuration parameters throughout the machine lifecycle.
16Machinaide Deliverable 5.1
Public
Figure 11.3 Comparison of noisy sine and cosine wave signals with the forecasted versions obtained through fuzzy predictive
modelling
The third targeted usage scenario, anomaly detection, can be implemented in a fuzzy modelling
method in three different ways: based on historical data, based on expert knowledge, or based on
density. The different ways of implementation are suitable for different types of anomaly detection,
using historical data allows the user to detect abnormal usage patterns or parameter behaviour. On
the other hand, expert knowledge can be used to design simple fuzzy rules to detect and quantify
more obvious faults in the system. Anomaly detection can potentially help identify problems in the
machine or its usage, and this information can be then used to improve the machine over its lifecycle.
12. Time Series Forecasting for Anomaly Detection
In WP5, TEKNOPAR participates in the development of methodologies and specifications of data
interfaces and machine improvement strategy for Digital Twin across lifecycle phases, and in the
development of lifecycle and Digital Twin architectures for managing updates across lifecycle phases.
The work to be performed by TEKNOPAR includes the following:
• Data set preparation (So far some amount of data has been collected in InfluxDB)
• Data quality enhancements and data preprocessing
• Feature extraction and preprocessing of data to be used for predictive maintenance
• Development of machine learning (ML) algorithms for predictive maintenance in the ERMETAL
use case (Machinaide, 2021)
• Use time series data collected/generated and the selected algorithms for remaining useful life
(RUL) estimation; techniques used include LSTM and Random Forest
• Training of ML models for predictive maintenance purposes
• Testing the models developed
• Hyperparameter tuning (Comparison of developed models performance and model
optimisation)
• Visualisation of models developed and results obtained
• Establishment of the Platform and the Enterprise tiers of Figure 12.1. (The Edge tier has been
formed, and some data has been collected)
A three tier-architecture for the ERMETAL use case (Machinaide, 2021) will be developed (see Figure
12.1).
17Machinaide Deliverable 5.1
Public
Figure 12.1 Three-tier architecture for ERMETAL use case
Dakik contributes to predictive analysis and the implementation of time series anomaly detection. The
anomaly detection approach flags anomalies if the relative difference between the expected value
generated by the algorithm and the observed value is higher than a threshold that is calculated using
the statistics obtained from training error (relative difference is used to prevent false negatives for
thresholds with lower magnitudes). After a literature review and testing on our data we selected Long
Short Term Memory (LSTM) networks and Autoregressive integrated moving average (ARIMA) to work
with. We used the Keras library (KERAS, 2021) with the TensorFlow backend (TensorFlow, 2021) for
Python for the LSTM Network implementation and the pmdarima library (PyPI, 2021) for Python for
the ARIMA implementation. We will continue our work on other anomaly detection approaches and
algorithms that can be used with those approaches.
Figure 12.2 shows the prediction quality of ARIMA.
Figure 12.2 Predictive analysis using ARIMA
Figure 12.3 shows the anomaly detection using predictions from an LSTM network. The yellow line
represents the threshold value and the plot under it is the relative error between the prediction and
the observed value. Since no error is above the threshold, no anomalies are flagged.
Figure 12.3 Time series anomaly detection using LSTM networks
18Machinaide Deliverable 5.1
Public
13. Conclusion
Machinaide WP5 addresses the investigation of data usage across different lifecycle phases. Major
focus is put on the exploitation of data originating from later lifecycle phases by applications defined
during earlier lifecycle phases like used for planning, engineering, coding and configuring. Machinaide
deliverable D5.1, i.e. this document, has introduced a continuous improvement cycle for system
development. Moreover it describes architectures and (outlines of) methods to realise steps in this
cycle. The implementation of the methods and the results of applying the implemented methods to
the different use cases (Machinaide, 2021) will be presented in Machinaide deliverable D5.2
(Machinaide, 2021).
14. References
Autiosalo, J. (2018). Platform for industrial internet and digital twin focused education research, and
innovation: Ilmatar the overhead crane. IEEE 4th World Forum on Internet of Things (WF-IoT),
(pp. 241-244).
Bunte, O., Groote, J. F., Keiren, J. J. A., Laveaux, M., Neele, T., de Vink, E. P., Wesselink, J. W., Wijs, A.
& Willemse, T. A. C. (2019). The mCRL2 Toolset for Analysing Concurrent Improvements in
Expressivity and Usability. TACAS2019 (pp. 21-39). LNCS vol. 11428. Springer.
Chandola, V., Banerjee, A., & Kumar, V. (2012). Anomaly Detection for Discrete Sequences: A Survey.
IEEE Transactions on Knowledge and Data Engineering, 24(5), 828-839.
Cordis SUITE. (2021). Cordis SUITE, Low-Code platform for control Software. Retrieved from
https://cordis.nl/
FuzzyLite Limited. (2021). Qt FuzzyLite. Retrieved from https://www.fuzzylite.com/qt/
Groote, J. F., & Mousavi, M. R. (2014). Modeling and analysis of communicating systems. The MIT
Press.
KERAS. (2021). KERAS: The Python deep learning API. Retrieved from https://keras.io/
KE-works. (2021). KE-chain. Retrieved from https://ke-chain.com/?lang=en
Leucker, M., & Schallhart, C. (2009). A brief account of runtime verification. The Journal of Logic and
Algebraic Programming, 293-303.
Machinaide. (2021). Deliverable D1.1 Use case descriptions.
Machinaide. (2021). Deliverable D3.1 Specification for the Knowledge Representation & Information
Access Services.
Machinaide. (2021). Deliverable D5.2 Lifecycle and Digital Twin architecture definition for managing
updates across lifecycle phases.
Okker, N. (2021). A pragmatic approach to active failure diagnosis of discrete-event systems. Master
Thesis, Radboud University, Institute for Computing and Information Sciences, Nijmegen.
Retrieved from
https://www.ru.nl/publish/pages/769526/master_thesis_niels_okker_v1_1.pdf
Pang, G., Shen, C., Cao, L., & van den Hengel, A. (2021). Deep Learning for Anomaly Detection: A
Review. ACM Computing Surveys, 54(2), Article No. 38.
19Machinaide Deliverable 5.1
Public
PyPI. (2021). pmdarima. Retrieved from https://pypi.org/project/pmdarima/
TensorFlow. (2021). TensorFlow. Retrieved from https://www.tensorflow.org/
15. Appendix: Merry-go-Round case study
To avoid confidentiality issues, TNO and TU/e have used an artificial production system as the basis
for the results presented in this deliverable. Merry-go-Round is a system of Cordis Automation used
to teach users about Cordis SUITE (Cordis SUITE, 2021) and to test its functionality. Merry-go-Round
is a (virtual) system designed to indefinitely move trays between components that form a loop. The
trays (shown in blue and white) move over Merry-go-Round’s components to eventually return to
their starting point, where the route repeats. Each component has sensors and actuators. The machine
can move trays clockwise and counter-clockwise. Figure 15.1 shows a simulation of Merry-go-Round.
When the system starts in the counter-clockwise configuration, a gantry moves trays from the back of
Merry-go-round (an arbitrary starting point) to the left conveyor. The left conveyor transports the
trays to the left lift. This lift (shown in green) moves the trays down onto the front conveyor. Next, the
front conveyor moves trays to the right lift. The right lift moves the trays onto the right conveyor,
which transports the trays to the right gantry. The right gantry puts the trays back in the starting
position. As one can see in Figure 15.1, there are four trays in the Merry-go-Round system.
Figure 15.1 Merry-go-Round system (simulation)
The controller of Merry-go-Round shown in Figure 15.1 has been implemented in Cordis SUITE. An
overview of the Cordis Suite components and the Merry-go-Round is shown in Figure 15.2. Cordis
Modeler allows users to describe the controller in terms of UML object, state and activity diagrams
and provides ways to check the diagrams’ syntax. Cordis Modeler can translate the combination of
diagrams into code for different kinds of programmable logic controllers. Cordis Modeler can also
generate diagrams representing the current state in state machine models in the Cordis Dashboard.
The generated code compiles into a controller for the various types of Programmable Logic Controllers
(PLCs).
The Machine Control Server retrieves the events from different types of PLCs and sends them to the
Cordis Dashboard. The Cordis Dashboard shows the system’s observable variables and the current
states in the various state machine diagrams. It also allows sending commands to the system. The
Machine Control Server also contains the functionality to create plugins. These plugins subscribe to
20Machinaide Deliverable 5.1
Public
events of controllers and send commands to controllers connected to the Machine Control Server.
Examples of plugins are specific human-machine interfaces for a customer or digital twin data retrieval
and collection. An additional component for simulating a machine is the Cordis Gateway. The Cordis
Gateway acts as a proxy between the controller and external simulations, e.g. the Merry-go-Round
simulation in Figure 15.2.
Figure 15.2 Cordis SUITE and Merry-go-Round system overview (Okker, 2021)
21You can also read