Web-Based Android Malicious Software Detection and Classification System - MDPI
←
→
Page content transcription
If your browser does not render page correctly, please read the page content below
applied
           sciences
Article
Web-Based Android Malicious Software Detection
and Classification System
İbrahim Alper Doğru *          and Ömer KİRAZ
 Department of Computer Engineering, Gazi University Faculty of Technology,
 Teknikokullar Ankara 06500, Turkey; omer.kiraz1@gazi.edu.tr
 * Correspondence: iadogru@gazi.edu.tr; Tel.: +90-312-202-8591

 Received: 20 August 2018; Accepted: 10 September 2018; Published: 12 September 2018

 Abstract: Android is the most used operating system (OS) by mobile devices. Since applications
 uploaded to Google Play and other stores are not analyzed comprehensively, it is not known whether
 the applications are malicious software or not. Therefore, there is an urgent need to analyze these
 applications regarding malicious software. Moreover, mobile devices have limited resources to
 analyze the applications. In this study, a malicious detection system named “Web-Based Android
 Malicious Software Detection and Classification System” was developed. The system is based
 on client-server architecture, static analysis and web-scraping methods. The proposed system
 overcomes the resource restriction issue, as well as providing third-party service support by means
 of client-server architecture. Based on the performance evaluation conducted in this research,
 the developed system’s success rate is 97.62% on benign and malicious datasets.

 Keywords: Android; malware detection; static analysis; mobile security

1. Introduction
     The use of mobile devices has been increasing in the world. Mobile device users can easily
perform banking, shopping, web page navigation, gaming, and similar transactions without computers.
According to first quarter report of International Data Corporation (IDC) Company of 2017, the global
smartphone market has grown 3.4% and Android’s market share in the smartphone market has reached
up to 85% [1]. According to the G Data H1/2016 report, worldwide use of the Android platform
was determined to be 68% in the first half of 2016 [2]. Again, according to this report, 1,723,265 new
malicious application examples were identified. Yet again, the amount of new malicious software is
increasing, as well as the complexity of the malicious software introduced to prevent the detection of
malicious software. Google Play Protect, announced at Google I/O 2017, runs embedded on Play Store
and scans the applications before and after their installations [3,4].
     Android apps have become the target of malicious software developers because the Android
platform has a free and open-source operating system, and whenever an application is added on the
Google Play Market, the app is not examined in detail [5]. Beginning from version 6.0 Marshmallow,
the operating system warns users and demands confirmation when an application requests a dangerous
permission at run time. Additionally, unlike previous versions, you have the option to turn off the
permissions in the latest version. These features are included on Android 6.0, so users of older Android
versions are not able to use these features. Since 38.6% of Android users use Android 5.1 and older as of
2018 (Data collected during a 7-day period ending on 16 April 2018) [6], solutions covering all Android
users are needed. It is, therefore, essential to develop systems that detect whether applications on the
Google Play Market and other application markets are benign or malicious software. Yet, the resources
of mobile devices are inadequate for such a detection system.

Appl. Sci. 2018, 8, 1622; doi:10.3390/app8091622                              www.mdpi.com/journal/applsci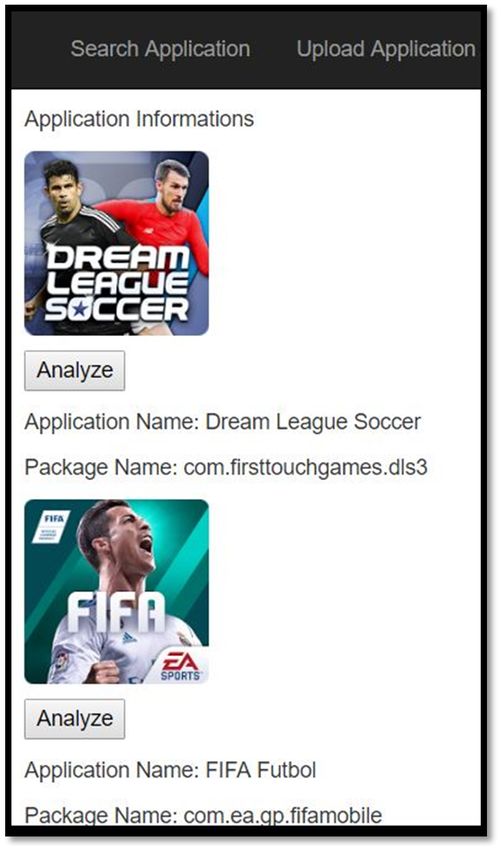
Appl. Sci. 2018, 8, 1622                                                                          2 of 19

      In this study, an Android malware detection system was developed to detect malicious applications
through client-server architecture, static analysis and web-scraping methods. All transactions are
conducted on the server side in consideration of the limited resource of mobile phones. Hence, there
is no load generated on the client side. Virus Total, which is a highly trusted virus/malware scanner
tool, was integrated into the developed system and used in the calculation method. The robustness
of the developed system was evaluated using 5545 malicious and 1173 benign Android applications.
The developed system was compared with existing static analysis methods as a basis for a discussion of
its pros and cons.
      In this article, the following topics are discussed in sequence: the related literature is reviewed
in the second section; the structure of the developed system and the used tools are shown in the
third section; the obtained outcomes of the performance evaluation are shared in the fourth section;
the studies to be conducted in the future and the results of the research are given in the last section.

2. Related Studies
     There are three methods found in the literature used as analysis methods for Android malicious
software. These are the static, dynamic and hybrid analysis methods.

2.1. Static Analysis Method
      In this analysis method, Android applications are analyzed using the features found in the .apk
file before being installed on the device. DroidMat uses a static analysis method to determine whether
applications are benign or malicious [7]. Permissions in each application’s AndroidManifest.xml file,
other components (activity, service and receiver) and API (Application Programming Interface) calls
in the application’s bytecodes are used as features. Using the Apktool [8] tool, AndroidManifest.xml
and smali files of benign and malicious applications are obtained. The permissions, activities, service
and receiver components, intent and API calls in these files are considered as features. In a DREBIN
study, a method for Android malware detection was introduced that allows malicious applications
to be identified directly on the smartphone [9,10]. Based on the developed method, many features
were collected from the application code and AndroidManifest.xml file. APK Auditor is a system
for detecting malicious Android-based malware [11]. APK Auditor uses a static analysis method
to characterize and classify Android applications as to whether they are benign or malicious [11].
The developed system consists of three main components: an Android client, a signature database and
a central server [11,12]. DroidOL addresses the issue of malware detection and suggests a new online
machine learning-based framework [13]. The DroidOL system consists of three stages. In the first stage,
static analysis is performed on a certain number of applications to obtain inter-procedural control-flow
graphs [13]. In the second stage, the sub-graph properties of the inter-procedural control-flow graphs
are extracted using the Weisfehler-Lehman kernel, and the applications are represented as feature
vectors [13]. In the last stage, an online passive aggressive classifier is used and trained to detect
malicious software with these vectors [13]. In the ASE study, an integrated static detection system
with four filtering layers was proposed, including MD5 (Message Digest 5) detection of characteristic
values, detection of combination of malicious permissions, detection of hazardous permissions and
detection of hazardous intent [14]. Wang et al. proposed a system to manage a large application market
effectively and efficiently in order to categorize malicious and benign applications [15]. The alarm is
triggered if the application is identified as malicious by using a combination of multiple classifiers.
In the study of Sokolova et al., a system was proposed that characterizes normal behaviors for each
application category and emphasizes expected permission requests. Moreover, category patterns
and central permissions are obtained using graph analysis metrics [16]. The models obtained are
evaluated by the performance of the application classification based on the categories developed [16].
Anwar et al. proposed a static system for mobile botnet detection [17]. This system considers the static
features of Android applications, including MD, permissions, recipients, and background services [17].
Arslan et al. made a static approach that detects malicious and benign software by calculating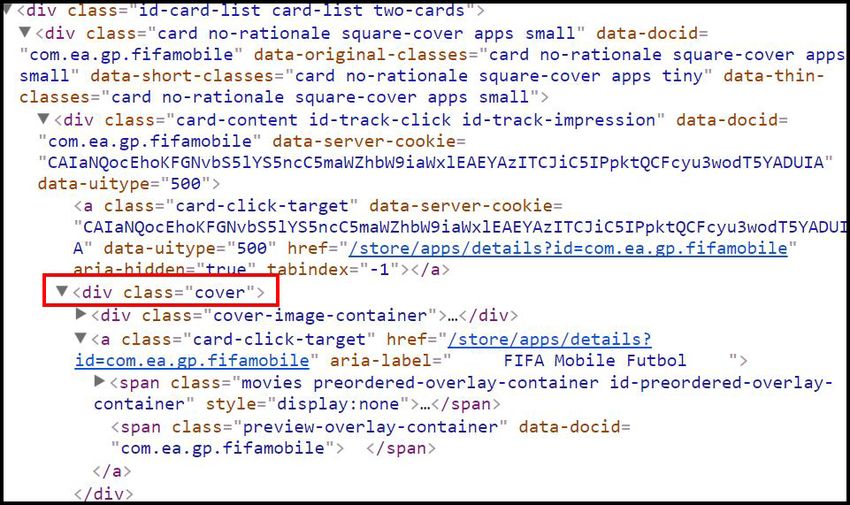
Appl. Sci. 2018, 8, 1622                                                                            3 of 19

the number of the permissions that applications request on the code side [18]. The Dex2jar [19],
and Apktool [8] tools were used to perform reverse engineering on the applications [18]. In the
AndroDialysis study, the intentions in the AndroidManifest.xml file were used as a distinguishing
feature in identifying malware [20]. In the study conducted, it was determined that the intentions
were more effective than the permissions in the detection of malicious software [20]. However, it is
considered that intentions cannot replace the permissions in the detection of malicious software [20].
In the study of Kang et al., developer information was used as an attribute [21]. It was argued that the
detection of malicious software can be made more effective by comparing the application certificate
serial number with pre-defined malicious certificate serial numbers [21,22]. Along those lines, Utku
and Dogru developed a malicious software detection system based on well-known malicious software
at the application level for mobile devices [23]. Naive Bayes and KNN machine learning algorithms
were used in this study to classify permissions [23]. Atici et al. developed a static system based on
machine learning algorithms and control flow graphs of Dalvik byte codes for Android malware
analysis [24]. In this study, grammatical expressions consisting of control flow graphs of Android
malicious software were used as an input vector [24].

2.2. Dynamic Analysis Method
     This analysis method is based on the behavior of Android applications. Shabtai et al. developed
a system that uses a dynamic analysis method to detect malicious software by network patterns
of applications [12,25]. In the study, it is claimed that the network traffic patterns of different
applications with the same function have similar patterns, and the results confirmed the claim [12,25].
The DroidAuditor is a behavior analysis system that monitors the behavior of apps on real Android
devices and creates the graphical representations of such [26]. Andro-Profiler classifies malicious
software using behavioral profiles extracted from the integrated system logs, including system calls [27].
Andro-Profiler runs a malicious application on the virtual device to create integrated system logs
and analyzes the integrated system logs to create human-readable behavioral profiles [27]. In a
study by Garg et al., a system is developed to detect malicious applications by looking at network
activity through an observing eye on the network [28]. The developed model also has the ability
to detect malicious applications using network traces, to work with different versions of operating
systems, to detect unknown applications, and to detect infected applications with encrypted data [28].
In the study of Chang et al., a behavior-based malware detection system using machine learning was
proposed [29]. In this study, in addition to the DroidBox [30] structure, an automatically triggered
view identification program was added [29].

2.3. Hybrid Analysis Method
      This method of analysis is based on the usage of static and dynamic analysis methods together.
Shi et al. proposed a hybrid system that combines static and dynamic analysis to detect security threats
that attacks on mobile applications [31]. The system consists of two main components; namely, static
and dynamic analysis [31]. In the first stage, all files contained in the .apk file are obtained using
Apktool [31]. The focus of this static analysis phase is to analyze the file AndroidManifest.xml [31].
In addition, a Java application was developed to read file and text patterns during this static analysis
phase [31]. Start-up activity is attained from the AndroidManifest.xml file, and this information is
used in the second stage to obtain sensitive API calls [31]. In the second stage, the Auto-sign tool is
used to repackage the application [31]. Dynamic analysis is performed by running the repackaged
application [31]. This run is called ‘symbolic run’, because the application is run to get the API
call path [31]. In ScanMe Mobile study, a local and cloud-based hybrid malware detection system
was developed [32]. A mobile cloud-based architecture was used to perform real-time detection
efficiently [32]. In a study by Singh et al., a framework for the identification of malicious applications
is presented [33]. The intent of this framework is to imitate artificial user behavior and analyze the real
behavior of malicious software [33]. In the study of Wang et al., a static analysis technique was used to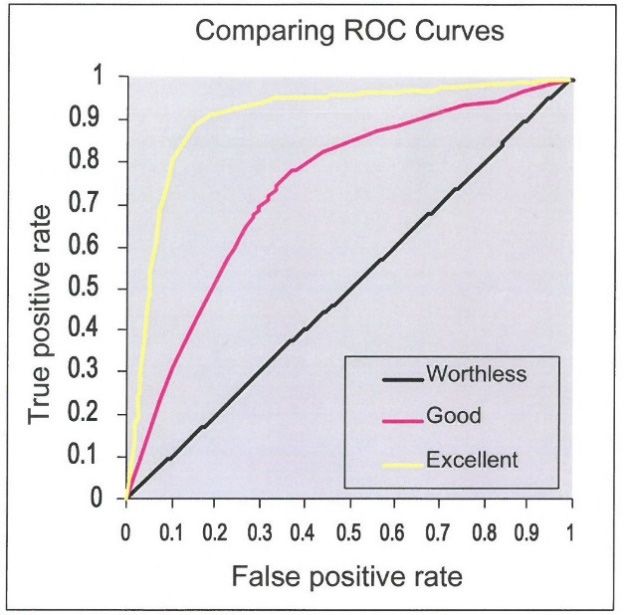
Appl. Sci. 2018, 8, 1622                                                                                                    4 of 19

obtain permission usage information from API calls [34]. In addition, dynamic analysis techniques
were also used to test and monitor the runtime usage behavior of applications [34].
     Appl. Sci. 2018, 8, x FOR PEER REVIEW                                                                             4 of 19
3. Web-Based Android Malicious Software Detection and Classification System
     3. Web-Based Android Malicious Software Detection and Classification System
      The developed system uses the static analysis method for the analysis of Android applications.
The AndroidThe developed
                  version usedsystemwasuses  the static
                                          chosen    to beanalysis
                                                           4.1, duemethod
                                                                       to thefor  the analysis
                                                                                highest           of Android applications.
                                                                                           targetSdkVersion       information of
     The   Android   version    used  was   chosen   to be 4.1, due   to the highest    targetSdkVersion
the applications in the Drebin malware dataset [9] being 16. The reason for this selection is that            information     of the
     the  applications   in  the Drebin   malware     dataset  [9]  being  16.  The   reason   for this
permissions used by applications in the malicious dataset practice permissions that are present in the  selection   is  that the
     permissions used by applications in the malicious dataset practice permissions that are present in the
Android 4.1 version. To create a benign application data set, Android applications of official institutions in
     Android 4.1 version. To create a benign application data set, Android applications of official
Turkey, other countries, and popular applications on the Google Play market were downloaded by using
     institutions in Turkey, other countries, and popular applications on the Google Play market were
the APKPure [35] web page. The APKPure web page is a platform for downloading Android .apk files.
     downloaded by using the APKPure [35] web page. The APKPure web page is a platform for
By using    this web page,
     downloading       Android 1331.apk
                                     applications
                                          files. By were
                                                      usingmanually
                                                              this webdownloaded
                                                                           page, 1,331and       a benign data
                                                                                            applications    weresetmanually
                                                                                                                       was created.
      The   data   set created   in  the  Drebin
     downloaded and a benign data set was created.  [9] study   was    used  for   collecting    the malicious     software     data
set, which The data set created in the Drebin [9] study was used for collecting the malicious software data 179
              has   been   shared    as  an  open    resource.    This   data   set  contains    5560   applications       from
different    malware
     set, which         families.
                   has been    sharedThese
                                       as ansamples       were collected
                                               open resource.     This data insetacontains
                                                                                    period from      August 2010from
                                                                                               5560 applications         to October
                                                                                                                             179
2012different
       [36,37]. malware
                 Since applications      added
                            families. These       to Google
                                               samples    werePlay   Market
                                                                collected   in ainperiod
                                                                                    the benign
                                                                                            from dataset    did not
                                                                                                   August 2010          go through
                                                                                                                   to October
     2012 [36,37].
a detailed          Sinceprocess
              analysis     applications    added to Google
                                     to determine      whether Play  Market
                                                                   the         in the benign
                                                                        applications      in thedataset
                                                                                                   benigndiddata
                                                                                                              not gosetthrough
                                                                                                                          were safe
or not, the safety was checked using the VirusTotal API [38]. VirusTotal was used in the safe
     a  detailed  analysis  process   to determine    whether    the applications     in the  benign   data set  were         or of
                                                                                                                          studies
AndroDialysis [20], Kang et al. [39], Ma et al. [40] and ICCDetector [41], which are available of
     not,  the  safety  was   checked    using   the  VirusTotal    API  [38].  VirusTotal     was  used   in  the  studies   in the
     AndroDialysis [20], Kang et al. [39], Ma et al. [40] and ICCDetector [41], which are available in the
literature to ensure the safety of the applications that are used in benign data sets. 158 applications were
     literature to ensure the safety of the applications that are used in benign data sets. 158 applications
found to be malicious by at least one antivirus program, namely the VirusTotal scanning, to sustain
     were found to be malicious by at least one antivirus program, namely the VirusTotal scanning, to
safer applications in the data set. As a result, a summary of the data set obtained is shown in Table 1.
     sustain safer applications in the data set. As a result, a summary of the data set obtained is shown in
     Table 1.
                             Table 1. Summary of data set created as per VirusTotal.
                                   Table 1. Summary of data set created as per VirusTotal.
                                  Data Set Type               #                  Source
                                      Data Set Type
                                     Malicious               #
                                                            5545     Source
                                                                          Drebin
                                        Malicious
                                      Benign               5545
                                                            1173     DrebinPlay market
                                                                    Google
                                          Benign           1173 Google Play market

     For the static analysis methods, information obtained from the permissions that the applications
         For the static analysis methods, information obtained from the permissions that the applications
use use
    waswas
         utilized.  In In
             utilized.  related  works,
                           related works,API
                                           APIcalls
                                                  calls are
                                                        are also  usedas
                                                             also used asan
                                                                          anattribute
                                                                             attribute during
                                                                                      during    static
                                                                                             static    analysis;
                                                                                                    analysis; but but
these were  not  included    in this study  because     it involves  source code  analysis. The  architecture
    these were not included in this study because it involves source code analysis. The architecture of the    of the
developed  system
    developed  systemis shown
                         is shownininFigure
                                       Figure1.1.

                                     Figure 1. Architecture of the developed system.
                                       Figure 1. Architecture of the developed system.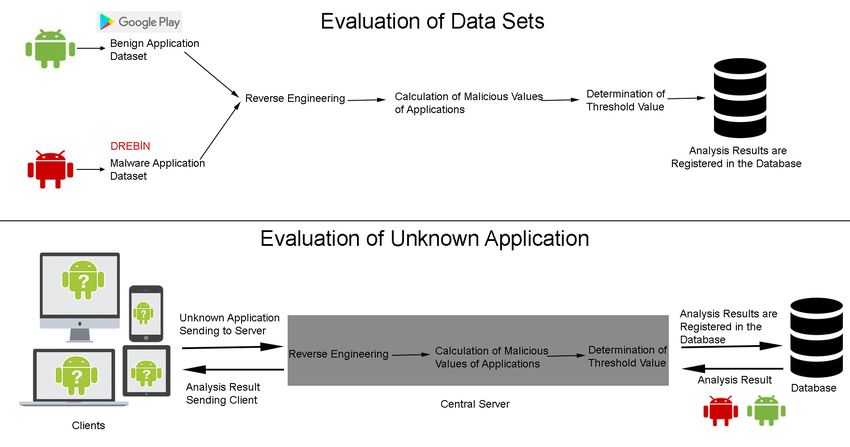
Appl. Sci. 2018, 8, 1622                                                                               5 of 19

      The .apk files in the benign and malicious data sets were reverse engineered using the Apktool
tool. The permissions found in the AndroidManifest.xml file were obtained and then the permissions
that each application possessed were saved in the created database. In the third step, the permissions
found individually in the malicious and benign data sets were obtained. The percentage of availability
of these permissions for malicious and benign data sets was calculated. Lastly, the percentage of
availability for malicious software was subtracted from the percentage of availability for benign
software, and the value that we designated the malicious value was calculated. The formulated
representation of this process was shown in Equation (1).
                                                     n                            n
               Malicious Value of Permission =    ∑i=0 MV_Malicious(t) − ∑i=0 MV_Benign(t)                 (1)

     The total malicious value of each application was obtained by adding and evaluating the malicious
values of the permissions that each application possesses. Additionally, the results of each application
in the VirusTotal database were obtained using the API of VirusTotal in this step. Here, the reason
for using VirusTotal to calculate the malicious values of applications is its ability to show the results
of more than 50 anti-virus programs [42], and it is used in security-based studies in the literature.
The studies of Ban et al. [43] and Wang et al. [15] can be given as examples of these studies. Google’s
subsidiary VirusTotal is a free online service that analyzes files and URLs that identify viruses, worms,
Trojans, and other malicious content, as detected by virus protection engines and website scanners [44].
There are four methods for analyzing Android applications with VirusTotal: the web page, VirusTotal
application installation tool, sending a mail and VirusTotal API. In this study, applications were
analyzed using VirusTotal API. VirusTotal integration was added with the idea of using it for the
purpose of the detection of non-new malware variants. When the literature was reviewed, it was
seen that VirusTotal has been used in many studies. The md5 hash code of the application analyzed
in the static analysis section of the Mobile-Sandbox study was compared with all the hashes in the
VirusTotal database. If the hash is found, the “detection rate” is calculated by dividing the number
of tools classifying the application as malicious by using the number of antivirus tools analyzing the
application [12,45]. In the study conducted by Ban et al., VirusTotal was used to determine whether
the applications used in the data set were malicious [43]. In the study of Wang et al., VirusTotal was
used to generate a data set of benign applications [15]. The VirusTotal score was not evaluated for the
final result, but it was used as a parameter at the point of determining whether the application was
malicious or not. The VirusTotal score is calculated for each application in this study. The formulated
form of this calculation is shown in Equations (2)–(4).

                                       number of permission
                      Total (MV) =   ∑ i=0                    Malicious Value of Permission (t)            (2)

             VirusTotalScore = (The Number of Antivirus Programs that Find The Application
                                                                                                           (3)
                            Malicious/Total Antivirus Program Number) * 100
                           Final Malicious Value = (Total (MV) + VirusTotalScore)/2                        (4)

     A threshold value was determined using the final malicious values of the applications in the
benign and malicious data sets by using the Receiver Operating Characteristics curve. The receiver
operating characteristics curve is drawn as a graph calculated for different threshold values, with the
true positivity (sensitivity) rates on the vertical axis and the false positivity (1-specificity) rates on the
horizontal axis [46]. Figure 2 shows the curve of receiver operating characteristics represents excellent,
good and worthless tests.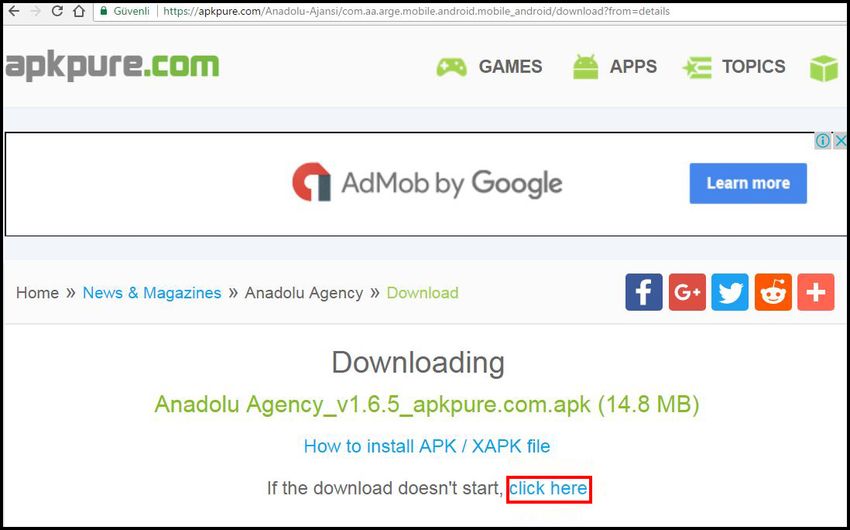
Appl. Sci. 2018, 8, x FOR PEER REVIEW 6 of 19
Appl. Sci. 2018, 8, 1622 6 of 19
Appl. Sci. 2018, 8, x FOR PEER REVIEW 6 of 19
Figure
Figure 2. Comparison
2. Comparison of of receiver operating
receiver operating characteristics
characteristicscurves [47]. [47].
curves
Figure 2. Comparison of receiver operating characteristics curves [47].
When Figure 2 is assessed, the area remaining under the curve represents an excellent test. If the
When Figure
areaFigure 2 2iscurve
under the
is assessed,
assessed,is 0.5,the
the area
area remaining
remaining
it represents under
a worthless
under
test.the
In curve
therepresents
the fifth
curve represents
an excellent
step, the applications
an excellent
test.
were If the
test. Ifdetermined
area under thethearea
curveunder the curve is 0.5, it represents a worthless
as being benign or malicious software based on this threshold value. The were
is 0.5, it represents a worthless test. In the fifth test.
step, the In the fifth
applications step,
determined
the as were
applications beingdetermined
benign
Accord.Statistics.Analysis [48] or asmalicious
being
library benign
was used software
to based
or malicious
calculate the on value
this through
software
threshold threshold
based on value.
the this The
threshold
receiver
value. operating
The characteristics
Accord.Statistics.Analysis [48]curve.
Accord.Statistics.Analysis libraryThe[48]
algorithm
was used of
library the
towas piece
usedofto
calculate code
the used to the
threshold
calculate determine
value the threshold
through
threshold the through
value receiver
the value
operating
receiver by using this
characteristics
operating library,
curve.asThe
characteristics shown in Figure
algorithm
curve. 3. the
A web-based
Theofalgorithm pieceofofthe client
code was
used
piece developed
of for to
to determine
code used evaluating
the threshold
determine the
unknown Android applications. The server made by the Android application was subjected to some
value by using
threshold valuethis library,
by using thisas library,
shown in as Figure
shown3.inAFigureweb-based client was developed
3. A web-based for evaluating
client was developed for
steps; namely, reverse engineering, computing of the malicious value of the application, and
unknown
evaluating Android
unknown applications.
Android The server
applications. made
The by
server the
madeAndroid
by the application
Android was subjected
application
determining of the threshold value respectively. Then, the results of the analysis were saved in the was to some
subjected
steps;
to somenamely, reverse
steps; namely,
database and toengineering,
sentreverse computing
engineering,
the client. computing of the
of themalicious
malicious value
value ofofthe
theapplication,
application, and
determining of the threshold value respectively. Then, the results of the analysis were saved in the
client.
database and sent to the client.
Figure 3. The algorithm used to calculate the threshold value.
Figure 3. The algorithm used to calculate the threshold value.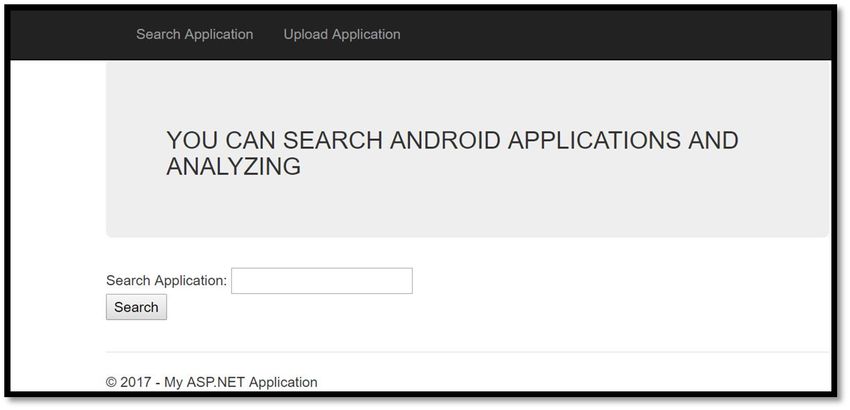
Appl. Sci. 2018, 8, 1622                                                                            7 of 19

      When Figure 3 is considered, in order to use the ReceiverOperatingCharacteristic object,
it is essential that sequences allow the distinguishing of the benign and malicious applications,
and the sequences that hold the total values possessed by the benign and malicious applications
need to have been generated.          These generated sequences were added as input to the
ReceiverOperatingCharacteristic method. In the next step, a threshold value curve with 100 coordinate
values was calculated. True positivity (sensitivity) and false positivity (1-specificity) scores of the
generated coordinate axes were calculated. Those with a true positive rate greater than 90 and a false
positive rate of lower than 15 were added to a list. The (100 - true positivity value) and false positivity
values of the members in this list were added. From among the members in the list, the one with the
lowest value for this was designated as the threshold value.

3.1. Obtaining of Application Information
     Android apps are installed on phones together with .apk archive files. The information contained
in these .apk files is obtained using ready-made tools or libraries. In this study, version 2.2.2 of
Apktool was used to obtain the information in the AndroidManifest.xml file. On the C# Windows
Form application, an application which gets the permission information of Android applications
using Apktool has been developed. This application uses the System.Diagnostics.ProcessStartInfo
class in the C# library to run the command that Apktool uses for reverse engineering. Since there
are 6876 Android applications in total in the data set, parallel processes were used in order to make
the reverse engineering process faster. The application name, target SDK version, minimum SDK
version, and permissions were used, and file names that are available in the AndroidManifest.xml file
of these applications were registered in the database after the reverse engineering was finished for each
application in the benign and malicious data sets. In addition, malicious software family information
was registered in the database for the applications in the Drebin malicious data set.

3.2. Malicious and Benign Application Assessment Process
     In this section, the evaluation process of benign and malicious applications in the datasets is
discussed. First, the singular permissions available in the malicious and benign data sets were found.
This resulted in 1323 different permissions to be found. Then, the number of occurrences of each
permission in the benign and malicious data sets was obtained. By using the number of occurrences
obtained, the rate of occurrences in the benign and malicious data sets were calculated. Finally, the rate
of occurrence in the benign data set was subtracted from the rate of occurrence in the benign data set
in order to obtain the malicious value for each permission.

3.3. Web Application
     The developed Android malware detection system in this study runs according to the client-server
architecture. Because the transactions are conducted on the server side, there is no load generated
on the client side. On the client side, only the analysis result is shown. The most important reason
for performing server-side operations is that Android phone clients have limited resources, such as
battery, processor, and RAM. The capabilities of the developed web application include Google Play
integration, Apktool, VirusTotal, web scraping for APKPure, apkleecher [49] and apkbucket [50].
The application search interface of the developed web application is presented in Figure 4.
     When looking at Figure 4, there are two options on the application splash screen: application
search and application download. In the search for application option, you will be able to search
for words on Google Play. A web-scraping method was used to do this. When the search button
in the application is clicked, the searched word is added at the end of https://play.google.com/
store/search?q=link, then &c=apps and the web page is web-scraped. To perform web scraping, it is
necessary to find the XPath in the information to be obtained. In this application, the information,
obtained from Google Play, is the official name and package name of the application being searched.
For example, if the searched word is “football”, the link to be used for web scraping should be https:
Appl. Sci.
Appl. Sci. 2018,
2018,8,
8,1622
x FOR PEER REVIEW 88ofof19
19
Appl. Sci. 2018, 8, x FOR PEER REVIEW 8 of 19
For example, if the searched word is “football”, the link to be used for web scraping should be
//play.google.com/store/search?q=football&c=apps.
For example, if the searched word is “football”, theTo
https://play.google.com/store/search?q=football&c=apps. getTo
link a list
to begetof related
used applications
for web
a list scrapingaccording
of related should beto
applications
the searched word for this link, there is a need
https://play.google.com/store/search?q=football&c=apps. to
according to the searched word for this link, there is a need find the XPath.
Toto get To find
find athelist the XPath,
of To
XPath. relatedthe relevant
find the link
applications
XPath, the
is enteredlink
according
relevant into
to isan
the Internet
searched
entered browser
word
into for and the
this link,
an Internet mouse
thereand
browser is aright
is need
the clicked
to find
mouse ison
thethe
right opened
XPath. Toon
clicked page.
find The
thethe XPath
XPath,
opened is
the
page.
obtained
relevant by
link selecting
is entered the location
into an of
Internetthe application
browser and information
the mouse ison the
right incoming
clicked
The XPath is obtained by selecting the location of the application information on the incoming screen. on screen.
the An
opened image
page.
showing
The XPaththis
An image is operation
obtained
showing byisoperation
this shown inthe
selecting isFigure 5.in of
location
shown the application
Figure 5. information on the incoming screen.
An image showing this operation is shown in Figure 5.
Figure 4.
Figure 4. The
The application
application search
search interface
interface of
of the
the developed
developedweb
webapplication.
application.
Figure 4. The application search interface of the developed web application.
Figure 5. HTML labels used to determine the Xpath in Google Play.
Figure
Figure 5.
5. HTML
HTML labels
labels used
used to
to determine
determine the
the Xpath
Xpath in
in Google
Google Play.
Play.
When Figure 5 is analyzed, the line marked with red is the section where the application
When
When Figure
information Figure 5 is analyzed,
is located. The mousethe is line
the line marked
marked with
right-clicked with
on thisredmarked
is the section
section, where
then thetheCopy
application
path is
information
clicked, andisisfinally
located.
located.the The
The mouse
mouse
XPath is is is right-clicked
right-clicked
obtained on this
on this
by selecting marked
Copy marked section,
section,
XPath. then
then the
Using the path
Copy Copy
obtained is path is
clicked,
XPath, the
clicked,
and
image, and
finally finally
the XPath
package the
name, is XPath is
obtained
and obtained by
by selecting
application selecting Copy
Copy XPath.
name information XPath.
that Using Using the
the obtained
the applications obtained
haveXPath, XPath,
will bethe the
image,
obtained.
image,
With the
package package
Search
name, name,
and and application
Applications
application option, name information
Android
name information applications that thebeapplications
can
that the applications searched forhave
have will will be obtained.
byobtained.
be application name,
With the
With
Search the
applicationSearch
ApplicationsApplications
packageoption, option,
name,Android Android
or any desired applications
words.
applications canIn can
be Figure
searched be searched
6, for
a search for by application
result based
by application name,on name,
the word
application
application
football name,
package package
or anyname,
is shown. orwords.
desired any desired words.
In Figure In Figure
6, a search result6, based
a search result
on the wordbased on the
football word
is shown.
football is shown.Appl. Sci. 2018, 8, 1622 9 of 19
Appl. Sci. 2018, 8, x FOR PEER REVIEW 9 of 19
Figure 6.
Figure 6. User
User interface
interface of
of the
the developed
developed system
system showing
showing the
the search
search results
results for
for the
the word
word“football”.
“football”.
When Figure
When Figure66 isis analyzed,
analyzed, the the results
results are
are listed
listed based
based on
on the searched
searched word
word “football”.
“football”. Analyses
Analyses
wereconducted
were conductedby byselecting
selectingthe thechosen
chosenapplications
applicationsfromfromthe
thelist.
list. If
If the
the application
application has
has already
already been
been
analyzed, the
analyzed, the result
result isis shown
shown on on the
the client
client side.
side. If there
there was no analysis made earlier,
earlier, the
the application
application
must be
must be downloaded
downloaded first first to
to the
the server.
server. For
For downloading,
downloading, the the application
application isis downloaded
downloaded from from the
the
APKPure site
APKPure sitefirst.
first.AAlink
linksuch
suchasas“https://apkpure.com/UploadName/packagename/download?
“https://apkpure.com/Upload Name /package name/download?
from=details” is created for this process. The most important thing to note here is
from=details” is whether
whether there
there is
is aa
special character
special character in
in the
the application
application name.
name. Special
Special characters
characters in
in application
application names
names need
need toto be
be replaced
replaced
with aa hyphen
with hyphen “-” “-”character.
character. ThisThislink
linkisisused
usedforforweb
webscraping
scrapingon onthe
therelevant
relevantsite.
site.“//
“// * [@ id= \”
id=\”
download_link \\”]”
download_link XPath is
”]” XPath is used
used for
for web
web scraping.
scraping. This link should result in the “click here” link,
as shown
as shown inin Figure
Figure 7,7, on
onthe
the resulting
resultingweb webpage.
page.Appl. Sci. 2018, 8, 1622 10 of 19
Appl. Sci. 2018, 8, x FOR PEER REVIEW 10 of 19
Figure
Figure 7.
7. A
A sample
sample .apk
.apk download
download link
link on
on APKPure
APKPure web
web page.
page.
If the
the application
applicationcannot cannotbebedownloaded,
downloaded, thetheapkleecher
apkleecher sitesite
is used
is usedas aassecond
a secondalternative. For
alternative.
this process, a link like “http://apkleecher.com/download/dl.php?dl=Packet
For this process, a link like “http://apkleecher.com/download/dl.php?dl=PacketName” is created. Name” is created. This
link
This islinkused for for
is used web web scraping
scraping ononthetherelevant
relevant site. site. The XPath
XPath “//body//script[3]”
“//body//script[3]” isisused used for
downloading the link.
If thetheapplication
application cannot
cannotbe downloaded,
be downloaded, apkbucket is used as
apkbucket is aused
third alternative.
as a thirdThis process
alternative.
has
Thisthree
process steps.
hasInthree
the steps.
first step, In athelink,
firstsuch
step,asahttps://apkbucket.net/search?s=Packet
link, such as https://apkbucket.net/search?s= Name, is
created.
PacketName, Thisis created.
link is This usedlink foris used
web for scraping
web scrapingon the on the relevant
relevantsite.site. The The XPath
“/html/body/div/div/div/div/div[1]/div[1]/div/div[3]/a” is used
“/html/body/div/div/div/div/div[1]/div[1]/div/div[3]/a” forfor
is used thethewebweb scraping
scrapingprocess.
process.In In the
the
second step, the XPath XPath “//*[@id=
“//*[@id=\”downloadSection\”]/p[2]/a”
\”downloadSection\”]/p[2]/a”isisused usedfor forthe
theweb
webscraping
scrapingprocess.
process.
In the last step, the XPath “/html/body/div/div/div/div/div[1]/div[1]/div/div[2]/p[2]/strong/a”
“/html/body/div/div/div/div/div[1]/div[1]/div/div[2]/p[2]/strong/a” is used is
for
usedgetting download
for getting the link.
download the link.
After the the application
applicationis isdownloaded,
downloaded, reverse
reverse engineering
engineering is performed
is performed using using
Apktool. With
Apktool.
reverse engineering, the name of the application, the package
With reverse engineering, the name of the application, the package name, the permissions it uses, name, the permissions it uses, the
targetSdkVersion
the targetSdkVersion andand minSdkVersion
minSdkVersion information
informationareareregisteredregisteredinin the the database. After After this
information isisobtained,
obtained, information
information stored
stored in the inVirusTotal
the VirusTotal
database database
is obtained is obtained
using the using the
VirusTotal
VirusTotal API. There are two main constraints: the size of the application
API. There are two main constraints: the size of the application should not be larger than 32,766 should not be larger than
32,766
kilobytes,kilobytes,
and theand the ability
ability to make to four
makequeries
four queries per minute.
per minute. If the Android
If the Android application
application size is size
largeris
larger than 32,766 kilobytes in the VirusTotal database, the registers
than 32,766 kilobytes in the VirusTotal database, the registers will be used. However, if the reverse is will be used. However, if the
reverse
the case,isthethe relevant
case, the sections
relevantwill sections will be assigned
be assigned a −2 value a −2tovalue to distinguish
distinguish them inthem in the database
the database of the
of the relevant
relevant application,
application, and the and the analysis
analysis result
result will willbeonly
only shownbe shown
by makingby making an evaluation
an evaluation based on based
the
on the malicious score of the application. If the results of files with
malicious score of the application. If the results of files with a size of smaller than 32,766 kilobytes a size of smaller than 32,766
kilobytes
are in the are in the VirusTotal
VirusTotal database, the database,
registersthewillregisters
be used.willHowever,
be used. if However, if not, the application
not, the application is scanned
is scanned
using using theAPI.
the VirusTotal VirusTotal
This scanningAPI. Thisprocess scanning
dependsprocess depends
on the usage on theofusage
intensity intensity
VirusTotal and theof
VirusTotal and the file size. Therefore, whether the process is finished
file size. Therefore, whether the process is finished or not is checked every 3 min using the scanning or not is checked every 3 min
using
number theassigned
scanningby number
VirusTotal.assigned by process
If this VirusTotal. takesIf more
this process
than 3 takes
min, more than of
the result 3 min, the result
the analysis is
of the analysis is shown only by evaluating the malicious score of the
shown only by evaluating the malicious score of the application, in order not to keep the user waiting application, in order not to keep
the userlong.
for too waitingOn for
thetoo
other long. On when
hand, the other hand, from
the result whenVirusTotal
the result is from VirusTotal
obtained, is obtained,
it is registered initthe
is
registered
database. in Forthe thedatabase. For the whose
48 applications 48 applications
sizes were whose
largersizes
thanwere 32,766larger than 32,766
kilobytes in the kilobytes
benign and in
the benign and malicious data sets, the VirusTotal web page was visited and the application was
analyzed by manual downloading. Using the calculation method described above, the final maliciousAppl. Sci. 2018, 8, 1622 11 of 19
Appl. Sci. 2018, 8, x FOR PEER REVIEW 11 of 19
malicious data sets, the VirusTotal web page was visited and the application was analyzed by manual
downloading. Using the calculation
value of the application methodIfdescribed
can be obtained. this valueabove, the final
is greater thanmalicious valuevalue
the threshold of thedetermined
application
can be obtained.
by the If this value
receiver operation is greater than
characteristics the threshold
curve, value determined
the application is considered byto
thebereceiver operation
malicious. If it is
characteristics curve, the application is considered to be malicious. If it is smaller than
smaller than threshold value, the the application is considered to be benign and the result is shown threshold value,
the theclient.
to the application is considered to be benign and the result is shown to the client.
In
In the
the Install
Install application
application option,
option, the
the Android
Android application
application on on the
the client
client side
side is
is downloaded
downloaded to to the
the
server
server for analysis. The Android application in the local file system is loaded on the server, and then
for analysis. The Android application in the local file system is loaded on the server, and then
the
the process,
process, starting
starting with
with the
the reverse
reverse engineering
engineering phase,
phase, mentioned
mentioned in in the
the application
application search
search option
option
is
is implemented. After the subprocesses described in the application search and application install
implemented. After the subprocesses described in the application search and application install
process
process are
are finalized,
finalized,the
theanalysis
analysisresults
resultsare
areshown
shownin inFigure
Figure8.8.
Figure 8.
Figure 8. User interface showing the
the results
results of
of the
the application
application analysis.
analysis.
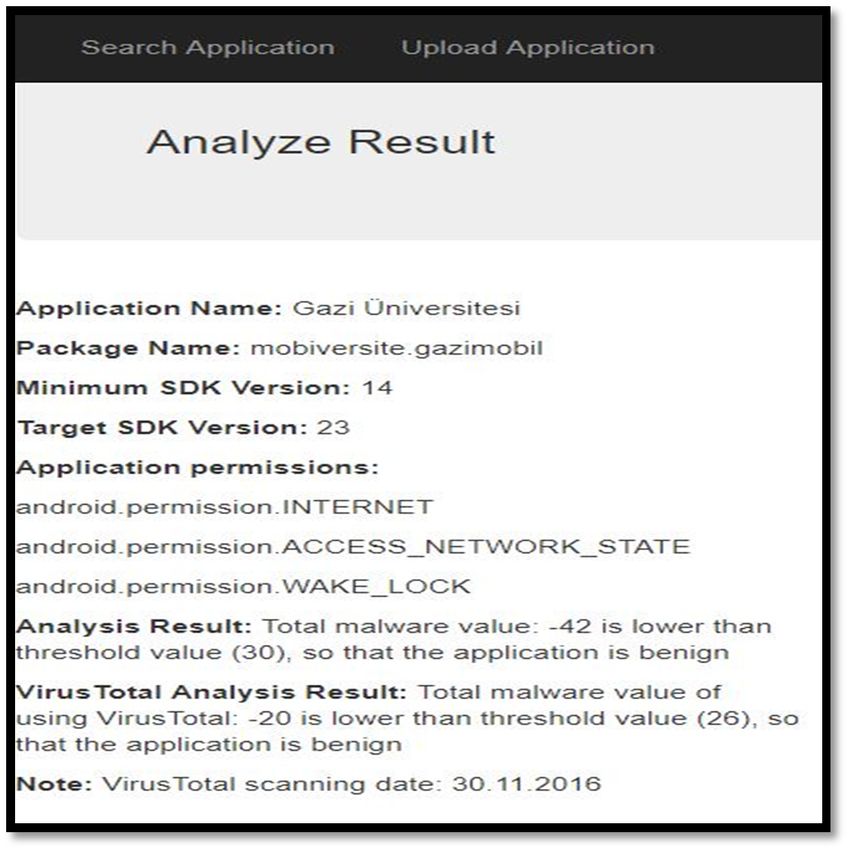
Examining
ExaminingFigure
Figure8,8,the result
the of of
result thethe
analysis shows
analysis the name
shows of theofapplication,
the name the package
the application, name,
the package
the version
name, of Android
the version it runs on,
of Android the permissions
it runs it requests,itand
on, the permissions two analysis
requests, results.
and two Theresults.
analysis calculation
The
method usedmethod
calculation by the first
usedanalysis result
by the first in the evaluation
analysis result in thebased on the permissions
evaluation based on thefound in the benign
permissions found
and malicious
in the benign anddatamalicious
sets. The calculation
data sets. The method used bymethod
calculation the second
usedanalysis result, however,
by the second is the
analysis result,
calculation
however, isthat
theVirusTotal
calculation hasthat
added to the calculation
VirusTotal has added used in the
to the first analysis
calculation usedmethod.
in the Furthermore,
first analysis
the user isFurthermore,
method. provided with thethe
userdate information
is provided withofthe
thedate
scaninformation
made on VirusTotal.
of the scan made on VirusTotal.
4.
4. Results
Results and
and Discussion
Discussion
In
In this
this study,
study, 5545
5545 malicious
malicious applications
applications from
from the
the Drebin
Drebin data
data set
set and
and 1173
1173 benign
benign applications
applications
manually
manually downloaded from the Google Play market were employed. In the web
downloaded from the Google Play market were employed. In the developed application,
developed web
users can analyze any application based on the model created by using the information
application, users can analyze any application based on the model created by using the information of the
applications in the in
of the applications datasets. The permissions
the datasets. that the
The permissions thatapplications in theinbenign
the applications data data
the benign set use
setand
use
number of uses are shown in Table 2.
and number of uses are shown in Table 2.Appl. Sci. 2018, 8, 1622 12 of 19
Table 2. 10 permissions used most in benign data set.
Permission Name Total
android.permission.INTERNET 1306
android.permission.ACCESS_NETWORK_STATE 1142
android.permission.WRITE_EXTERNAL_STORAGE 930
android.permission.WAKE_LOCK 774
com.google.android.c2dm.permission.RECEIVE 679
android.permission.ACCESS_FINE_LOCATION 533
android.permission.VIBRATE 520
android.permission.ACCESS_COARSE_LOCATION 492
android.permission.GET_ACCOUNTS 473
android.permission.ACCESS_WIFI_STATE 462
When Table 2 is examined, the most commonly used permission is the INTERNET permission, found
in 1173 benign data sets. Thus, almost all applications require the use of the Internet. The permissions
that the applications in the malicious data set use and number of uses are shown in Table 3.
Table 3. 10 permissions used most in malicious data set.
Permission Name Total
android.permission.INTERNET 5332
android.permission.READ_PHONE_STATE 4939
android.permission.WRITE_EXTERNAL_STORAGE 3722
android.permission.ACCESS_NETWORK_STATE 3677
android.permission.SEND_SMS 2992
android.permission.RECEIVE_BOOT_COMPLETED 2671
android.permission.ACCESS_WIFI_STATE 2430
android.permission.RECEIVE_SMS 2135
android.permission.WAKE_LOCK 2128
android.permission.READ_SMS 2081
When Table 3 is analyzed, the most commonly used permission in the malicious data
set is the INTERNET permission, as in the case of the benign data set. The INTERNET,
READ_PHONE_STATE, WAKE_LOCK, WRITE_EXTERNAL_STORAGE, ACCESS_WIFI_STATE,
and ACCESS_NETWORK_STATE permissions are common in the 10 permissions most commonly
used in both the malicious and benign data sets. It is considered that it is natural for the permissions
INTERNET, ACCESS_WIFI_STATE and ACCESS_NETWORK_STATE to be common in both benign
and malicious data sets, since these permissions authorize the application to use the Internet.
In addition, READ_PHONE_STATE, WRITE_EXTERNAL_STORAGE, SEND_SMS, RECEIVE_SMS,
and READ_SMS permissions are common in the permissions that Android has identified as dangerous
permissions, and in the 10 most used permissions in the malicious data sets. Table 4 shows some of the
results obtained as a result of the transactions carried out.Appl. Sci. 2018, 8, 1622 13 of 19
Table 4. Permissions with the highest and lowest malicious value.
Number of Occurrences Number of Occurrences Rate of Occurrences in Rate of Occurrences in
Permission Name Malicious Value
in Malicious Data Set in Benign Data Set Malicious Data Set (%) Benign Data Set (%)
android.permission.READ_PHONE_STATE 4939 369 89 28 61
android.permission.SEND_SMS 2992 33 54 2 52
android.permission.READ_SMS 2081 27 38 2 36
android.permission.RECEIVE_SMS 2135 51 39 4 35
android.permission.RECEIVE_BOOT_COMPLETED 2671 296 48 22 26
com.android.launcher.permission.INSTALL_SHORTCUT 1414 55 26 4 22
android.permission.WRITE_SMS 1239 8 22 1 21
android.permission.CAMERA 227 274 4 21 −17
android.permission.READ_EXTERNAL_STORAGE 333 301 6 23 −17
android.permission.ACCESS_NETWORK_STATE 3677 1142 66 86 −20
android.permission.WAKE_LOCK 2128 774 38 58 −20
com.google.android.providers.gsf.permission.READ_GSERVICES 1 289 0 22 −22
android.permission.GET_ACCOUNTS 443 473 8 36 −28
com.google.android.c2dm.permission.RECEIVE 380 679 7 51 −44Appl. Sci. 2018, 8, 1622 14 of 19
When examining Table 4, the READ_PHONE_STATE permission is the one with the highest
malicious value. This permission is followed by SEND_SMS, READ_SMS, RECEIVE_SMS and
RECEIVE_BOOT_COMPLETED permissions. READ_PHONE_STATE, SEND_SMS, RECEIVE_SMS,
READ_SMS, and READ_CONTACTS are also permissions in common with the permissions that
Android has identified as dangerous permissions.
The confusion matrix is used to calculate the evaluation results. Accuracy, error rate, true positive
rate, false positive rate, true negative rate and false negative rate equations are shown below.
Accuracy: (TN + TP)/Total (5)
Error Rate: 1 − Accuracy (6)
True Positive Rate: TP/(FN + TP) (7)
False Positive Rate: FP/(TN + FP) (8)
True Negative Rate: TN/(TN + FP) (9)
False Negative Rate: FN/(FN + TP) (10)
True Positive (TP), number of malware applications that are classified truly as malware. False
Negative (FN), number of malware applications that are classified incorrectly as benign. False Positive
(FP), number of benign applications that are classified incorrectly as malware. True Negative (TN),
number of benign applications that are classified truly as benign.
In this study, different methods were used to evaluate benign and malicious data sets. The first
method is the evaluation based on 197 permissions that the applications possess in the data sets that
are available in Android version of 4.1. In this method, while the malicious values of the applications
are calculated, the permissions, except for these 197 permissions, are ignored. The malicious values
of the apps are calculated by adding the malicious values of the Android 4.1 permissions that the
applications possess. The results obtained based on this evaluation are shown in Table 5.
Table 5. Results of evaluation based on the permissions in Android version 4.1.
Number of Number of False Rate of Correct Rate of False
Correct Detection Detection Detection (%) Detection (%)
Benign Data Set 1106 67 94.29 5.71
Malicious Data Set 5136 409 92.62 7.38
Overall 6242 476 92.91 7.09
When Table 5 is examined, the correct detection rate of the benign data set according to the
relevant evaluation is 94.29%. The correct detection rate in the malicious dataset is 92.62%. The overall
correct detection rate is 92.91%, and the overall false detection rate is 7.09%.
The second method is an evaluation based on the permissions used by the applications in the
benign and malicious data sets. In this method, the malicious values of the applications are calculated
by adding the malicious values of the permissions the applications possess. The result obtained based
on this evaluation is shown in Table 6.
Table 6. Evaluation results based on the permissions the applications in the data sets possess.
Number of Number of False Rate of Correct Rate of False
Correct Detection Detection Detection (%) Detection (%)
Benign Data Set 1129 44 96.25 3.75
Malicious Data Set 5164 381 93.13 6.87
Overall 6293 425 93.67 6.33Appl. Sci. 2018, 8, 1622 15 of 19
When Table 6 is examined, the correct detection rate of the benign data set according to relevant
evaluation is 96.25%. The correct detection rate in the malicious dataset is 93.13%. The overall correct
detection rate is 93.67%, and the overall false detection rate is 6.33%.
The third method is the evaluation in which the malicious values of the applications are calculated
by using the VirusTotal values of the applications and the first method. That is, it is the evaluation made
using VirusTotal values of the applications in the benign and malicious data sets and 197 permissions
and applications in Android version 4.1. The obtained results based on this evaluation are shown in
Table 7.
Table 7. Evaluation results based on the permissions in Android 4.1 and VirusTotal.
Number of Number of False Rate of Correct Rate of False
Correct Detection Detection Detection (%) Detection (%)
Benign Data Set 1136 37 96.85 3.15
Malicious Data Set 5406 139 97.49 2.51
Overall 6542 176 97.38 2.62
When Table 7 is examined, the correct detection rate of the benign data set according to relevant
evaluation is 96.85%. The correct detection rate in the malicious dataset is 97.49%. The overall correct
detection rate is 97.38% and the overall false detection rate is 2.62%.
The fourth method is the evaluation in which the malicious values of the applications are
calculated using the VirusTotal values of the applications and the second method. That is, it is
the evaluation made using the VirusTotal values of the permissions and the applications that the
applications in benign and malicious data sets use. The results obtained based on this evaluation are
shown in Table 8.
Table 8. Evaluations results based on the permissions in the data sets and VirusTotal.
Number of Number of False Rate of Correct Rate of False
Correct Detection Detection Detection (%) Detection (%)
Benign Data Set 1151 22 98.12 1.88
Malicious Data Set 5407 138 97.51 2.49
Overall 6558 160 97.62 2.38
When Table 8 is examined, the correct detection rate of the benign data set according to the
relevant evaluation is 98.12%. The correct detection rate in the malicious dataset is 97.51%. The overall
correct detection rate is 97.62%, and the overall false detection rate is 2.38%. Among these four
methods, the method with the highest performance rate is the method using the permissions in benign
and malicious data sets together with VirusTotal. The use of VirusTotal in the calculation method
increased the success of the system as seen in the results given above. Moreover, evaluation based
on permissions on the specified Android version was the least effective method. It is believed that
this is the result of the exclusion of special permissions and the permissions released after Android
version 4.1. The comparison of the developed system with studies using the static analysis method in
the literature is shown in Table 9.
When Table 9 is examined, permissions and API calls are used as attributes in general. Genom
and Drebin data sets have been commonly preferred for the evaluation of the proposed tools or
methods in literature. The detection rate of malicious applications was used as an evaluation criterion.
The proposed tools or methods were applied to both the malicious and the benign data sets. The success
rates vary between 80% and 99.2%. Our study differs from the others because users can easily analyze
Android applications by using our developed web application, and we used a web-scraping technique.Appl. Sci. 2018, 8, 1622 16 of 19
Table 9. Comparison of static analysis methods.
Studies Attributes Dataset Success Rate (%)
238 Malicious Data Sets
DroidMat [7] Permissions and API calls 97.87%
1500 Benign Data Sets
Android Manifest File and source Drebin Malicious Data Set
Drebin [9] 94%
codes 123,453 Benign Data Sets
Drebin Malicious Data Set
Kayabasi [37] Permissions and API calls 99.20%
1400 Benign Data Sets
Drebin and Genome
APK Auditor [11] Permissions Malicious Data Set 88.28%
1853 Benign Data Sets
Permissions, intentions, API calls, 8701 Malicious Data Sets 99.39% for Malicious
Wang et al. [15]
hardware features and info on coding 107,327 Benign Data Sets Data Set
1050 Malicious Data Sets
Wu et al. [51] DexFile andAPI calls 97.66%
1160 Benign Data Sets
97.62% For Malicious
50 Malicious Data Sets
Arslan et al. [18] Dexfile and Permissions Data Set
25 Benign Data Sets 80% for Benign Data Set
The developed system (based on Drebin Malicious Data Sets
Permissions 97.38%
permissions in Android 4.1 and VirusTotal) 1173 Benign Data Sets
The developed system (based on the Drebin Malicious Data Sets
Permissions 97.62%
permissions in data sets and VirusTotal) 1173 Benign Data Sets
5. Conclusions
In this study, the proposed system was developed to detect malicious applications independently
from mobile device resources. The performances of the four different calculation models on the
applications were tested with benign and malicious data sets. The highest success rate of these four
calculation methods was the calculation method in which the permissions in the benign and malicious
data sets were used together with VirusTotal, with a rate of 97.62%. The calculation method that
demonstrated the lowest success rate of 92.91% was the calculation method that made the evaluation
based on the permissions in Android Version 4.1. It is seen that the reason behind this failure is that it
ignores the special permissions and permissions released after that Android version.
The most successful calculation model was applied to the proposed detection systems based on
the client-server architecture to analyze applications that are not known to be benign or malicious.
The users are able to analyze any Android application by uploading or searching in markets without
installing the application on their mobile devices. Thus, possible impacts of the malicious applications
on the mobile devices can be prevented in advance.
Within the framework of this study, it is important to ensure the use of the static analysis method,
as well as the usage of other features found in the .apk file, in the remediation efforts of the system.
For future studies, it is planned to conduct a study which analyzes the proposed system that is
supported by dynamic analysis techniques, along with the static ones, to improve the accuracy of the
developed system.
Author Contributions: Project administration, İ.A.D.; Software, İ.A.D. and Ö.K.; Writing—original draft, İ.A.D.
and Ö.K.; Writing—review & editing, İ.A.D. and Ö.K.
Funding: This research received no external funding.
Conflicts of Interest: The authors declare no conflict of interest.
References
1. IDC. Smartphone OS. Available online: https://www.idc.com/promo/smartphone-market-share/os
(accessed on 20 August 2018).
2. G DATA. G DATA Mobile Malware Report H1 2016. Available online: https://file.gdatasoftware.com/web/en/
documents/whitepaper/G_DATA_Mobile_Malware_Report_H1_2016_EN.pdf (accessed on 20 August 2018).
3. Cunningham, E. Keeping You Safe with Google Play Protect. Available online: https://blog.google/
products/android/google-play-protect/ (accessed on 20 August 2018).You can also read


