MIT-SCAN-T3 Instruction Manual - MIT Mess- und Prüftechnik ...
←
→
Page content transcription
If your browser does not render page correctly, please read the page content below
Instruction Manual
                      MIT-SCAN-T3
                  MIT Mess- und Prüftechnik GmbH
                       www.mit-dresden.de

Version 02/2021
Page 2
Instruction Manual MIT-SCAN-T3                                                   Version 02/2021

Table of contents
1 Method and requirements .............................................................. 7
1.1 Measuring method ...................................................................... 8
1.2 Reflectors ................................................................................... 9
1.2.1 Measuring range .................................................................... 11
1.3 Measurement environment ........................................................ 12
1.4 Device calibration ..................................................................... 13
2 Thickness measuring device ......................................................... 14
2.1 Interfaces ................................................................................ 15
2.1.1 Recharging the device ............................................................ 15
2.1.2 Data exchange via USB interface ............................................. 16
2.1.3 Headphone interface .............................................................. 16
2.1.4 Bluetooth interface ................................................................. 16
2.2 Device number and firmware ..................................................... 17
2.3 Carrying strap........................................................................... 17
2.4 External charging cradle ............................................................ 18
2.5 Operation ................................................................................. 19
2.6 Main Menu ............................................................................... 19
2.6.1 Menu “Measure” .................................................................... 20
2.6.2 Menu “Data” .......................................................................... 21
2.6.3 Menu “Settings” ..................................................................... 22

                                                                                                       Page 1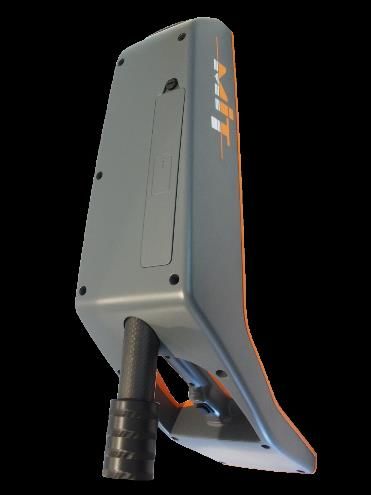
Instruction Manual MIT-SCAN-T3                                                 Version 02/2021

         3 Performing a measurement........................................................... 22
         3.1 Before the measurement ........................................................... 22
         3.2 Measuring sites set up on MIT-SCAN-T3 ...................................... 24
         3.2.1 Layer system ......................................................................... 25
         3.2.2 Select reflectors ..................................................................... 26
         3.2.3 Automatic circular plate recognition ......................................... 26
         3.3 Measuring procedure ................................................................. 28
         3.3.1 Reflector search ..................................................................... 28
         3.3.2 Measurement ......................................................................... 31
         3.3.3 Results display ....................................................................... 33
         3.3.4 Calculated layer thickness ....................................................... 33
         3.3.5 Measured reflector ................................................................. 35
         3.3.6 Material quality coefficient ...................................................... 35
         3.3.7 Reflector test ......................................................................... 37
         3.4 Functionality check acc. to TP D-StB 12 ...................................... 38
         4 Warnings and error messages ....................................................... 39
         5 MIT Project Software ................................................................... 43
         5.1 License key and copy protection ................................................. 44
         5.2 Program settings....................................................................... 45
         5.3 Selection of devices................................................................... 46
         5.4 Set up of measuring sites at the PC ............................................ 47

Page 2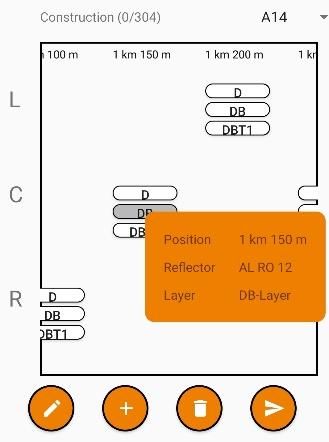
Instruction Manual MIT-SCAN-T3                                                 Version 02/2021

5.5 Selection of measured values ..................................................... 50
5.6 Correct and delete data ............................................................. 51
5.7 Synchronize and save data ........................................................ 52
5.8 Form sheet ............................................................................... 53
5.8.1 Form sheet settings ................................................................ 53
5.8.2 Data transfer for site measuring .............................................. 54
5.8.3 Calculations in the measurement sheet .................................... 55
5.8.4 Setting up a form sheet .......................................................... 56
5.9 GPS data and Google maps........................................................ 57
6 MIT-SCAN-T3 App ........................................................................ 59
6.1 Start Screen ............................................................................. 60
6.2 Prepared measuring points ........................................................ 60
6.3 Measurement ........................................................................... 61
6.4 Data management .................................................................... 62
7 Firmware/Software update ........................................................... 63
8 Plausibility check ......................................................................... 63
9 Technical data ............................................................................. 64
10 Scope of delivery ....................................................................... 65

                                                                                                    Page 3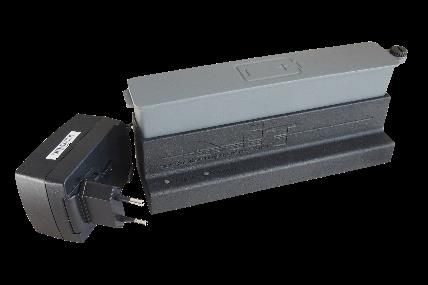
Instruction Manual MIT-SCAN-T3                              Version 02/2021

         Liability
         The manufacturer assumes no liability for any damages arising from
          • failure to observe the instructions in this manual,
          • use of the device for unintended purposes,
          • non-compliance with the safety instructions.

         The manufacturer assumes no liability for printing errors or other
         inaccuracies in the instruction manual.

Page 4
Instruction Manual MIT-SCAN-T3                               Version 02/2021

Safety instructions
 • Recharge the battery when the corresponding icon appears on the
     display. Do not leave the device unattended while charging.
 • Power off the device before exchanging the battery.
 • Do not use the device if the housing is damaged.
 • Observe the operating conditions (e.g. operating temperature)
     specified under “Technical data” to prevent damage to the device.
 •   Though the housing seals have been tested extensively, it is
     possible that water may enter the device during heavy rainfall. If
     this happens, stop operating the device and ensure it is completely
     dry before using it again.
 •   When taking measurements on hot asphalt make sure only the
     sensor unit contacts the asphalt. Electronics as well as mechanical
     parts of the control unit are designed for the from −10 °C to
     +50 °C only.
 •   Observe local safety regulations when performing measurements.
 •   Mechanical loads, such as permanent vibrations or impacts on a
     hard surface may cause damages and malfunctions such as
     measurement errors. In this case, the device has to be checked by
     the manufacturer and, if necessary, has to be recalibrated.

                                                                               Page 5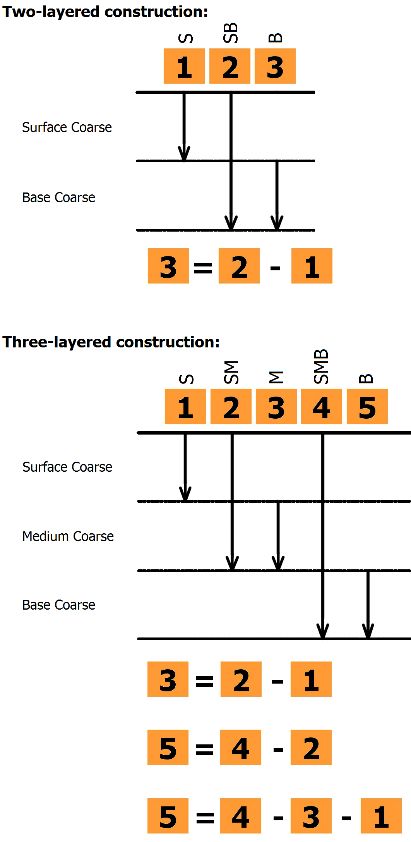
Instruction Manual MIT-SCAN-T3                               Version 02/2021

          • The device may only be used or moved when the telescopic tube is
            locked.
          • No structural changes may be made (replacement or additional
            attachment of objects).
          • The device may only be used for thickness measurements according
            to ASTM E3209, AASHTO T-T359 or German Standard TP D-StB 12.
          • Warranty service will only be accepted if only original accessories or
            reflector types have been used. The device is calibrated by the
            manufacturer with standardized reflectors (standard procedure).
            Differing material may cause wrong measurement results as the
            calibrations do not match with reflector types.

Page 6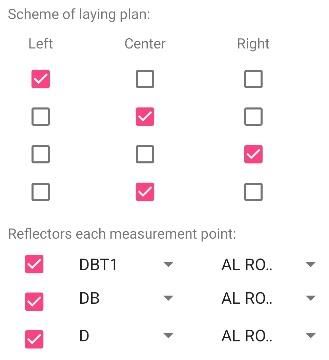
Instruction Manual MIT-SCAN-T3 Version 02/2021
1 Method and requirements
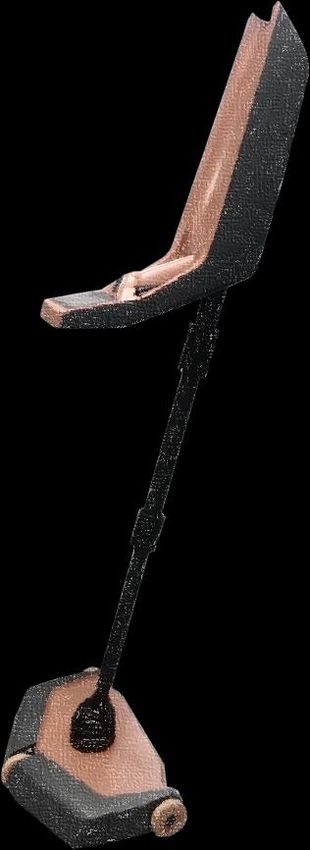
MIT-SCAN-T3 provides the user with accurate and non-destructive
measurement of asphalt and concrete pavement layer thickness in
accordance with ASTM E32091, AASHTO T-T3592 and German
standard TP D-StB 123.
The device uses pulse induction, a further development of eddy current
technology. It requires that aluminum or galvanized steel reflectors
are installed under each layer to be measured.
The measurement technique is based on the principles of magnetic
induction tomography and analyzes the temporal and spatial course of
eddy current fields generated in standardized reflectors.
MIT-SCAN-T3 can be used on all layers of surfacing materials
common in building and road construction such as bituminous
composites, concrete or blast furnace slag. Areas of use include new Fig. 1 MIT-SCAN-T3
road/ road structure construction, sub-base construction as well as
pavement inspection and rehabilitation of existing roads Attention!
Only install reflectors
1 Issued by ASTM International. specified by MIT
2 Issued by American Association of State and Highway Transportation Officials.
3
TP D-StB 12, “Technical specifications for determining pavement layer thicknesses in
road construction”, issued by FGSV Verlag GmbH.
Page 7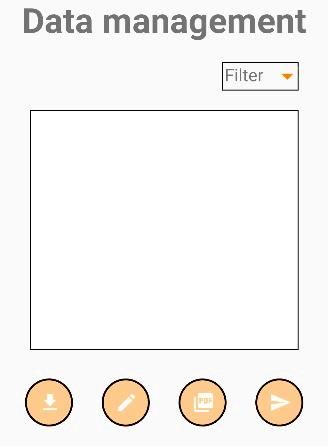
Instruction Manual MIT-SCAN-T3                                Version 02/2021

                         1.1 Measuring method
                         Electromagnetic layer thickness measurement with MIT-SCAN-T3 is
                         based on pulse induction technology. The method requires reflectors to
                         act as antipoles at the base of the layer being measured (s. section
                         1.2, p. 9).
Fig. 2 Emission field
                         The MIT-SCAN-T3 measuring probe is equipped with an emission coil
                         and four sensors (s. Fig. 2 Emission field).
                         The emission coil emits a magnetic field at regular intervals. This field
                         induces a current in the installed antipole (s. Fig. 3 Induced current).
                         As it subsides temporally, a response field is generated (s. Fig. 4
                         Response field) which in turn is recorded by the four sensors and
Fig. 3 Induced current   evaluated by the device.
                         During a measurement run over a reflector, up to 200 pulses are
                         emitted and signals recorded. This data quantity ensures the high
                         reliability of the measuring method.

Fig. 4 Response field

 Page 8
Instruction Manual MIT-SCAN-T3 Version 02/2021
1.2 Reflectors
Special note:
Name Description Material Max. Devices are calibrated and
thickness depth4 validated for use with
AL RO 07 Circular plate 1.0 mm 12 cm specified reflectors.
AL RO 12 Diameter: 7, 12 and 30 cm 1.0 mm 18 cm Reflectors must be of
AL RO 30 Material: Aluminum 0.5 mm 35 cm verified quality.
MIT circular reflectors
AL RE 30x70 Rectangle (foil/sheet) 0.1/0.3 mm 50 cm carry MIT´s logo.
Width x Length 30 x 70/100 cm
AL RE 30x100 0.1/0.3 mm 50 cm The packaging comes with
Material: Aluminum
quality seal (s. Fig. 5) and
ST RO 12 Circular plate 1.00 mm 18 cm label showing a batch
Diameter: 12 and 30 cm number.
ST RO 30 Material: Steel 0.65 mm 35 cm
Table 1 Description of the available antipoles
4
Information about the measuring range: see Table 2 Measuring range of Fig. 5 Quality seal
reflectors
Page 9Instruction Manual MIT-SCAN-T3 Version 02/2021
Reflectors supplied by MIT are checked and verified thru control tests.
A certificate is issued for each batch. If required, this certificate may be
viewed or requested at MIT by the user (s. Fig. 6). MIT plates are
imprinted with the MIT logo to avoid confusion with any reflector
imitations not validated for the use of MIT-SCAN-T3.
Please ask MIT for a list with tested suppliers of circular plates in your
country.
Attention: Measuring device and reflectors are one unit. If
unauthorized or damaged reflectors are used, the accuracy of
the layer thickness measurement system can’t be guaranteed.
There may be significant variations between measured
thickness and real thickness.
Fig. 6 Reflector quality
validation certificate
Page 10Instruction Manual MIT-SCAN-T3 Version 02/2021
1.2.1 Measuring range
Please note:
MIT-SCAN-T3 guarantees the correctness of the measurement results
If other measuring ranges
only for the specified measuring ranges and approved reflectors.
are required, please contact
the manufacturer.
Name Standard measuring range
AL RO 07 1,5 - 12 cm
AL RO 12 1,5 - 18 cm
AL RO 30 4,0 - 35 cm
AL RE 30x70, 30x100 (100 µm) 1,5 - 50 cm
AL RE 30x70, 30x100 (300 µm) 2,0 - 50 cm
ST RO 12 1,5 - 18 cm
ST RO 30 4,0 - 35 cm
Table 2 Measuring range of reflectors
Page 11Instruction Manual MIT-SCAN-T3 Version 02/2021
1.3 Measurement environment
Metallic objects should not be present within a radius of one meter
around a measurement point, such as:
Manhole covers
Drains
Fig. 7 Imprinted MIT plate Road restraint systems (crash barriers)
Other reflectors
Cars, construction machinery
Strong electromagnetic fields (caused for example by radar systems,
radio masts, underground cables) in the environment of a measuring
point can influence the measuring accuracy. The influence depends on
the strength of the source and the distance to it. If it is suspected, that
strong electromagnetic fields are located near to a measuring point,
several measuring runs should be carried out at this measuring point.
If the deviation of the individual results is higher than the specified
device tolerance, this can be an indication of the influence of
electromagnetic fields on the measurement signal.
Wearing safety footwear such as steel-toed boots has no influence on
the measurement as long as they are not too close to the probe.
Page 12Instruction Manual MIT-SCAN-T3 Version 02/2021
Conditions that have no impact on the measurement are
Wet roads
Hot asphalt
Slightly freezing temperatures
1.4 Device calibration
The German standard TP D-StB 12 stipulates annual recalibrations of
the thickness measurement device. Depending on the country of use,
there may be regulations from the authorities regarding calibration
requirements.
In order to obtain accurate measurement results, the device should be
serviced and calibrated at regular intervals even if it’s not required by Fig. 8 Calibration label
the authorities.
Please note:
The user commissions the calibration of relevant reflector sizes. A valid
In Germany, the TP D-StB 12
certificate of calibration with a tabular and graphical report of the test standard stipulates the need
results is issued for each calibrated reflector type. for calibration of thickness
Only calibrated reflectors are visible and selectable in the menu of the measuring devices on an
annual basis.
device. Uncalibrated and hidden formats can be reactivated with the
next calibration, in case the area of application changes and additional
reflectors are required.
Page 13Instruction Manual MIT-SCAN-T3 Version 02/2021
(8) The date of the last calibration will appear on the display when the
device is switched on. Additionally, the next calibration due date is
indicated on a calibration label on the device's probe (s. Fig. 8).
(1)
2 Thickness measuring device
(6)
The measuring device consists of two functional units (s. Fig. 9):
(5) (1) Control unit
(2) Measuring probe
(7)
They are connected by a telescopic rod. The telescopic rod is secured
(4)
with tube locks (4).
The control unit is equipped with:
(3) (5) Display
(2) (6) Directional pad (D-pad)
(7) Search key
(8) Interfaces for a USB flash drive, headphones and charger
Coils for emitting and receiving signals are integrated in the probe. The
traversed measurement path is determined based on the front wheel's
Fig. 9 MIT-SCAN-T3 design rotation.
Page 14Instruction Manual MIT-SCAN-T3 Version 02/2021
Preparing MIT-SCAN-T3 for operation:
Remove the device from its transport box and loosen both tube
locks by turning them counterclockwise.
Extend the middle tube segment of the telescopic rod to the
desired length and tighten the upper tube lock.
Align control unit and probe by turning the lower tube segment
by 90 degrees counterclockwise.
Extend the lower segment and tighten the tube lock.
2.1 Interfaces
At the upper end of the control unit under a lid are three interface
connections (s. Fig. 10):
1) Battery charger
2) USB flash drive 1) 2) 3)
3) Headphones
Fig. 10 Interfaces
2.1.1 Recharging the device
The integrated battery can be charged directly in device. Connect the
supplied power adapter or the 12 V car charger to the recharge port on
the device. The battery charge level is shown on the display. A full
recharge of the battery will take about 1.5 hours.
Page 15Instruction Manual MIT-SCAN-T3 Version 02/2021
2.1.2 Data exchange via USB interface
With USB interface, measurement data can be exchanged between
device and PC. Connect a USB flash drive to device and opening the
Main Menu starts the automatic synchronization of data between MIT-
SCAN-T3 and USB flash drive. Remove the USB flash drive after having
exchanged data successfully. Measurement data is stored in file “MIT-
SCAN-T3_device number.T3”. Use MIT Project Software to import this
file into a form sheet for further processing.
2.1.3 Headphone interface
This interface provides a connection for headphone with 3.5 mm audio
jack. During a reflector search, acoustic signals are emitted depending
on the received signal. Using headphones will make it easier to locate
reflectors in high-noise environments.
2.1.4 Bluetooth interface
Bluetooth module allows wireless connection to mobile Apps.
Page 16Instruction Manual MIT-SCAN-T3 Version 02/2021
2.2 Device number and firmware
Device number can be found on a label below the USB, headphone and
charger interface. Device number, firmware version and last calibration
date will also appear on the bottom line of the start screen after
power-on (s. Fig. 11).
Fig. 11 Start screen
2.3 Carrying strap
The attachment of the carrying strap is shown in Fig. 12. The carabiner
of the belt is inserted into the eyebolt at the upper end of the control
unit case. Open the loop at the other end of the belt, place it directly
below the control unit case around the tube and close it using the snap
button.
To release the snap button the knob (s. detail Fig. 12) must be pulled
upwards. If the mechanism is sufficiently relieved, the two components
are release from each other and the loop is opened. To lock the snap
button, the ball head of the pin must be pressed into the buttonhole
until both parts engage into each other.
The device with connected strap is shown in Fig. 1 (p. 7).
Fig. 12 Carrying strap
Page 17Instruction Manual MIT-SCAN-T3 Version 02/2021
2.4 External charging cradle
The (replacement) battery can be charged outside device (e.g. in the
office or car) with the charging cradle (accessory part). The charging
cradle works with both charging cables, which are delivered with MIT-
SCAN-T3.
The battery can be quickly removed or replaced without additional
Fig. 13 External cradle
tools:
1. Loosen the screw
2. Remove the battery
3. Insert replacement battery
4. Tighten the screw
Fig. 14 Inserting the battery
Page 18Instruction Manual MIT-SCAN-T3 Version 02/2021
2.5 Operation
To switch on the device, simultaneously press the search button
(s. Fig. 9 (7), p. 14) and the “ ” key on the D-pad.
Navigate comfortably through the menu options via D-pad (s. Fig. 15):
Navigation , , and Fig. 15 D-pad
Select or confirm
Back/ Power off Press for 3 seconds.
The respectively activated key is shown in the footer of the screen.
2.6 Main Menu
After power-on, the Main Menu (s. Fig. 16) with the three sub-menu
options is displayed:
“Measure” Perform measurements
“Data” Review of saved measurement data
“Settings” Set basic device settings Fig. 16 Main Menu
The footer of the main menu contains date, time and battery charge
level.
Page 19Instruction Manual MIT-SCAN-T3 Version 02/2021
2.6.1 Menu “Measure”
After selecting the measurement menu, first determine the
construction project (s. Fig. 17):
“Preset Measuring Sites”:
Measuring site plans set up with MIT's project management
Fig. 17 Menu - Measure software (s. sec. 5.4, p. 47) can be displayed and executed in
this menu. Numbers in brackets indicate how many of the total
number of measuring sites in the measuring site plan have
Construction project
already been measured.
selection:
“Preset measuring site”: “Manual input”:
Projects preset at the PC Here new projects are set up or activated and implemented (s.
“Manual input”: sec. 3.2, p. 24).
Current project or “Measuring without input”
preset new projects In this menu item, the measurement can be run directly
“Measuring without input” without any site data. Only installed reflector type has to be
Measuring without chosen correctly.
construction project
details
Page 20Instruction Manual MIT-SCAN-T3 Version 02/2021
2.6.2 Menu “Data”
This menu item shows saved measurement results sorted according to
date.
Already measured sites can be activated and measured again (s. Fig.
18). The measured value is displayed on the right hand site of the Fig. 18 Menu - Data
display. If more than one measurement result is available for a site, the
last three values are shown.
Relocate measuring sites
After the data set is activated, the site can be measured again by
pressing the key. The device will go to the measurement menu and
take the site information of the saved data set. If a saved data set Fig. 19 Dataset display
contains GPS information, the measuring site can be relocated with the
help of this information. The distance and direction from the current Relocate measuring
position to the saved position will be displayed on the right side of the site:
screen (s. Fig. 19). This requires that current GPS data can be 1. Select measuring site
received. 2. To “Remeasure” select
button
3. Distance and direction are
displayed
Page 21Instruction Manual MIT-SCAN-T3 Version 02/2021
2.6.3 Menu “Settings”
Under this menu item, device specific settings can be made
(s. adjacent Fig. 20):
“Language” German| English
“Unit” mm | cm | in, mi | in, ft
Fig. 20 Menu - Settings
“Bluetooth” (if available) On | Off
“GPS” On | On, no warnings| Off
“Vibration” On | Off
Please note:
If GPS is enabled, measuring “Date, Time” manual input of date and time
site specific GPS data will be
stored. A warning is displayed 3 Performing a measurement
if there is no GPS signal. This
warning can be turned off in 3.1 Before the measurement
the settings menu.
It is recommended to check the mechanical condition and function of
the device before the first measurement of the day. The device should
be visually inspected for external damages. If damage has been
discovered and it is uncertain if this affects the measurement, it is
recommended to contact the manufacturer.
The wheel diameters are specified in the calibration certificates. The
wheel diameter can wear because of abrasion and may affect the
Page 22Instruction Manual MIT-SCAN-T3 Version 02/2021
accuracy of measurements. The wheels should have the wheel
diameter specified in the test report.
In addition, regular maintenance is recommended.
MIT-SCAN-T3 is ready for use as soon as it is switched on. The user
should check the prober function of the electronic by performing some
test:
- In search mode (s. sec. 3.3.1), there must be four bars
indicating a change when transitioned over a metallic object.
- Perform a function test with the MIT wheeled spacer (accessory
part) as described in sec. 3.4.
Page 23Instruction Manual MIT-SCAN-T3 Version 02/2021
3.2 Measuring sites set up on MIT-SCAN-T3
Projects can be preset at PC with MIT Project Software (s. sec. 5.4,
p. 47). Alternatively, the projects can be set up directly on device on
site. For this, the item “Manual input” has to be selected from the
submenu “Definition of Measuring site”.
After activating the item “Project Data” in menu “Current Measuring
Site”, information about the current project can be entered by
confirming the key (s. Fig. 21). In this context, all project relevant
parameters regarding the construction work can be entered (s. Fig. 22
below):
Fig. 21 “Manual input” “Project”
Name of road or construction work (maximum five characters)
“Start Pos.” (Start position)
Data about starting point of the measurement
“Distance”
Distance between measuring sites (installed reflectors)
“Layer”
Information about layer structure (2- or 3-layer measurement)
Fig. 22 Construction project “Reflector”
data
Preselection of installed reflectors
Page 24Instruction Manual MIT-SCAN-T3 Version 02/2021
Enter data in each row by pressing the key. Press the key Changing values:
again to confirm the data input in the activated row. 1. Select parameters with
Entering information about measuring sites makes it easier to or and confirm with
identify measuring sites during evaluation with MIT Project
Software. After the input is completed, press the key for 2. Change cursor position
about 3 seconds to go back to the measurement menu. with or
As long as a measurement has not yet been performed, layer 3. Change values with
and reflector data can be changed or corrected at any time. or
4. Accept selection with
3.2.1 Layer system
MIT-SCAN-T3 is able to measure 2 and 3-layer systems.
Switching between layered systems is done by pressing and
subsequent selection with and
• 2-layer system: S, SB, B
• 3-layer system: S, SM, SMB, M, MB, B
A schematic representation of the selected layer (S = Surface,
Fig. 23 Selection of layer to
M = Medium, B = Base) is shown in the right area of the screen (s. be measured
Fig. 23).
Page 25Instruction Manual MIT-SCAN-T3 Version 02/2021
3.2.2 Select reflectors
The correct selection of the reflector used is important because it
influences the calculation of the result. A list of the calibrated reflectors
is available to the user.
Since each separate construction project has its specific reflectors
Fig. 24 Select reflectors
installed, the relevant reflector types can be selected or deselected
(example s. Fig. 24):
Automatic circular plate
recognition: Switch to row “Reflector”
1. Select reflector “Autom. Open reflector list with the key
Refl.” Navigate to specific reflector using the and keys
2. Search reflector and Select or deselect reflector with key
measure Switch to the measurement menu with
3. Automatic recognition of
In measurement menu, the reflector to be measured is then quickly
MIT circular plates:
AL RO 07 selected using the keys and .
AL RO 12
AL RO 30
3.2.3 Automatic circular plate recognition
ST RO 12 The measuring device is offering an automatic circular plate
ST RO 30 recognition function. If “Autom. Refl.” is activated, an extended
4. Calculation of layer analysis of the measurement signal will be performed at the end of the
thickness
Page 26Instruction Manual MIT-SCAN-T3 Version 02/2021
measurement. By means of the signal characteristics, the reflector is
determined and the layer thickness calculated.
In the results´ representation, the identified reflector is displayed in
addition to layer thickness. The user is recommended to conduct a
plausibility check of both: the identified reflector as well as the
relatedly displayed layer thickness.
The automatic circular plate recognition can identify the following
reflectors (details in Table 1, p. 9):
AL RO 07 ST RO 12
AL RO 12 ST RO 30
AL RO 30
Page 27Instruction Manual MIT-SCAN-T3 Version 02/2021
Measuring procedure 3.3 Measuring procedure
1. Select measuring site
2. Set reflector type The measurement can be performed once all necessary settings have
3. Search reflector been made.
4. Place probe centered
30 cm in front of reflector 3.3.1 Reflector search
5. Start measurement To start the search mode, press and hold down the search button
6. Slowly run probe over
(compare Fig. 9 MIT-SCAN-T3 design, (7), p. 14). The signals of the
the reflector
four sensors are pictured in display as four separate bars (s. Fig. 25 on
7. Process measurement
next page).
result (optionally perform
reflector test) The higher the bar, the stronger the received signal. The bar amplitude
depends on the size of the reflector and its distance from the probe.
Hints regarding Reflector searching procedure:
reflector search Sweep probe over road surface in wide side-to-side motions
Sweep probe above the Observe the four search bars
road surface in wide side- When bar amplitudes or a vibration indicate detection, perform
to-side motions shorter sweeping motions for more exact localization
Observe search bars
Determine reflector center and put down the probe
Use horizontal search bar
in the footer to determine
reflector center
Page 28Instruction Manual MIT-SCAN-T3 Version 02/2021
The narrow, horizontal bar below the diagram supports operator to
exactly determine the center of the reflector. The search bar
(illustrated in the adjacent graphic) clearly shows in which direction,
based on the center of the display, the probe needs to be moved to
locate the reflector center.
Fig. 26 on following page shows a graphic of the display with search Fig. 25 Reflector search
bar and position of the probe for reflector type AL RO 12.
Subsequently start the measurement:
Please note:
With search button pressed down, run measuring device back
Measurement starts
30 cm; the measurement will start automatically, or
automatically
Release search button
Place the probe at the starting point of the measurement path Put down the probe above
center of reflector
which is about 30 cm in front of the located reflector.
With search button
The option “ Measure” is displayed. Press the key to start
pressed down, run probe
measuring. back about 30 cm
Page 29Instruction Manual MIT-SCAN-T3 Version 02/2021
Fig. 26 Reflector search demonstrated for reflector type AL RO 12
Page 30Instruction Manual MIT-SCAN-T3 Version 02/2021
3.3.2 Measurement
Starting a measurement, a graphic of the path is shown on the right
hand side of the screen (s. Fig. 27). It is necessary to pass roughly
over the reflector center, always starting along the short side in case of
rectangular formats. All three wheels of device have to be in contact
with the surface. Fig. 27 Measurement
During run, please be aware of:
Pace Notes:
Jumps in measurement
The measurement pace must be slow, otherwise measurement
curve (s. Fig. 27)
data will be lost. If the device traverses a measuring site too
representing the signal
quickly, one of the following warnings will appear on the amplifications of the
display: device. The amplification is
"Move slower!" – Evaluation was still possible. Yet, a slower thereby adjusted to the
pace is recommended. measurement signal.
"Movement too fast!" – Calculation of layer thickness failed. Signals displayed during
Repeat measurement run. the reference run indicate
Curve maximum metallic objects in the
Maximum of the traversal curve has to be in the first half of the surrounding environment.
These can negatively
display (marked as dotted line)
impact measurements.
Page 31Instruction Manual MIT-SCAN-T3 Version 02/2021
Reference measurement
The last part of the measurement run gives the reference signal
of the environment. This signal is subtracted from the curve. In
this manner, materials with a homogenous distributed metallic
content can also be measured (e.g. blast furnace slag). Signal
peaks in the reference signal indicates additional metal in the
ground which may cause wrong results
The measurement path depends on selected reflector:
≈ 1 m for small reflectors AL RO 07, AL RO 12, ST RO 12 and
AL QU 16.5
≈ 1.5 m for larger reflectors AL RO 30, ST RO 30, AL RE 30x50,
AL RE 30x60, AL RE 30x70, AL RE 30x100, AL QU 33 and
automatic circular plate recognition
Measurement stops immediately when the complete traversed distance
of the path has been covered.
The measurement is aborted, when the probe is moved backwards.
Page 32Instruction Manual MIT-SCAN-T3 Version 02/2021
3.3.3 Results display
After completing the measurement run, the traverse path curve
appears on display. In this graph the curve is scaled based on the
display and the adaption of the amplification. The curve should show
no irregularities. Irregularities are an indicator of disturbances during
measurement (s. Fig. 28). Fig. 28 Measurement curve
The result is subsequently displayed (s. Fig. 29). The following
information is shown in display:
Measured layer thickness
Selected or automatically identified reflector
Material quality coefficient
Fig. 29 Display of
If GPS data have been received on site, this is shown at the right results with GPS icon
corner of display (s. highlighted area in Fig. 29).
3.3.4 Calculated layer thickness
The calculated layer thickness is displayed in the selected unit. The
measured value equals the distance between reflector bottom and the
contact surface of the probe.
Page 33Instruction Manual MIT-SCAN-T3 Version 02/2021
Layer thickness too low
The measuring range depends on the selected reflector. If the
calculation gives a layer thickness less than the lower measuring range
of the reflector, this is displayed (s. Fig. 30). In this case, the setting
and the measurement should be considered critically:
Fig. 30 Display of too low - Reflector set correctly?
layer thickness result
- Can measured value be expected within the measuring range of
reflector?
Please note: If the measuring range has not been reached, a layer
thickness can still be determined by use of the MIT wheeled spacer.
The wheeled spacer increases the distance to the reflector, so that a
valid measurement result can be calculated.
Page 34Instruction Manual MIT-SCAN-T3 Version 02/2021
3.3.5 Measured reflector
On the left hand side of the screen, the selected reflector chosen for
the measurement is displayed. If automatic circular plate recognition
was activated, the reflector which has been identified will be displayed.
This mode will be indicated by an “(A)” next to the name of reflector.
3.3.6 Material quality coefficient
On the right side of display a graphic diagram of material quality
coefficient is shown (s. adjacent Fig. 31).
This provides some useful information for assessing the intactness of
the measuring site, i.e. of the quality of the reflector. The coefficient Fig. 31 Display of results
has to be within the range of −1.0 to +1.0 to secure a reliable result.
Page 35Instruction Manual MIT-SCAN-T3 Version 02/2021
Evaluation of If the quality coefficient should be outside of the recommended valid
measuring site via range, the measurement result is questionable:
material coefficient:
Reflector selection Was the input of the reflector type correct? If not, the result
correct? will be wrong.
Reflector of verified Has reflector possibly been damaged or destroyed?
quality used? Foils may be damaged or destroyed during placement by the
Reflector damaged? construction machines. Depending on the extent of damage,
Only robust reflectors of the reason for measurement failures could be foils with bent
verified quality ensure
ends, torn foils or perforated foils. Therefore, whenever
reliable measurement
possible, always use robust reflectors for electromagnetic
results.
thickness measurements!
Is the installed reflector certified for use with MIT-SCAN-T3? If
not, the signal may not match with MIT-SCAN-T3 calibration
files.
In this case, the result of the calculated layer thickness cannot
be guaranteed.
Page 36Instruction Manual MIT-SCAN-T3 Version 02/2021
3.3.7 Reflector test
Reflector test
After a reflector foil is measured (AL QU 16.5, AL QU 33, AL RE 30x50, 1. Change measurement
AL RE 30x60, AL RE 30x70 and AL RE 30x100), the results menu direction by 90 degrees
optionally offers the “Reflector test” (s. Fig. 31, p. 35). The reflector 2. Press search button to
test helps to: find edge of reflector
3. Start measurement and
Determine reflector foil/plate size move probe slowly over
Assess the condition of the reflector the reflector
To perform a reflector test, a second run over reflector is necessary:
This run must be conducted along the long side of reflector (change
measurement direction by 90 degrees). Press search button to
determine reflector position. Once the edge of the foil/plate is
determined, measurement can be started and the probe has to be
moved slowly over reflector.
Directly after completing the measurement the following parameters
are displayed (s. Fig. 32):
“Coefficient” (material quality): Repeated calculation of material
quality (s. sec. 3.3.6, p. 35) from the data of a run along the
long and short side of the reflector
“Calc. size” (calculated size):
Calculated width and length of the reflector Fig. 32 Reflector test result
Page 37Instruction Manual MIT-SCAN-T3 Version 02/2021
“Sel. Reflector” (selected reflector):
Display of set up reflector
“Rating”: The calculated reflector format provides a check of the
conformity between measured reflector and set antipole.
“Condition”: With the calculated coefficient, it is possible to
assess whether a reflector is damaged (but still measurable) or
destroyed (not measurable).
Fig. 33 MIT wheeled spacer
3.4 Functionality check acc. to TP D-StB 12
Functionality check: “Before starting the day’s first measurement, the thickness measuring
1. Perform measurement device’s functionality must be tested.” 5
2. Fit MIT wheeled spacer to
device The German standard TP D-StB 12 requires that the first measurement
3. Remeasure measuring site has to be a check of the correct device function. For this, with the
4. Subtract the defined device traverse the measuring site and perform a measurement. Use
amount of 35 mm from the MIT wheeled spacer (s. Fig. 33) and fix it to the probe. Repeat the
second measurement measurement with a mobile spacer. The MIT wheeled spacer increases
result the distance between probe and road surface by 35 mm.
5. First and second
measurement end values
should not differ by more
than 1 mm.
5 Source: TP D-StB 12, sec. 2.2.6
Page 38Instruction Manual MIT-SCAN-T3 Version 02/2021
The functionality test according to TP D-StB 12 is considered as passed
Hint:
if the difference between layer thickness measurement result without
Perform the functionality test
wheeled spacer and the result of the measurement with spacer, on thinner layers to decrease
subtracted by the spacer distance of 35 mm, is not more than the the influence of measurement
specified accuracy of the device plus 1 mm.6 tolerance.
It is important to note that the device itself has a measurement
tolerance of ± (0.5 % of the measured value + 1 mm).
If the device does not pass the functionality check, it must be sent to
the manufacturer for validation.
4 Warnings and error messages
Fig. 34 Example for single
MIT-SCAN-T3 is equipped with a comprehensive error detection warning
function. During measurement, the measurement signal is checked for
possible deficiencies and influences. If an error will be detected, this is
displayed subsequently to the measurement (s. example in adjacent
Fig. 34 and Fig. 35).
The following error messages may occur (Overview table on the next
pages):
Fig. 35 Several warnings
6 Source: TP D-StB 12, sec. 2.2.6 Measurement
Page 39Instruction Manual MIT-SCAN-T3 Version 02/2021
Error message What to do?
Low battery! Reload the battery promptly
Empty battery! Measurements cannot be performed. Reload or
exchange battery.
No GPS signal! Continue measurement and save data without GPS
signal.
Alternatively wait until device will receive a GPS signal.
Data memory full! Measurements cannot be saved.
Move slower! Evaluation was still possible. However, a slower pace is
recommended.
Movement too fast. Calculation of layer thickness failed. Repeat
measurement run.
No reflector found! Analysis of measurement signal was not able to find a
reflector. Repeat search and measurement of reflector.
Page 40Instruction Manual MIT-SCAN-T3 Version 02/2021
Error message What to do?
Max. position Repeat measurement at measuring site. Place probe
wrong about 30 cm before the reflector.
Measurement Movement of probe must be forward..
aborted
Electromagnetic Measurement signal was influenced by electromagnetic
interfer. interferences, e.g. by:
- High-voltage lines
- Underground cables
- Transformers, generators or other construction
machinery
Zero meas. invalid Reference signal was influenced by extraneous metal.
If possible remove extraneous metal. Alternatively,
pass over reflector in other direction.
Incorrect This error message appears if the course of the
measurement measurement signal indicates that a rectangular foil
was not passed over along its long side. Repeat run
over rectangular foil along the long side.
Page 41Instruction Manual MIT-SCAN-T3 Version 02/2021
Error message What to do?
Side shift of The error message appears when user has passed the
reflector reflector too close to the edge. The reflector should be
re-searched and passed over its center.
Table 3 Overview of warnings and error messages
Page 42Instruction Manual MIT-SCAN-T3 Version 02/2021
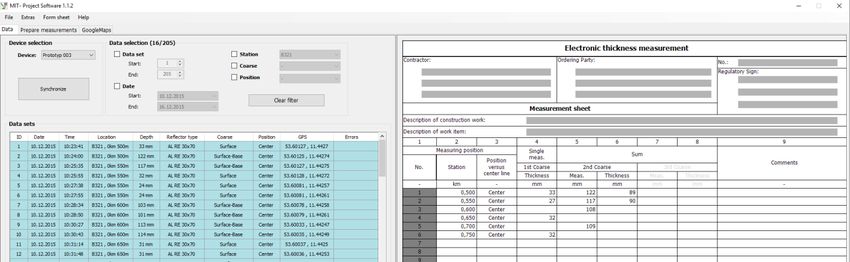
5 MIT Project Software Please note:
The MIT Project Software offers the following functions: When using a new USB flash
drive, first connect it to the
Set up of construction site data by using the measuring site
MIT-SCAN-T3 and then
plan (= predetermined grid points of measurement for a
synchronize with the PC.
construction project)
Display and storage of measured data
Evaluation of measured data and generation of form sheets
acc. to TP D-StB 12
Fig. 36 MIT project software - Program screen shot
Page 43Instruction Manual MIT-SCAN-T3 Version 02/2021
With the MIT Project Software, new projects can also be set up prior
operation at the construction site.
Data synchronization between measuring device and MIT Project
Software is performed by at first connecting the USB flash drive to
device, subsequently to the PC and then again to the measuring
device.
5.1 License key and copy protection
The MIT Project Software is protected by a license key. It is operating
device-dependently. Only measurement data of corresponding device
can be processed. The synchronization of measured data using the
MIT Project Software is activated with the license key included in the
delivery. It can be found in inlay of the installation medium. In order to
evaluate data from other MIT-SCAN-T3 devices, the corresponding
license key for the respective device has to be entered. The software
can be installed on various computers.
Page 44Instruction Manual MIT-SCAN-T3 Version 02/2021
5.2 Program settings
In menu item “Extras”, different settings can be made (s. Fig. 37):
“Language”
German or English
“Units”
international (mm/cm for depth, m for step size) or Anglo-
American (inch for depth, foot/mile for step size) and the unit
for result display (form sheet).
“Multiple measurements”
It is possible to average the results from several measurements
at the same measuring site or alternatively use the last result in
the form sheet.
“Plausibility of measurements”
The program checks whether the measured value is within the Fig. 37 Program settings
measurement range of a respective reflector.
“Form sheet preview”
With the selection of a data set, a simultaneous calculation of
values is performed in the form sheet.
Page 45Instruction Manual MIT-SCAN-T3 Version 02/2021
5.3 Selection of devices
The MIT Project Software can be used to read-out the measured data
from USB flash drive. If a USB flash drive with data files (*.T3) is
connected while the program is running, the program shows a
message.
Fig. 38 File query for MIT-SCAN-T3 data
The MIT-SCAN-T3 data can be linked to each respective device by
assignment of a name or number. This is helpful when several devices
are in use and another designation than the internal device number is
preferred. It is possible to activate and load several files. The
respective file is selected in the menu “device” (s. Fig. 39).
Fig. 39 Program screen shot
device selection
Page 46Instruction Manual MIT-SCAN-T3 Version 02/2021
5.4 Set up of measuring sites at the PC
Measuring sites can conveniently be prepared at the PC. The interface
is in the second tab “Prepare measurements” (s. Fig. 41).
Fig. 41 Measurements set up with the MIT project software
If measurements for several layer thickness measuring devices are Fig. 40 Device specific
processed, the relevant device has to selected (s. highlighted area in measuring site set up
Fig. 40). The list of target devices contains all by license key registered
devices.
Page 47Instruction Manual MIT-SCAN-T3 Version 02/2021
The following construction project information is required:
Hint:
If large changes to a Construction ex.: A14
measurement plan are Start ex.: 3 km 500 m
required, it is recommended Distance ex.: 50 m
to set up a new plan with the End ex.: 5 km 550 m
necessary corrections! Pos. of measuring sites left, middle, right
Select layer and corresponding reflector
After data input, the measuring site plan is generated automatically
under “Generate measurement plan” s. Fig. 42). Individual data sets
can be processed or deleted there.
Fig. 42 Generated measuring site plan with USB flash drive data
Page 48Instruction Manual MIT-SCAN-T3 Version 02/2021
Once the measuring site plan has been generated, the data can be
“Transferred to the USB stick”. The set up measuring sites are shown
in the table (s. Fig. 42, p. 48) and are saved as a file on USB flash
drive and the storage place will be changed from “PC” to “USB” in the
table. After connecting the flash drive to the thickness measuring
device, the prepared data sets will synchronized. It is possible to sort
the data in the table according to the position. This can be done in
ascending or descending order. As a result, measuring stations that are
subsequently added can be sorted into the desired grid easily.
Fig. 43 Transfer the generated measuring point plan to a USB flash drive
Page 49Instruction Manual MIT-SCAN-T3 Version 02/2021
5.5 Selection of measured values
Data transferred from device can be selected in tab “Data”.
It is possible to filter the measurement data using the filter function
(s. Fig. 44). Several criteria can be queried at the same time.
Fig. 44 Selection of measured data set by filter
Data sets can also be selected in the table:
To select all data sets:
Left-click with the mouse in the table, then use key combination
“Ctrl + a”
To select related data sets:
Click on first data set, then hold shift key pressed and click on
last marked data set
Page 50Instruction Manual MIT-SCAN-T3 Version 02/2021
To select isolated data sets:
Hold Ctrl key pressed and select single rows
To select single data set:
Left click with the mouse on the desired data set
Error message during measurement
Error messages which were displayed during the measurement are
displayed in the table (s. Fig. 36, p. 43) in “Error” column by their
abbreviation. By moving the mouse over the respective cell, all error
messages are displayed completely.
5.6 Correct and delete data
Information about location, layer type and position can be corrected
afterwards. Right-click on the relevant cell and input correct data
(s. Fig. 45).
To delete single data sets first mark the relevant row and press the
“Del” key.
Fig. 45 Correction of data
Page 51Instruction Manual MIT-SCAN-T3 Version 02/2021
5.7 Synchronize and save data
From time to time, data sets on the USB flash drive and the measuring
device have to be synchronized. For this there are two options:
“Synchronization” button:
Press this button to synchronize data with the active file on USB flash
drive. In Fig. 46 a synchronization of data sets e.g. with device
“Prototype 003” is shown.
Fig. 46 Synchronize data Menu Tools - “Synchronize USB flash drive”:
Select device whose data has to be synchronized with USB flash drive.
Please note: All data sets of the table can be stored on PC. The following file
The form sheet cannot be formats are available:
reloaded later with the
program. It is therefore MIT format:
recommended to save the In this format the data is encrypted before saving and can be loaded
used data sets in MIT format into the software at any time via “Import”.
(*.mit).
Excel format:
By pressing button “Export selected data sets” (s. Fig. 47), the data
sets are saved as XLSX file.
Fig. 47 Data storage
Page 52Instruction Manual MIT-SCAN-T3 Version 02/2021
5.8 Form sheet
MIT Project Software transfers measurement data from a construction
site to a measurement sheet report analogous TP D-StB 12. Therefore,
the relevant measurement data has to be selected (s. sec. 5.5, from
p. 50).
5.8.1 Form sheet settings
The menu item “Form sheet” contains several settings of the form
sheet (s. Fig. 48):
“Update”: Calculations in form sheet are updated (only
possible, if result preview is deactivated). Fig. 48 Form sheet settings
“Zoom”: The width of the form sheet can be changed from
50 % to 200 %.
“Show/hide company logo”: A company logo can be inserted at
top right of the form sheet. The inserted logo can be hidden at
any time.
“Save”: The form sheet can be saved as a pdf or excel file. The
saved file will be opened automatically.
Page 53Instruction Manual MIT-SCAN-T3 Version 02/2021
5.8.2 Data transfer for site measuring
Please note:
To be able to generate a form Simultaneously with the selection of measurement data, if the preview
sheet, the following data setting is activated, data are taken over into the form sheet and
must be entered for each individual layer thicknesses calculated (s. Fig. 37, p. 45). If the results
measuring site: preview is deactivated, the update is performed under the menu item
Location
“Form sheet” - “Update” (s. Fig. 48, p. 53).
Layer type To take over data into the form sheet, the following information is
Position of reflector to axis mandatory:
Kilometer indication
Type of layer (surface, binder or aggregate)
Position of reflector to axis (left, center or right)
These settings can be made with the MIT-SCAN-T3 or at the PC using
the prepared measuring site plan.
Page 54Instruction Manual MIT-SCAN-T3 Version 02/2021
5.8.3 Calculations in the measurement sheet
The form sheet shows the measured layer thickness for each layer in
separate columns (s. Fig. 36, p. 43). If layer thickness determination of
several layers is performed at the same measurement point, the
program automatically calculates individual layer thicknesses for the
following layer systems (s. Fig. 49):
Two-layer construction
Three-layer construction
MIT Project Software averages the measured values if several results
are available with same course setting and location. This presetting can
be made in menu item “Extras” (s. sec. 5.2, p. 45).
By clicking a measurement value or calculated layer thickness, the
values in the form sheet used for calculation are marked green in the
tab.
Fig. 49 Calculation of layer
construction
Page 55Instruction Manual MIT-SCAN-T3 Version 02/2021
5.8.4 Setting up a form sheet
The upper part of the form sheet is utilized to provide information
about the customer, contractor and description of the performed
construction work.
In the footer (s. Fig. 50) the operator has to enter the result of the
functionality test according to TP D-StB 12 (s. sec. 3.4, from p. 38). If
not confirmed or even negated, the functionality test is considered to
be failed. To complete the form sheet, additional information can be
added in the footer regarding the used device and measured antipoles.
Fig. 50 Footer of form sheet
Page 56Instruction Manual MIT-SCAN-T3 Version 02/2021
5.9 GPS data and Google maps
In the third tab of MIT Project Software, the highlighted measurement
data is displayed as markers in Google Maps (s. Fig. 51).
Fig. 51 Measurement data display in the tab Google Maps
Page 57Instruction Manual MIT-SCAN-T3 Version 02/2021
The display of single measurements can be selected and deselected by
the marker in the legend above the map.
Several measurement points are shown in the map if they are marked
by the filter or selected manually. The graphic display of measurement
points facilitates reliable allocation of measurement values to a certain
measuring site. It may also reveal incorrect measuring site information.
If the mouse cursor is positioned above a marker in the map, the data
measured at this point is displayed. The map can be moved using the
mouse cursor. For this, position the mouse cursor on the map and then
with the right mouse key pressed, move it in the desired direction.
Page 58Instruction Manual MIT-SCAN-T3 Version 02/2021
6 MIT-SCAN-T3 App Note:
With the help of the MIT-SCAN-T3 app measurement progress, results The following authorizations
and measurement plans can be exchanged between the device and are required to use the app:
mobile phone. The app can be downloaded from Google Play or the • Access to the GPS
Apple Store. When the program is started for the first time, permission • Access to the memory
to access the location recognition must be granted in order to be able
to save and receive the GPS data from the measuring points as well as
the authorization to access files to create the log.
The status line at the top of the screen shows the connection to a
device by means of a green Bluetooth symbol (see Fig. 53). If this
symbol is red and crossed out, there is no connection to a MIT-SCAN-
T3. A white icon indicates that the phone is searching for nearby
devices.
The symbol shows if there is a connection to as BIM7 project.
(Green = connection / red = no connection)
Fig. 52 Start Screen
7 Fig. 53 Connection symbols
BIM = Building Information Modelling (Method of networked planning,
execution and management of buildings and other structures using software)
Page 59Instruction Manual MIT-SCAN-T3 Version 02/2021
6.1 Start Screen
After starting, the app automatically searches for a layer thickness
measuring device nearby. To do this, Bluetooth must be activated on
the phone. The corresponding device is selected and connected. The
connection request is then confirmed on the MIT-SCAN-T3. The device
data is downloaded to the phone. The user receives information on the
serial number, the date of the last calibration, the battery level and the
firmware version of the device (see Fig. 52, previous page).
Fig. 54 Prepared measuring 6.2 Prepared measuring points
points
In this tab, prepared measuring points are called up and displayed.
Data can be edited, added or deleted. Changes can be transferred to
the MIT-SCAN-T3.
To edit an individual measuring point, the point is select and an editing
dialog opens by using the pencil symbol (see Fig. 54).
A new measurement project can be created with the “+” sign. The
name of the structure, the step size and the start and end of the
measuring points are specified in the corresponding dialog (see Fig.
Fig. 55 Create new
55). In addition, a layout diagram can be created and a reflector type
measuring points can be specified for each layer to be measured.
Page 60Instruction Manual MIT-SCAN-T3 Version 02/2021
This data can then be sent to the MIT-SCAN-T3. The transferred data
can be found in the measuring device in the menu item Measure -
Prepared measuring points.
6.3 Measurement
The app automatically recognizes the start of the measurement with
the MIT-SCAN-T3, all data is transferred to the phone. The user
receives an overview of the measurement information and all relevant
data that is displayed at the end of the measurement (the reflector
type recognized or set before the measurement, the measured layer,
the measured layer thickness and the value of the material quality).
Fig. 56 Measuring result
The material quality can be used to assess the quality of the measuring
point and is ideally between -1 and 1. A checkbox at the top right
indicates whether GPS data is available for the measuring point.
With a click on the measurement curve data can be displayed and
shows any error messages that may be present for the
measurement.
A table with the last ten measurements is displayed in the lower part of
the screen.
Page 61You can also read


