Coastal Hazards System (CHS) Web Tool User Guide, v2.0
←
→
Page content transcription
If your browser does not render page correctly, please read the page content below
Coastal Hazards System (CHS)
                    Web Tool User Guide, v2.0
                                          November 16, 2021
Contacts: CoastalHazardsGroup@erdc.dren.mil
Norberto C. Nadal-Caraballo, Meredith L. Carr, Debbie Green, Madison C. Yawn
US Army Engineer Research and Development Center
3909 Halls Ferry Rd, Vicksburg, MS 39180

November 16, 2021                                                              Page 1 of 54
Table of Contents
1 About the Coastal Hazard System ......................................................................................................................... 5
    1.1       The Web-Tool ......................................................................................................................................... 5
    1.2       Getting Started ...................................................................................................................................... 6
    1.3       Save Points ............................................................................................................................................ 8
    1.4       Web Tool Navigation............................................................................................................................... 8
    1.5       Basic Map Navigation ..........................................................................................................................10
    1.6       The Navigation Pane.............................................................................................................................11
    1.7       Save Point Navigation ..........................................................................................................................13
    1.8       Storm Track Navigation ........................................................................................................................17
    1.9       Spatial Query Tools ..............................................................................................................................17
    1.10          Spatial Save Point Selection ............................................................................................................19
2      Downloading Model and Statistics Results ....................................................................................................22
    2.1       Save Point Filtering ..............................................................................................................................22
    2.2       Selecting and Downloading Files ..........................................................................................................27
3      Viewing Statistics Data .................................................................................................................................30
    3.1       Storm Track Data .................................................................................................................................30
    3.2       CHS Web Tool File Formats ...................................................................................................................30
4      Appendix A: Coastal Hazards System File Formats .........................................................................................31
    4.1       Model Results ......................................................................................................................................31
       4.1.1          HDF5 Model ................................................................................................................................31
       4.1.2          CSV Format .................................................................................................................................39
    4.2       Storm Parameters ................................................................................................................................41
       4.2.1          CSV Format .................................................................................................................................41
    4.3       Statistics HDF5 Data Model .................................................................................................................42
       4.3.1          Annual Exceedance Probability (AEP) Data Files/ per save point....................................................42
       4.3.2          Annual Exceedance Frequency (AEF) Data Files/ per save point.....................................................43
       4.3.3          Storm Recurrence Rate (SRR) Data Files .......................................................................................45
       4.3.4          Probability Mass Data Files ..........................................................................................................47
       4.3.5          Nonlinear Residual (NLR) Data Files .............................................................................................48
5      Appendix B: Coastal Hazards System Filename Convention ...........................................................................50
    5.1       Filename Format ..................................................................................................................................50
    5.2       Identifier Descriptions ..........................................................................................................................50
       5.2.1          Identifier1 = Project || Region || Sub region ..............................................................................50
       5.2.2          Identifier2 = Storm Type || Data Type ..........................................................................................50

November 16, 2021                                                                                                                                   Page 2 of 54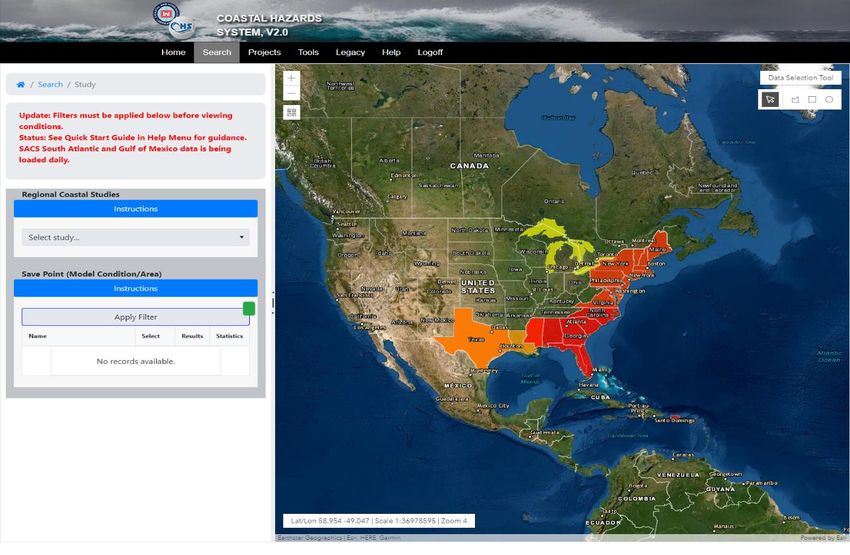
5.2.3          Identifier3 = Simulation ...............................................................................................................51
       5.2.4          Identifier4 = Post-processing .......................................................................................................51
       5.2.5          Identifier5 = Save Point || Station || Statistics || Storm ............................................................52
       5.2.6          Identifier6 = Model ......................................................................................................................52
       5.2.7          Identifier7 = Result Type || Input Type .........................................................................................53
       5.2.8          Extension.....................................................................................................................................54

Figures and Tables
Figures
Figure 1: Coastal Hazards System (CHS v2.0) Landing Page ..................................................................................... 6
Figure 2: Representation of Future CHS Portal Registration Page.............................................................................. 8
Figure 3: CHS v1.1 Web Tool Main Page (retired)...................................................................................................... 9
Figure 4: New CHS Web Tool Main Page with main user interface areas indicated ..................................................... 9
Figure 5: Map Interface Tools ................................................................................................................................10
Figure 6: Processing Icon ......................................................................................................................................10
Figure 7: Example Map Backgrounds .....................................................................................................................11
Figure 8: (a) Study Selection; (b) Save Point Model Condition / Area Table; (c) Apply Filters to Map. ........................12
Figure 9: Puerto Rico and U.S. Virgin Islands SACS Sub-Region at Zoom 6 (Scale ~ 1m : 10,000 km) .....................14
Figure 10: Puerto Rico and U.S. Virgin Islands SACS Sub-Region: Left at Zoom 7 (Scale ~ 1m : 5,000 km); Right at
Zoom Level 9 (Scale ~ 1m : 1,000 km) ..................................................................................................................14
Figure 11: Puerto Rico and U.S. Virgin Islands SACS Sub-Region at Zoom 11 (Scale ~ 1m : 300 km) ......................15
Figure 12: Hover Text for a save point.....................................................................................................................16
Figure 13: On Click Pop-up Window General Information........................................................................................16
Figure 14: On Click Pop-up Window Models and Statistics Results Tabs .................................................................17
Figure 15: Tabs for parameters that are stored for different models and statistics results for several conditions .......17
Figure 16: Using the Double Square Box Tool to show Pop-up Window on Map edge and taller ................................18
Figure 17: Selecting the Zoom to tool for the point circled in cyan...........................................................................19
Figure 18: Selecting save point locations with polygon tool ....................................................................................20
Figure 19: Selecting save point locations with rectangle tool ..................................................................................21
Figure 20: Selecting save point locations with circle tool ........................................................................................21
Figure 21: Save Points Selection tab showing instruction button and a row of save points .......................................22
Figure 22: Save Point Selection Window: Selecting individual save points ..............................................................23
Figure 23: Selecting all save points .......................................................................................................................23
Figure 24: Adjusting Column Width .......................................................................................................................24
Figure 25: Sorting Latitude Column with blue down arrow ......................................................................................24
Figure 26: Group by Column Example ....................................................................................................................25
Figure 27: Save Point Selection Window showing filter tools ...................................................................................25
Figure 28: Removing a Column ..............................................................................................................................26
Figure 29: Filter by text using Contains ..................................................................................................................26
Figure 30: Selecting all save points in a filtered group ............................................................................................27

November 16, 2021                                                                                                                                 Page 3 of 54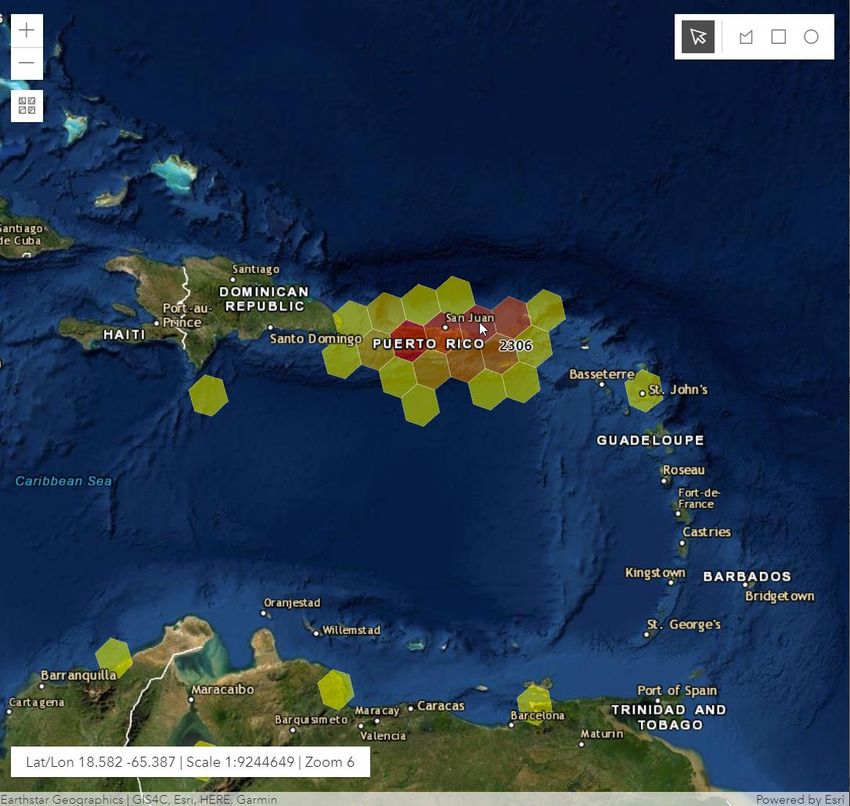
Figure 31: Download Files Window ........................................................................................................................28
Figure 32: File selection by two unique values ........................................................................................................28
Figure 33: File selection by two columns - Condition set to Base Conditions and Attribute set to Timeseries ............29
Figure 34: Download Alert and Zip File...................................................................................................................29
Figure 35: Example NACCS Peaks File Using the CHS Peak File Format V1 ..............................................................37
Figure 36: Example SACS Peaks File Using the CHS Peak File Format V2 ................................................................37

Tables
Table 1: Timeseries – Groups and Potential Attributes............................................................................................31
Table 2: Timeseries – Potential Datasets and Attributes .........................................................................................32
Table 3: Peaks – NACCS Original H5 Format Groups, Datasets and Attributes .........................................................35
Table 4: ADCIRC Peaks – CHS File Format V2 ........................................................................................................38
Table 5: STWAVE Peaks – CHS File Format V2 ........................................................................................................39
Table 6: CSV Format - Timeseries ..........................................................................................................................40
Table 7: CSV Format - Peaks..................................................................................................................................40
Table 8: Storm Parameters csv File Header Rows ...................................................................................................41
Table 9: Annual Exceedance Probability (AEP) HDF5 format ...................................................................................42
Table 10: Annual Exceedance Probability (AEP) CSV format....................................................................................43
Table 11: Annual Exceedance Frequency (AEF) HDF5 format ..................................................................................43
Table 12: Annual Exceedance Frequency (AEF) CSV format .....................................................................................44
Table 13: NACCS Storm Recurrence Rate (SRR) HDF5 format .................................................................................45
Table 14: NACCS Storm Recurrence Rate (SRR) CSV format ...................................................................................46
Table 15: Storm Recurrence Rate (SRR) HDF5 format – CHS File Format V2............................................................46
Table 16: Storm Recurrence Rate (SRR) CSV format – CHS File Format V2 ..............................................................47
Table 17: Probability Mass HDF5 Format ...............................................................................................................47
Table 18: Probability Mass CSV Format .................................................................................................................48
Table 19: Nonlinear Residual (NLR) HDF5 Format ..................................................................................................48
Table 20: Nonlinear Residual (NLR) CSV Format ....................................................................................................49
Table 21: Identifier1 Details ..................................................................................................................................50
Table 22: Identifier3 Details ..................................................................................................................................51
Table 23: Identifier4 Details ..................................................................................................................................51
Table 24: Identifier5 Details ..................................................................................................................................52
Table 25: Identifier6 Details ..................................................................................................................................52
Table 26: Identifier7 Details ..................................................................................................................................53
Table 27: Extension Details ...................................................................................................................................54

November 16, 2021                                                                                                                              Page 4 of 54
1 About the Coastal Hazard System

The Coastal Hazards System (CHS) is a national-scale effort for the quantification of coastal storm
hazards and distribution of Probabilistic Coastal Hazard Analysis (PCHA) results and statistics1. The main
components of the CHS include the PCHA, data repository, web-tool for easy access to results, and
website containing documentation and metadata. The PCHA is an innovative framework integrating the
comprehensive characterization of regional storm climatology, advanced joint probability analysis of
storm forcing and storm responses, high-resolution atmospheric and hydrodynamic numerical modeling,
and cutting-edge machine learning techniques and metamodels.

Data distributed through the CHS includes numerical model output for storm surge, waves, currents,
and wind associated with tropical and extratropical cyclones. Hazard curves developed using the PCHA
are also provided for still water level (SWL; storm surge + astronomical tide), significant wave height,
and peak wave period. These hazard curves represent the magnitude of the hazards as a function of
their annual exceedance frequency (AEF) along with corresponding uncertainties. The CHS provides a
centralized location for PCHA results to support feasibility studies, economics analyses, evaluation of
nature-based features, stochastic engineering designs, and risk and resilience assessments.

1.1 The Web-Tool

The Coastal Hazards System (CHS) Web Tool has been in use with a map interface through several
revisions. In February 2015, a version was stood up as CHS v1.1 on the ERDC RDE network providing
access to data from the NACCS and USACE Texas studies. The CHS web tool went through modifications
in 2016 to allow easy viewing and downloading of statistics results. However, as of September 30, 2021,
CHS v1.1 was taken offline and is no longer available for accessing or downloading of data.

In 2021, CHS v2.0 was stood up with modifications that include a new graphical user interface, revised
data storage architecture to meet future data storage needs, and a web-based data mining and
visualization tool capable of supporting national scale data. The revised data architecture is designed
with scalable data storage options as future studies provide more data, to improve the relational
storage of files and content and to incorporate indexed SQL queries. The Graphical User
Interface/Mapping (C# & .Net, ESRI API) is a more robust ESRI API for industry standard mapping and
tools. A common design and interface scheme with StormSim2 and pre-defined formats for
interoperability provides consistent data integrity and appearance. User access was enhanced to provide
access to desired information via filter-able data and metadata in the database.

The overall framework and Navigation Pane are similar to CHS v1.1 with improved display of

1
  For more information see: Nadal-Caraballo, N.C.; Campbell, M.O.; Gonzalez, V.M.; Torres, M.J.; Melby, J.A., and Taflanidis,
A.A., (2020). Coastal Hazards System: A Probabilistic Coastal Hazard Analysis Framework. Journal of Coastal Research, 95(sp1),
1211-1216. https://doi.org/10.2112/SI95-235.1
2
  For more information see: Torres, M. J., Nadal-Caraballo, N. C., Ramos-Santiago, E., Campbell, M. O., Gonzalez, V. M., Melby, J.
A., & Taflanidis, A. A. (2020). StormSim-CHRPS: Coastal Hazards Rapid Prediction System. Journal of Coastal Research, 95(sp1),
1320–1325. https://doi.org/10.2112/SI95-254.1

November 16, 2021                                                                                                 Page 5 of 54
information and selection of data. Map views, data visualization, selection tool, and some navigation
was updated within the 2021 release. This User Guide illustrates how to maneuver in and obtain data
from the CHS v2.0 website and web tool.
1.2 Getting Started
The CHS landing page is shown below in Figure 1 and can be accessed at https://chs.erdc.dren.mil/.
Figure 1: Coastal Hazards System (CHS v2.0) Landing Page
The CHS landing page contains a Menu Bar and buttons to enter the web tool by Study, Location, or
Storm. These buttons allow entry into the web tool based on the user’s focus as defined below. Apart
from the entry buttons, the landing page includes background information and newsfeeds, which show
updates regarding the database and published documents related to CHS and the PCHA framework.
The Menu Bar on the landing page, and on pages throughout CHS, contains links to several other pages
or information:
Home: returns the user to the landing page, where they can enter the database using the three
main methods (Study, Location, or Storm), and access documents, guides, and other USACE sites
o Study: view comprehensive coastal studies, view point locations where data is stored,
November 16, 2021 Page 6 of 54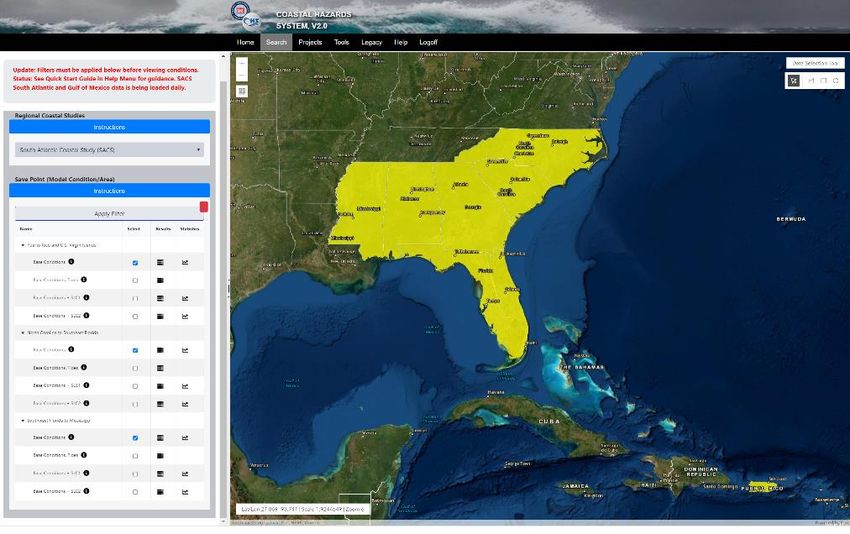
visualize data and hazard curves by clicking a point, filter and download available
modeling and statistics data
o Location: enter a location of interest to view point locations where data is stored,
visualize data and hazard curves by clicking a point, filter and download available
modeling and statistics data
o Storm: view storm tracks and parameters applied in comprehensive coastal studies,
view point locations where data is stored, visualize data and hazard curves by clicking a
point, filter and download available modeling and statistics data
Search: change method for entering the web tool
Projects: Page describing regional comprehensive studies and related projects housed in CHS
Tools: opens a webpage containing tools for downloaded datasets including conversion from
HDF5 to other formats
Legacy: links to the Legacy CHS website hosted at https://chs2.erdc.dren.mil
Help:
o About Us: information about CHS and the Coastal Hazards Group
o Contacts: contact information
o Documents: available reports, briefings, and study-specific files for downloading
o FAQ: frequently asked questions related to CHS
o Quick Start Guide: link to guide which illustrates how to move through the web tool and
access data
o Updates: links newsfeed on the landing page to information related to system and study
updates
o User’s Guide: link to the guide describing the web tool, data formats, and naming
conventions
Login: login and account information for CHS
After pressing an entry button, such as Study, a registration page will be displayed, with a selection
button for guest registration, which allows access without email login. As illustrated in Figure 2,
functionality is currently under development to use a CAC or Email registration to enter the system
(Email registration requires a user selected email and password that will help determine usage of the
web tool). After registration, the user will be brought to the CHS Web Tool. If the tool is left inactive for
an hour, re-registration will be required.
November 16, 2021 Page 7 of 54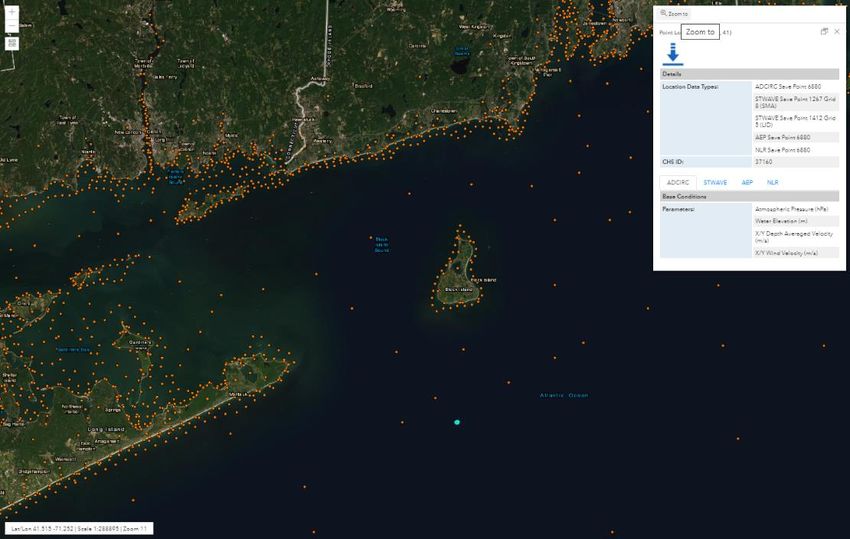
Figure 2: Representation of Future CHS Portal Registration Page

1.3 Save Points

Data in the CHS Web Tool are associated with Save Points, which are located at specified locations
(latitude and longitude). However, each model’s results hosted by CHS may have different numerical IDs
for their native save points, which are referred to in CHS as co-located IDs. CHS tools may refer to co-
located IDs or save points by model (i.e. ADCIRC -2234). More information on the individual models may
be viewed in the Documents and Resources sections in the Menu Bar.

1.4 Web Tool Navigation

Figure 3 shows the CHS v1.1 tool that this version is following, but will be available for some time at the
website listed in the Menu Bar. The CHS v 2.0 version is shown in Figure 4. There are three main sections
to the CHS Web Tool: the Menu Bar along the top edge of the page, the Navigation Pane on the left and
the Map Interface. The Menu Bar is the same as discussed above in the Getting Started Landing Page
section. The Navigation Pane provides data selection options, and the Map allows the user to view,
select, and investigate data through popups at each Save Point.

November 16, 2021                                                                             Page 8 of 54
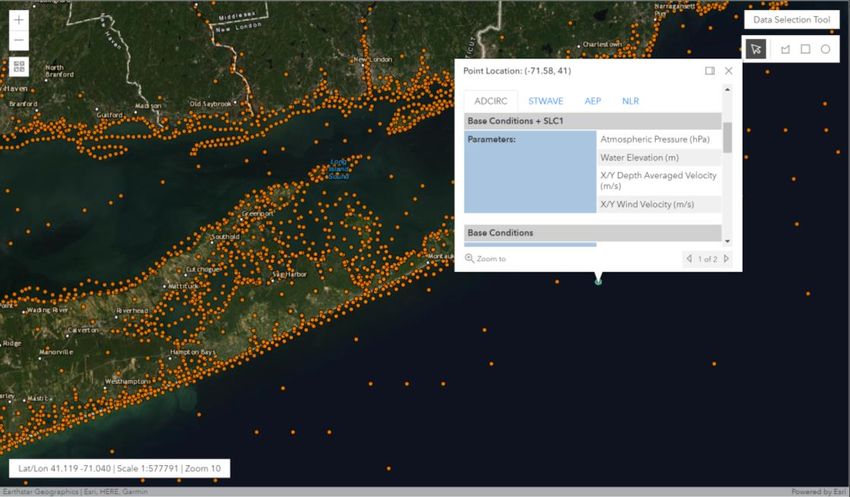
Figure 3: CHS v1.1 Web Tool Main Page (retired)

                Figure 4: New CHS Web Tool Main Page with main user interface areas indicated

                                                            Menu Bar

                                                                                            Map
                                                                                          Interface

               Navigations
                Options
                  Pane

When the Web Tool is entered by the Study option, the Map is opened with all studies shown as
polygons of the states included in each study. After selecting a study in the Regional Coastal Studies
dropdown, the Save Point (Model Condition/Area) box will be populated with model run conditions
assessed for the selected study. To see more of the Map, you can use the tools on the light gray vertical
bar between the Navigation Pane and the Map (Figure 5). Grabbing the middle line (pressing and
holding down the mouse button) allows you to adjust the width of the panel, similar to adjusting a table

November 16, 2021                                                                                 Page 9 of 54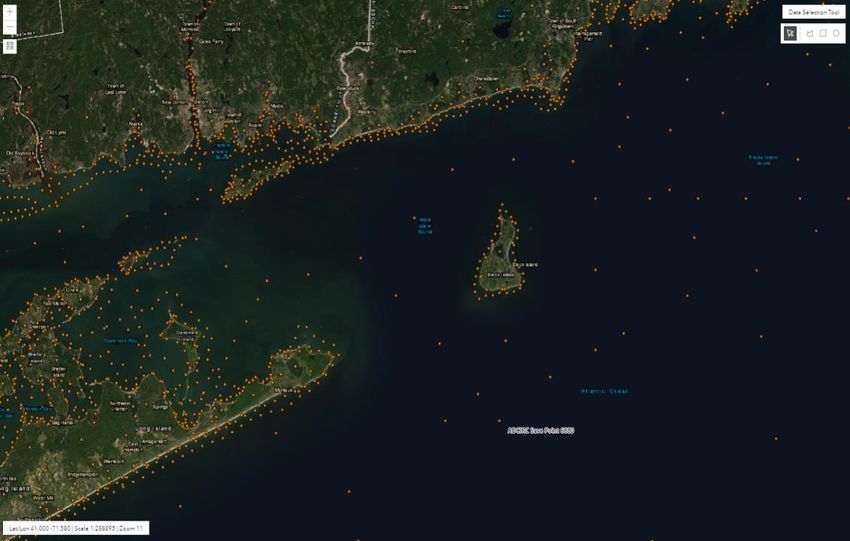
width in Word or a cell width in Excel. The left and right arrows collapse and open the pane. More detail
on filtering, viewing, and selection data at the Save Points is provided below.
                                       Figure 5: Map Interface Tools

                                            Zoom
                                                                              Arrow Tool
                                          Background
                                           Selections
                                                                                             Selection
                                                                                               Tools

                                      Nav Pane
                                      Width Tool
                                      Apply Filter
                                        Button

                                       Location/Scale/Zoom Info

1.5 Basic Map Navigation

The Map Interface is similar to CHS v1.1. Use the mouse wheel to scroll/zoom in and out on the Map. To
pan or move the Map to another location, click on the Map, hold down the left mouse button, and drag
the mouse. You can also use the plus and minus buttons on the upper left-hand side of the Map to zoom
in and out (Figure 5). The zoom distance is also reflected in the bottom left bar that shows latitude and
longitude coordinates, scale, and the Zoom Level. Zoom Level is used to determine scaled size of
hexagons and points. When zooming or panning in an area that is dense with save points, the Map may
show a spinning blue and white circle (Figure 6) to indicate it is processing.
                                          Figure 6: Processing Icon

November 16, 2021                                                                           Page 10 of 54
On the top left, below the zoom buttons, there is a tool to select different backgrounds for the Map
which looks like four small maps. Examples are shown in Figure 7. The default background is Imagery
Hybrid. On the top right of the Map (Figure 5) is the Arrow tool that is active when panning and using
tools discussed in the Save Point Navigation section. The shapes next to the arrow are for selecting data
points, which will be discussed in the Spatial Save Point Selection section.
Figure 7: Example Map Backgrounds
Streets Firefly Imagery Hybrid Nova Map
Oceans National Geographic Style USA Topo Maps
1.6 The Navigation Pane
The Navigation Pane is where the study of interest is selected and the model condition or sub-area for
save points, or storm tracks if entering through the Storm entry button, are visualized on the Map
and/or selected with the Data Selection tools for data downloads. The selections in this Pane are synced
with the Map Interface allowing users to focus on their area and data of interest. To access point
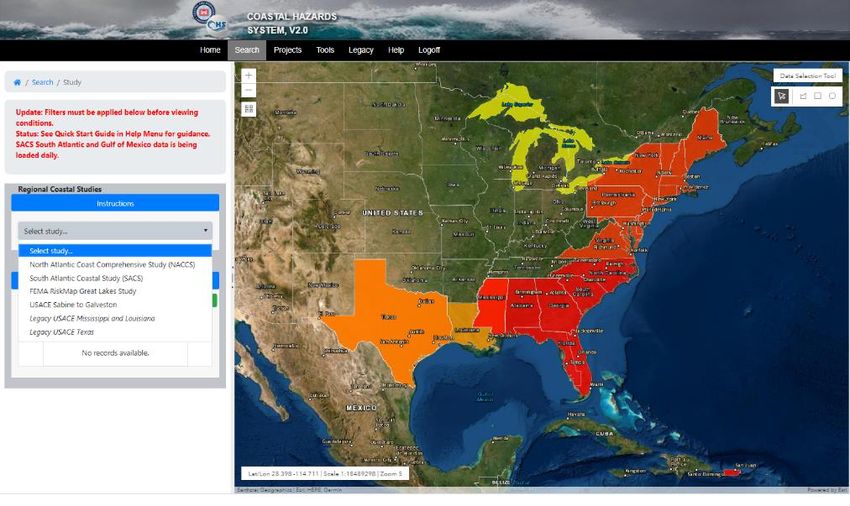
specific data, begin by selecting a Study from the Regional Coastal Studies list at the top of the
Navigation Pane. In order to access the list, click on the down arrow and scroll down to the study of
interest (Figure 8.a). After the study is selected, its name alone will show in the top Study Box and only
the study region polygon will be shown in the Map.
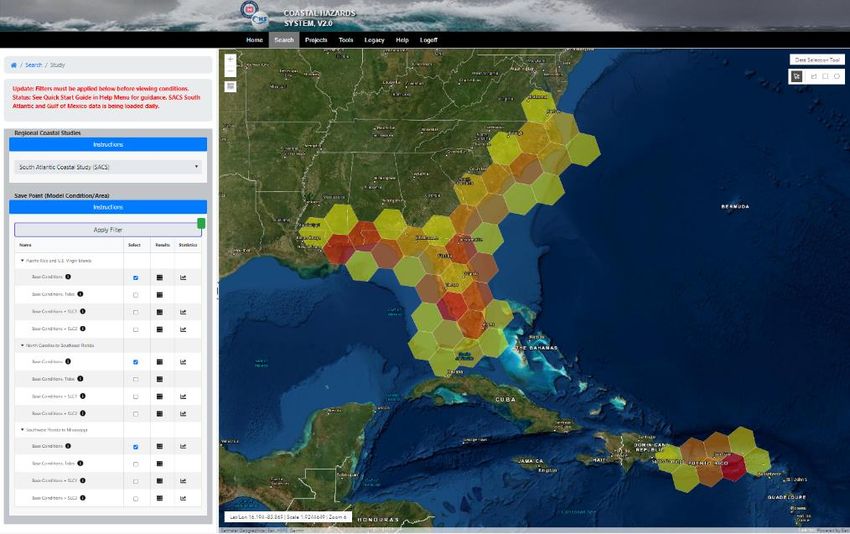
Users must press “Apply Filter” (Figure 5) to enable changes made in the navigation pane to be shown
on the Map. Once the filter has been applied, the red square to the top right of the “Apply Filter” button
will turn green indicating that changes have been applied to the Map (Figure 8.b and 8.c). Hexagons will
appear after applying the filtered conditions where darker (more red) hexagons indicate more save
points in a given area (Figure 8.c). The hexagon color gradation will be automatically scaled to display
the darkest color in the densest save point hexagon for only this specific Coastal Study Region.
November 16, 2021 Page 11 of 54Figure 8: (a) Study Selection; (b) Save Point Model Condition / Area Table; (c) Apply Filters to Map.
(a)
(b)
(c)
November 16, 2021 Page 12 of 54The Save Point Section of the Navigation Pane will populate with areas (or sub-regions) or model conditions. By default, only the modeled base conditions are selected when the regional study is chosen (Figure 8.b). The storage of model results (output data from ADCIRC, STWAVE, WAM, and/or SWAN), and Statistics Results (AEP, AEF, NLR) for the specific model conditions or sub-regions will be indicated by icons in those columns. If no icons are shown in the Results or Statistics columns, no data is unavailable for the selected study and Model Condition or Area. To turn on/off conditions or sub- regions, click the boxes under the Select column in the Navigation Pane. For example, if the Base Conditions were only turned on for Puerto Rico and the U.S Virgin Islands, then only the hexagons relative to this region would be displayed on the map. 1.7 Save Point Navigation In CHS, colored hexagons are used to represent areas that contain save points3. Areas with denser points are shown in a darker color (e.g. red) while areas with fewer points are shown in a lighter color (e.g. yellow). Hovering over a hexagon displays the number of save points in that hexagon area (note the mouse arrow in Figure 9 pointing to San Juan and showing 2306 savepoints in that hexagon). As you zoom in, the hexagon sizes are smaller to provide more detail. Note that individual points can only be viewed at a zoom scale (Zoom Level 11 or smaller) which was decided to limit the screen lag as the user navigates to the area of interest, as there is a tremendous amount of underlying data (Figure 10). In any given region, the point density will vary, therefore to query a specific point, a Zoom Level 10 or 11 may be more useful, particularly in point dense areas. For example, in Figure 11, zooming in to about 1m : 300 km (Zoom Level 11) finally spaces out save points in the ocean, though point density near the shore is high, which provides the resolution for the SACS (Figure 11). Over 1000 save points are located in the shaded polygon shown here representing the coastline and near shore of the San Juan area. 3 In the former CHS v1.1 map interface, as shown in Figure 3 above, a single shaded ellipse covered the region of a selected study. The number inside the polygon represented the number of underlying save point locations. November 16, 2021 Page 13 of 54
Figure 9: Puerto Rico and U.S. Virgin Islands SACS Sub-Region at Zoom 6 (Scale ~ 1m : 10,000 km)
Figure 10: Puerto Rico and U.S. Virgin Islands SACS Sub-Region: Left at Zoom 7 (Scale ~ 1m : 5,000 km); Right at Zoom
Level 9 (Scale ~ 1m : 1,000 km)
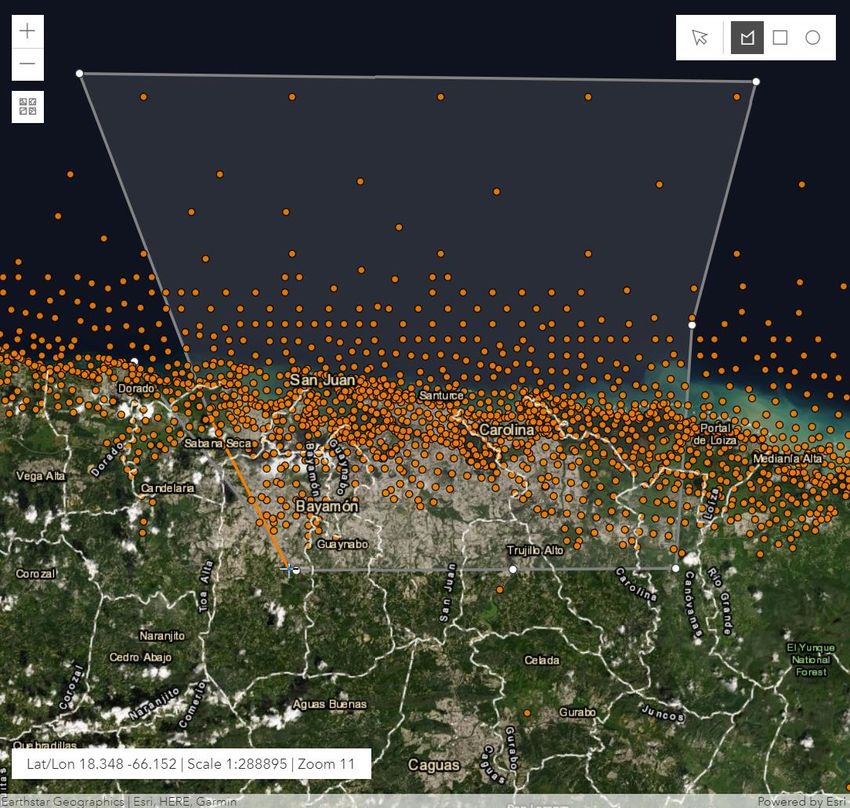
November 16, 2021 Page 14 of 54Figure 11: Puerto Rico and U.S. Virgin Islands SACS Sub-Region at Zoom 11 (Scale ~ 1m : 300 km) Once navigated to the level of interest, here near Long Island in the NACCS Study Region, and close enough that individual points can be selected, hovering over a point will display a text label that identifies the save point by its ADCIRC save point ID (Figure 12). A pop-up information window will appear if you click on a save point with the cursor and a cyan circle will surround the selected point. This window displays the location coordinates on the top, the co- located savepoint IDs and a set of tabs (Figure 13 and Figure 14). Each tab lists the parameters that are stored for the point in CHS for that tab’s model results (e.g. ADCIRC, STWAVE, WAM, AEP, etc.) or statistical results (AEF/AEP, NLR). The information displayed in the save point pop-up will reflect only the model conditions selected in the Navigation Pane (Figure 15). The AEP statistics tab also provides links to the hazard curves as a downloadable image by clicking on the graph icon in the tab. A scroll bar is provided in the pop-up to access information. To see the information more clearly, the user can dock the pop-up information on the right side of the screen where it will be taller. To dock the pop-up, click on the dock (a wide box and narrow box together) on the top right next to the ‘X’ icon. To return to the pop-up, click on the pop-up icon (two overlapping boxes, Figure 16). You may also use this tool to zoom in on the point you are querying. By pressing the Zoom to button, the Map will zoom two zoom levels closer to the point being queried. This zoom in function can be repeated as in Figure 17. November 16, 2021 Page 15 of 54
Figure 12: Hover Text for a save point

                    Figure 13: On Click Pop-up Window General Information

November 16, 2021                                                           Page 16 of 54
Figure 14: On Click Pop-up Window Models and Statistics Results Tabs 1.8 Storm Track Navigation The Storm Tracks Map display capability is currently under development and will be available soon. 1.9 Spatial Query Tools Spatial query tools are currently under development and will be available soon. Figure 15: Tabs for parameters that are stored for different models and statistics results for several conditions November 16, 2021 Page 17 of 54
Figure 16: Using the Double Square Box Tool to show Pop-up Window on Map edge and taller

November 16, 2021                                                                           Page 18 of 54
Figure 17: Selecting the Zoom to tool for the point circled in cyan

1.10 Spatial Save Point Selection

To select data, zoom in so that you can see the save points that you wish to select. On the top right,
select one of the shapes: polygon, rectangle, or circle (Figure 18).

To use the polygon tool, select the polygon and then left-click once on the Map to set the first vertex of
the polygon. Continue left clicking to place vertices of a polygon around the save points of interest. An
orange line will show the bounds of the polygon, and the area enclosed will become shaded. Finish
drawing the polygon by clicking on the original vertex placed on the map (Figure 18). The Save Point
Selection Window will automatically appear over the Map containing the list of save points within the

November 16, 2021                                                                            Page 19 of 54
polygon that was drawn.

You cannot step back to a previous vertex or change the polygon. To recreate a different polygon, click
on the ‘x’ in the top right corner of the Save Point Selection Window and start your shape again.
                          Figure 18: Selecting save point locations with polygon tool

To use the rectangle tool, select the rectangle and then left-click and hold the mouse button down to
drag in your chosen direction from the start corner of the rectangle to the opposite end corner. The
edges of the rectangle will form and a shaded area with a central cross-hair will be visible until you
release the mouse button and finish the rectangle (Figure 19). The Save Point Selection Window will
automatically appear over the Map containing the list of save points within the rectangle that was
drawn.

To use the circle tool, left-click and hold the mouse button down on the center of the circle and drag
along any radius to the edge of the circle. The diameter of the circle will form and a shaded area will be
visible until you release the mouse button and finish the circle (Figure 20). The Save Point Selection
Window will automatically appear over the Map containing the list of save points within the circle that
was drawn.

November 16, 2021                                                                            Page 20 of 54
Figure 19: Selecting save point locations with rectangle tool
Note: green arrow is for visualization only and does not appear on screen in web tool
Figure 20: Selecting save point locations with circle tool
Note: green arrow is for visualization only and does not appear on screen in web tool
November 16, 2021 Page 21 of 542 Downloading Model and Statistics Results
Once you have selected the save point locations of interest via the Map Interface using the tool
described above, to reduce the set to save points of interest, you will be able to sort and filter the save
points by ID, coordinates, and availability of model results and statistics results. From this set, a
download tool will allow sorting and filtering by storm type, model result, statistics results, sub-region,
model condition, and file attribute. Selected save point files can then be downloaded in an h5 or csv.
2.1 Save Point Filtering
After save points have been selected using the spatial shape tools from the Map, the Save Point
Selection and Download Window will open with the spatially selected save points listed (Figure 21). The
selected tab, shown in black text, is the Save Points tab. It is used for querying the Save Points selected
on the Map in order to download associated files. This tab is automatically populated with the spatially
queried save points identified on the Map. The top of the tab contains an instruction button with
information on how to use this tool. After save points have been selected, you can continue to the
Downloads tab. Though a download tool existed in the last version, the Save Point Selection and
Download Window grid tool allows the user significant flexibility in viewing, sorting, filtering and
querying data allowing CHS users to significantly reduce the amount of data they need to parse and
download.
Figure 21: Save Points Selection tab showing instruction button and a row of save points
The Save Point Selection tab contains rows with selectable checkboxes for each save point location with
columns displaying the co-located IDs, Model Results and Statistics available, and coordinates of the
point. Points can be selected for data download by either individually selecting the checkbox on the left
end of the row, or by using the select all box at the top of the check-box column (Figure 22 and Figure
November 16, 2021 Page 22 of 5423). The select all checkbox selects all visible rows (not including those hidden by a filter), and can be
used to de-select all boxes by de-selecting the select all checkbox.
Figure 22: Save Point Selection Window: Selecting individual save points
Figure 23: Selecting all save points
To change column width, hover on the line between columns and drag the column width icon that
appears (←∥→, Figure 24). To sort a column (ascending or descending) click the column header (Figure
25). A blue arrow will show the direction sorted. Click the blue arrow to reverse direction. To group the
list by column, click and drag the column header and drop it in the grouping bar titled "Drag a column
header and drop it here to group by that column" located just above the grid (Figure 26). To remove any
grouping, click the "X" next to the column name in the grouping bar.
November 16, 2021 Page 23 of 54Figure 24: Adjusting Column Width
Figure 25: Sorting Latitude Column with blue down arrow
For more detailed filtering, sorting, and available columns, click the ⋮ icon at the end of each column
header (Figure 27). A menu will appear that allows for sorting direction(s), column(s) to display, and
filtering the associated column. Select the checkboxes under the Columns menu to show and hide
desired columns (Figure 28). Filtering is available under the Filter menu based on column type. Filter
options are either checkboxes for pre-defined filtering of unique values (such as Model Types in Use, see
Downloads tab example in Figure 32) or a custom value for text filtering (such as part of an ID).
November 16, 2021 Page 24 of 54Figure 26: Group by Column Example
Top: Dragging column header to Drag a… area; Middle: Grouped by Models; Bottom: Grouped with Models: ADCIRC collapsed
Figure 27: Save Point Selection Window showing filter tools
November 16, 2021 Page 25 of 54Figure 28: Removing a Column
For value filtering, options are Contains, Starts with, or Is equal to. Choose your desired method and
enter the value or text in the search box and select Filter (do not use * or ~ notation). For example, in
Figure 29, the Co-Located IDs column is filtered for terms containing ‘Grid 5’. Then, with the filter still
on, the Select All checkbox is checked, selecting only those points that contain ‘Grid 5’ (Figure 30, Top).
Once the filter is turned off, the Select All check box is unchecked, but the filtered items remain checked
(Figure 30, middle, bottom) and rows (or points) that do not contain Grid 5 (i.e. only contain Grid 8 or no
STWAVE Grids in this set) are not selected.
To cancel a filter for any column, return to ⋮ and to the Filter menu and click on the Clear button to
remove the associated columns filter. See Telerik's Grid API for a similar sorting and filtering examples.
To continue to the Downloads tab, you must select at least one (1) or more rows. Choose the Downloads
tab at the top to continue.
Figure 29: Filter by text using Contains
November 16, 2021 Page 26 of 54Figure 30: Selecting all save points in a filtered group
Top: Selecting all save points that contain ‘Grid 5’ in their Models type, showing unselected save point row containing ‘Grid 8’, not ‘Grid 5’;
Bottom: Showing save point row showing no STWAVE (Grid #)
2.2 Selecting and Downloading Files
After clicking the Downloads tab, the list of files associated with the selected save point is displayed on
the tab with the title, Downloads, now shown in black text (Figure 31). The files can be sorted and
filtered by Storm Type, Model Result or Statistics Result type, sub-Region or Model Condition, and file
attributes (e.g. Peaks or Timeseries). The filename is shown as a reference for the user and also to
indicate the directory structure if the file is downloaded.
November 16, 2021 Page 27 of 54All the table/grid manipulation, sorting, filtering, and selection discussed above in the Save Point
Selection tab applies in this tab as well. Since many of the columns contain unique values, examples here
demonstrate using the pre-defined filtering of unique values option. For example, in Figure 32, the list of
files is filtered by two unique values of Storm Type: TS for Tropical Synthetic Storms, and VAL for
Validation Storms. In Figure 33, two unique values are selected from two different columns: Condition
set to Base Conditions and Attribute set to Timeseries. This allows the user great flexibility to only
download data for the model condition and type of data needed for their scope.
Figure 31: Download Files Window
Figure 32: File selection by two unique values
November 16, 2021 Page 28 of 54Figure 33: File selection by two columns - Condition set to Base Conditions and Attribute set to Timeseries
After filtering and sorting, select the files from this tab that you wish to download by clicking the
checkbox next to them. Then select Download H5 or .CSV files. Note that downloads will take longer for
more files, files that are large (such as timeseries files) and for download as .CSV which involves a
conversion.
Your download will begin immediately in the form of a single zip file named CHSFileDownload_YYYY-
MM-DD_HH-MM-SS.zip. An alert will appear that the server has received your request. The file will be
placed in your default Downloads location folder (Figure 34). If the notice does not appear and a blank
webpage is opened, this indicates that either the conversion or download failed. Although uncommon,
please contact the website administrators if this occurs.
Note that the folder paths are maintained in the downloaded zip, separating model results, storm types
and data types.
Figure 34: Download Alert and Zip File
November 16, 2021 Page 29 of 543 Viewing Statistics Data
The Statistics data viewing capability is currently under development and will be available soon.
Statistics results for individual point locations will be included in the CHS Web Tool. The ongoing
development will allow users to view AEF/AEP results from the on-click pop-up box by point in a table
format for easy viewing. Further development is expected to include viewing results on the Map and
through queries, similar to the NLR visualization in the CHS v1.1 tool. Lastly, a data viewing tab is
expected to be added to the Save Point Selection and Download Tab Windows.
3.1 Storm Track Data
The Storm Tracks capabilities are currently under development and will be available soon. Visual queries
under development will include storm tracks of synthetic and historical tropical cyclones.
3.2 CHS Web Tool File Formats
The CHS Web Tool currently stores and distributes specific spatial location data files (save point/station
location) in HDF5, also known as H5, format. Data files for Model results downloaded via the map
interface of the CHS Web Tool are in the H5 format.
The CHS Web Tool has been updated to allow downloading of data files in .CSV format. Additionally,
users may access the Tools tab in CHS for local conversion of downloaded H5 files. From this tab, users
may access:
MATLAB script that will convert any H5 format file to CSV format.
MATLAB script that will convert any H5 format file to a MATLAB structure for data manipulation
Non-MatLab users can download a free software package called HDFView that will allow the user to
view the data and export individual datasets to ASCII files. Please visit the following website for
instructions and additional information. (www.hdfgroup.org)For specific data requests, please refer to
the Contact Us page and contact one of our team members.
November 16, 2021 Page 30 of 544 Appendix A: Coastal Hazards System File Formats
Last update: 11/16/2021
4.1 Model Results
4.1.1 HDF5 Model
The CHS HDF5 data model for specific model results (ADCIRC, STWAVE, SWAN or WAM) can be
constructed using Table 1 and Table 2. Each HDF5 file represents model results output at a save
point (latitude, longitude, depth, ID) which contains a collection of objects (e.g., groups, dataset,
attributes…). For all model results data, each file includes a root group, which is the actual file and n
groups under the root group where n represents the number of storms modeled. The model results
HDF5 file group format and their attributes conform to Table 1.
The HDF5 file format varies for the different models at the dataset level as each model has a
different set of responses (e.g., water elevation, significant wave height, mean wave direction, etc.).
Table 2 provides a listing of the identified outputs for each model. Under each storm group in the
HDF5 file, there are m datasets where m represents the number of output types per model.
Note that some attributes may not exist in the HDF5 file for certain projects. Two result types are
available at a given save point: timeseries and peaks. In the NACCS files, the data models for time
series and peaks files are the same except for an additional dataset found in the peaks files named
Annual Exceedance Probability (AEP) (highlighted in grey in Table 2). Please note that this AEP
dataset within the peaks files has no values and will be removed from the files in future updates.
The AEP values are now located in a separate file (ref. Section 4.3.1, Table 9 below).
Table 1: Timeseries – Groups and Potential Attributes
HDF5 Name/Format Potential Attributes
Root Group (File) Name: Filename Latitude Units
Format: refer to CHS filename convention doc Longitude Units
Save Point ID
Save Point Latitude
Save Point Longitude
Project
Region
Sub-Region
Vertical Datum
CHS Data Format
Grid Name (STWAVE)
Model Run Condition
Model Run Condition
Description
CHS File Format
November 16, 2021 Page 31 of 54Groups Name: Storms Save Point Depth
Format: StormName-Num Save Point Depth Units
- StormName is the string representing Storm ID
CHS storm name convention Storm Name
- Num represents a number and is only Storm Type
used for database indexing; may be Record Interval
same as StormID value Record Interval Units
Steric Level
Name: Tropical Synthetic Storms Steric Adjustment
Format: Synthetic_StormID-Num Steric Adjustment
- StormName is the string "Synthetic" Description
followed by a StormID identifying the
Steric Adjustment Units
number of each synthetic storm
Grid Configuration Packet
modeled
Name: Tropical Historical Storms
Format: StormName_StormID- Num
- StormName is the actual storm name
followed by the HURDAT storm ID if
applicable
Name: ExtraTropical Historical Storms
Format: StormPeakdate- Num
- StormName is the date in
yyyymmddHHMM format of the peak
surge event for the storm
Table 2: Timeseries – Potential Datasets and Attributes
Model Datasets Attributes
ADCIRC Atmospheric Pressure Units
Depth Averaged Density (Optional) Model Variable
Scalar Concentration (Optional)
Water Elevation
X Depth Averaged Velocity
Y Depth Averaged Velocity
X Wind Velocity
Y Wind Velocity
yyyymmddHHMM
Annual Exceedance Probability
STWAVE Mean Wave Direction Units
Mean Wave Period Model Variable
Zero Moment Wave Height
Peak Period
Radiation Stress Gradients (Optional)
November 16, 2021 Page 32 of 54Water Elevation
Wave Breaking Indices (Optional)
Wind Direction
Wind Magnitude
yyyymmddHHMM
Annual Exceedance Probability
WAM Significant Wave Height Total Sea Units
Spectral Wave Period Total Sea Model Variable
Peak Spectral Wave Period Total Sea
Mean Wave Period Total Sea
First Moment Wave Period Total Sea
Second Moment Wave Period Total Sea
Mean Wave Direction Total Sea
Wave Directional Spread Total Sea
Wind Speed
Wind Direction
Friction Velocity
Drag Coefficient
Normalized Wave Stress
Significant Wave Height Wind Sea
Spectral Wave Period Wind Sea
Peak Spectral Wave Period Wind Sea
Mean Wave Period Wind Sea
First Moment Wave Period Wind Sea
Second Moment Wave Period Wind Sea
Mean Wave Direction Wind Sea
Wave Directional Spread Wind Sea
Significant Wave Height Swell
Spectral Wave Period Swell
Peak Spectral Wave Period Swell
Mean Wave Period Swell
First Moment Wave Period Swell
Second Moment Wave Period Swell
Mean Wave Direction Swell
Wave Directional Spread Swell
yyyymmddHHMM
Annual Exceedance Probability
SWAN Bottom Level (Optional) Units
Bottom Wave Period (Optional) Model Variable
Curve Distance From First Point To Output Point Location
(Optional)
Difference In RTM01 Average Wave Period (Optional)
Difference In Significant Wave Height (Optional)
Directional Spreading (Optional)
November 16, 2021 Page 33 of 54Energy Dissipation (Optional)
Energy Transport (Optional)
Energy Transport Direction (Optional)
Fraction Of Breaking Wave Due To Depth Induced Breaking
(Optional)
Frequency Spreading (Optional)
Friction Coefficient (Optional)
Mean Absolute Wave Period PER (Optional)
Mean Absolute Wave Period TM01
Mean Absolute Wave Period TMM10 (Optional)
Mean Absolute Zero Crossing Period (Optional)
Mean Relative Wave Period RPER (Optional)
Mean Relative Wave Period RTM01 (Optional)
Mean Relative Wave Period RTMM10 (Optional)
Mean Wave Direction
Mean Wavelength (Optional)
Numerical Energy Loss (Optional)
Peak Wave Direction (Optional)
Radiation Stresses (Optional)
Relative Peak Period (Optional)
Rms Maxima Orbital Velocity At Bottom (Optional)
Rms Orbital Velocity At Bottom (Optional)
Significant Wave Height
Smoothed Peak Period
Swell Significant Wave Height (Optional)
Water Depth (Optional)
Water Level (Optional)
Mean Wave Period
Wave Setup (Optional)
Wave Steepness (Optional)
X Current Velocity (Optional)
X Wind Velocity (Optional)
Y Current Velocity (Optional)
Y Wind Velocity (Optional)
yyyymmddHHMM
Annual Exceedance Probability
Important Note: NACCS Peaks data files downloaded prior to May 2016 are in a slightly different H5
format. Those peaks files included an additional dataset: Maxele 1-96 (highlighted in grey in Table 3).
This dataset represents the peaks of the combined surge (Base Conditions) and tide responses
corresponding to each of the 96 random tide phases simulated in ADCIRC.
November 16, 2021 Page 34 of 54Table 3: Peaks – NACCS Original H5 Format Groups, Datasets and Attributes
HDF5 Name/Format Attributes
Root Group (File) Name: Filename Latitude Units
Format: refer to CHS filename convention doc Longitude Units
Save Point ID
Save Point Latitude
Save Point Longitude
Project
Region
Sub-Region
Vertical Datum
CHS Data Format
Groups Name: Storms Save Point Depth
Format: StormName-Num Save Point Depth Units
- StormName is the string representing Storm ID
CHS storm name convention Storm Name
- Num represents a number and is only Storm Type
used for database indexing; may be Record Interval
same as StormID value Record Interval Units
Steric Level
Name: Tropical Synthetic Storms
Format: Synthetic_StormID-Num
- StormName is the string "Synthetic"
followed by a StormID identifying the
number of each synthetic storm
modeled
Name: Tropical Historical Storms
Format: StormName_StormID- Num
- StormName is the actual storm name
followed by the HURDAT storm ID if
applicable
Name: ExtraTropical Historical Storms
Format: StormPeakdate- Num
- StormName is the date in
yyyymmddHHMM format of the peak
surge event for the storm
Datasets Atmospheric Pressure Units
Water Elevation Model Variable
X Depth Averaged Velocity
Y Depth Averaged Velocity
X Wind Velocity
Y Wind Velocity
November 16, 2021 Page 35 of 54yyyymmddHHMM
Annual Exceedance Probability
Maxele 1-96
Peaks - CHS File Format V2: The file format of the Peaks data changed with the South Atlantic Coastal
Study (SACS). In this updated format, the Groups were eliminated, and the peaks values are now
represented only as Datasets. Organizing the files as one Dataset per response (e.g., water elevation,
significant wave height, mean wave direction, etc.) is a much more efficient approach than using
Groups. Each Dataset is now a single column of peaks values with the column length (number of rows)
being the number of storms. A Dataset for the Storm Name (historical storms) or Storm ID (synthetic
storms) was added to reference the rows in the other Datasets to the associated storm. Using the
HDFView program, a visual comparison of CHS File Formats V1 and V2 is provided in Figure 35 and
Figure 36.
An important change was also made for referencing the time. A Dataset named Peak Time was added
and represents hours before (+) or after (-) the storm made landfall. For instance, a value of 3.5 means
that the Peak Water Elevation at this savepoint location and for this particular storm occurred 3 and a
half hours prior to the storm making landfall. If the value were -3.5, the Peak Water Elevation would
have occurred 3 and a half hours after the storm made landfall. Another Dataset added to this format is
Landfall Time, which is the number of hours since a defined origin time of 1970-01-01 00:00:00Z. Since
landfalls are not recorded for extratropical cyclones, the Peak Time and Landfall Time Datasets are
recorded as NaN for this storm type. Additionally, the Peak Time Dataset for historical tropical cyclones
contains -99999 values in cases where the peak water level was recorded by ADCIRC during the tidal
spin-up period of the storm simulation.
November 16, 2021 Page 36 of 54Figure 35: Example NACCS Peaks File Using the CHS Peak File Format V1
Figure 36: Example SACS Peaks File Using the CHS Peak File Format V2
November 16, 2021 Page 37 of 54Important Note for CHS Peaks File Format V2: Due to changes in the methods for exporting peaks
values from the hydrodynamic models, the SACS: NCSEFL and SWFLMS peaks values were defined in a
different manner from other CHS study regions. The peak values in the STWAVE datasets were output at
the time of the peak Significant Wave Height (Hm0), and the STWAVE peaks values are only available at
the ADCIRC save point locations. The structure of the file format for the STWAVE V2 peaks files is
provided in Table 5.
However, only the maximum water elevation tables were exported for the ADCIRC peaks values.
Therefore, the peaks values for the additional datasets in the ADCIRC peaks files for SACS: NCSEFL and
SWFLMS are not correlated in time with the maximum water elevation and represent only the peak
value that occurred for that dataset during the timeseries of the storm. Table 4 provides the format of
the HDF5 model for the ADCIRC V2 peaks files.
Table 4: ADCIRC Peaks – CHS File Format V2
HDF5 Name/Format Attributes
Root Group Name: Filename CHS Data Format
(File) Format: Refer to CHS filename convention doc CHS File Format
Latitude Units
Longitude Units
Model Run Condition
Model Run Condition
Description
Project
Region
Save Point Depth
Save Point Depth Units
Save Point ID
Save Point Latitude
Save Point Longitude
Vertical Datum
Datasets Atmospheric Pressure Description
Depth Averaged Velocity, X Model Variable
Depth Averaged Velocity, Y Units
Landfall Time
Peak Time
Storm ID
Water Elevation
Wind Velocity, X
Wind Velocity, Y
November 16, 2021 Page 38 of 54You can also read