Railway Point-Operating Machine Fault Detection Using Unlabeled Signaling Sensor Data - MDPI

Page created by Norma Malone
 
CONTINUE READING
Railway Point-Operating Machine Fault Detection Using Unlabeled Signaling Sensor Data - MDPI
sensors
Article
Railway Point-Operating Machine Fault Detection
Using Unlabeled Signaling Sensor Data
Pritesh Mistry *, Phil Lane and Paul Allen
 School of Computing and Engineering, University of Huddersfield, Queensgate, Huddersfield HD1 3DH, UK;
 p.lane@hud.ac.uk (P.L.); p.d.allen@hud.ac.uk (P.A.)
 * Correspondence: p.mistry@hud.ac.uk
                                                                                                  
 Received: 31 March 2020; Accepted: 7 May 2020; Published: 9 May 2020                             

 Abstract: In this study, we propose a methodology for the identification of potential fault occurrences
 of railway point-operating machines, using unlabeled signal sensor data. Data supplied by Network
 Rail, UK, is processed using a fast Fourier transform signal processing approach, coupled with the
 mean and max current levels to identify potential faults in point-operating machines. The method
 developed can dynamically adapt to the behavioral characteristics of individual point-operating
 machines, thereby providing bespoke condition monitoring capabilities in situ and in real time.
 The work described in this paper is not unique to railway point-operating machines, rather the data
 pre-processing and methodology is readily applicable to any motorized device fitted with current
 sensing capabilities. The novelty of our approach is that it does not require pre-labelled data with
 historical fault occurrences and therefore closely resembles problems of the real world, with application
 for smart city infrastructure. Lastly, we demonstrate the problems faced with handling such data and
 the capability of our methodology to dynamically adapt to diverse data presentations.

 Keywords: condition monitoring; signal processing; fast Fourier transform; railway point-operating
 machines; turnout; fault detection; unlabeled data; smart sensors

1. Introduction
     Railway point-operating machines (POM) are electro-mechanical devices that operate turnouts,
enabling a train to be directed from one track onto another via tapering rails, known as switch blades.
POMs are located at various points along a railway line and remotely operated to divert a train to the
normal (NR), or reverse (RN) direction [1]. The NR direction allows a train to pass straight through a
turnout, while the RN direction directs the train along the alternate path.
     POM failures are considered critical failures of a rail network system. Signaling equipment and
turnout failures have been accounted for 55% of all railway infrastructure component failures [2],
leading to delays, costly repairs, and potentially hazardous situations [3]. Where delays are not kept to
within targets set out by regulators, substantial fines can be imposed onto the operator [3].
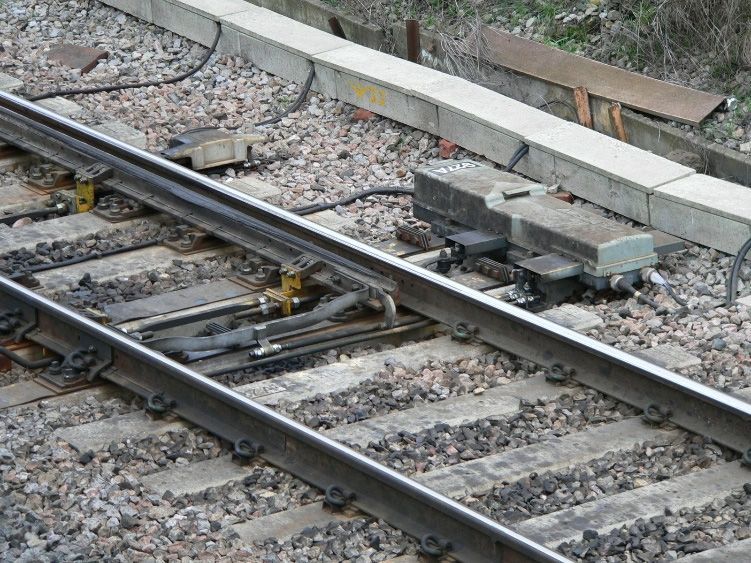
     A POM (Figure 1) will naturally undergo a process of degradation as operational wear takes
hold, ultimately leading to complete failure. If progression to failure can be identified, preventative
maintenance can be scheduled, avoiding operational down time and costly repairs. The currently
practiced methods for POM maintenance include replacement after a fixed time period or beyond an
accumulated number of actuation operations. However, they do not consider environmental influences
such as track load or weather exposure [3]. A consequence of this may be that faults occur much sooner
than expected or appear sporadically without explanation. More dynamic detection methods are thus
sought to help monitor such occurrences.

Sensors 2020, 20, 2692; doi:10.3390/s20092692                                 www.mdpi.com/journal/sensors
Early fault detection methods relied solely on threshold settings [4], but produced limited
success with a high false positive detection rate [5]. A thresholding method is unable to foresee a
potential fault developing, unless the threshold is set unnecessarily lower than optimal. It also adopts
a one-size-fits-all
Sensors 2020, 20, 2692 approach, and is not adaptable to the individual behavioral characteristics 2 of of
                                                                                                        13
mechanical devices [3].

              Figure
              Figure 1.
                     1. Point-operating
                        Point-operating machine
                                        machine (POM)
                                                (POM) (https://en.wikipedia.org/wiki/Railroad_switch).
                                                      (https://en.wikipedia.org/wiki/Railroad_switch).

      Statistical
      Early     faultapproaches
                        detection methodshave fared       better,
                                                     relied   solely [2,6–10]    and provide
                                                                        on threshold       settings the   added
                                                                                                       [4],        advantage
                                                                                                            but produced            of being
                                                                                                                                 limited          able
                                                                                                                                             success
to function
with  a high in       realpositive
                  false     time, without
                                      detection  therate
                                                       need[5].forA historically
                                                                     thresholding    labelled
                                                                                        methoddata       of “good”
                                                                                                   is unable           and “bad”
                                                                                                                 to foresee              examples.
                                                                                                                                a potential      fault
Garcia et al.,unless
developing,         used the the Kalman
                                  threshold   filter
                                                 is setapproach
                                                         unnecessarilyand compared
                                                                              lower thannew        data to
                                                                                              optimal.        a reference
                                                                                                           It also adopts apoint        to identify
                                                                                                                                one-size-fits-all
faults. Their
approach,      and   relatively     straight to
                       is not adaptable          forward      approach
                                                    the individual             was ablecharacteristics
                                                                           behavioral       to detect the of    majority
                                                                                                                    mechanicalof faults
                                                                                                                                      devicesas they
                                                                                                                                                   [3].
occurred      [2]. Statistical
      Statistical       approaches  feature
                                          have  extraction      of signal
                                                    fared better,            data and
                                                                        [2,6–10]     followed
                                                                                           provide by clustering
                                                                                                         the addedtechniques
                                                                                                                         advantagehave           been
                                                                                                                                           of being
successfully
able  to function    demonstrated
                          in real time,    as without
                                                a usefulthe  faultneeddetection       approach.
                                                                           for historically           A study
                                                                                                  labelled     datathat
                                                                                                                      of extracted
                                                                                                                           “good” and      over    ten
                                                                                                                                               “bad”
statistical features
examples.       Garcia etfrom         theirthe
                               al., used      signaling
                                                  Kalmandata,  filter discovered
                                                                       approach and     thatcompared
                                                                                               many of new   the faults
                                                                                                                   data toinvestigated
                                                                                                                              a reference point were
identifiable
to identify faults.by only     tworelatively
                            Their     features; the      maximum
                                                    straight     forward  force   and thewas
                                                                              approach        rootable
                                                                                                     mean to square
                                                                                                              detect the(RMS)      [7]. Evidently
                                                                                                                             majority      of faults
there
as theyare      clear advantages
           occurred        [2]. Statistical for feature
                                                   using extraction
                                                             a statisticalof approach,
                                                                                  signal datanotably
                                                                                                   followed    they   are well understood
                                                                                                                 by clustering         techniques
endpoints,
have             with relatively
       been successfully                 fast computations
                                     demonstrated          as a usefuland therefore        able toapproach.
                                                                             fault detection           highlight A   attributes
                                                                                                                        study that  of the     signal
                                                                                                                                          extracted
data that
over          are not otherwise
      ten statistical        features fromvisible.their signaling data, discovered that many of the faults investigated
wereRecently
        identifiable  reported
                            by onlywork  twohasfeatures;
                                                   covered the  the vast    field offorce
                                                                      maximum          machine and learning
                                                                                                      the root techniques,
                                                                                                                   mean square      with    labelled
                                                                                                                                        (RMS)       [7].
data to train
Evidently      there intelligent
                        are clearmodels
                                      advantages to predict
                                                        for usingfuture    failures.approach,
                                                                      a statistical     Although notablyhighly successful,
                                                                                                                  they are well    theunderstood
                                                                                                                                         downside
of such models
endpoints,       withisrelatively
                            the requirement           of labelled and
                                         fast computations            datatherefore
                                                                              to train aablemodel,      which is not
                                                                                                  to highlight            readilyofavailable
                                                                                                                     attributes          the signal  in
a real
data  thattime
             are not setting.    Nevertheless,
                          otherwise       visible. we shall briefly discuss some machine learning approaches
discovered
      Recently    from    the literature
                      reported     work has   used     in condition
                                                  covered       the vastmonitoring
                                                                            field of machineapplications.
                                                                                                     learning techniques, with labelled
data For    POMs
      to train          producing
                    intelligent    modelssignalto data,
                                                   predict  the   predominant
                                                              future                  condition highly
                                                                         failures. Although          monitoring       approach
                                                                                                               successful,            seems to be
                                                                                                                               the downside          of
that of
such       support
      models        is thevector      machines
                             requirement             (SVM).data
                                                of labelled       SVM  to models       are margin-based
                                                                           train a model,                          discriminant
                                                                                                which is not readily         available  classifiers,
                                                                                                                                            in a real
shown
time       to perform
      setting.                well with
                      Nevertheless,        wesuchshalldata.
                                                         brieflyFordiscuss
                                                                      example,  some using     discrete
                                                                                         machine            wavelet
                                                                                                       learning         transformdiscovered
                                                                                                                    approaches           to extract
features
from   the at     different
             literature         levels
                             used         of decomposition,
                                     in condition        monitoring    SVM      classifiers built with these features were highly
                                                                           applications.
accurate     in classifying
      For POMs          producing   faults,
                                         signalincluded
                                                   data, the  being     able to classify
                                                                  predominant         condition the monitoring
                                                                                                      severity of approach
                                                                                                                      fault occurrenceseems to   [11].
                                                                                                                                                     be
Vileiniskis
that of support   et al.,    used
                        vector        features(SVM).
                                  machines          extracted
                                                            SVMfrom models   non-faulty       POM actuations
                                                                                are margin-based          discriminant to develop
                                                                                                                             classifiers,  decision
                                                                                                                                              shown
boundaries
to perform well    of a one-class
                         with suchSVM.   data. They      then tested
                                                  For example,             their
                                                                       using       modelwavelet
                                                                                discrete     with unseen        data to
                                                                                                         transform      tosee   if thefeatures
                                                                                                                            extract       actuation  at
signals    were     abnormal,       which     fell  outside      of this  boundary,       and    would
different levels of decomposition, SVM classifiers built with these features were highly accurate in       be  flagged    as  failures     [3].  Bian
et al., combined
classifying      faults, self-organizing
                           included being able      maps  to (SOM)
                                                             classify with       SVM toofclassify
                                                                          the severity                     degradation
                                                                                               fault occurrence        [11]. states      of POMs,
                                                                                                                               Vileiniskis      et al.,
achieving
used   features accuracies
                      extractedinfrom  the non-faulty
                                            region of POM    96 %actuations
                                                                       [9]. Usingtoprincipal           component
                                                                                         develop decision               analysisof for
                                                                                                                  boundaries                 feature
                                                                                                                                        a one-class
reduction,
SVM.     TheyEker  thenettested
                             al., developed
                                     their model   a SVMwithfault
                                                                unseendetection
                                                                            data tomodel
                                                                                       see if that    achieved 100
                                                                                                the actuation            % accuracies
                                                                                                                    signals    were abnormal, [10]. It
is worthwhile
which     fell outside to note      thatboundary,
                              of this      studies reporting
                                                          and would     highbeaccuracies
                                                                                  flagged aswere         often[3].
                                                                                                  failures       foundBiantoetbe  al.,using
                                                                                                                                        combinedsmall
datasets or simulated
self-organizing         maps (SOM)data towithbuild SVM models.      Although
                                                           to classify              this is common
                                                                           degradation                      practice
                                                                                              states of POMs,          in the domain,
                                                                                                                     achieving      accuracies  thesein
models
the region may of perform
                    96 % [9]. comparatively
                                  Using principalwhen             presented
                                                          component              withfor
                                                                            analysis     larger   volumes
                                                                                             feature            of real-world
                                                                                                        reduction,     Eker et al., examples.
                                                                                                                                        developed
a SVM fault detection model that achieved 100 % accuracies [10]. It is worthwhile to note that studies
reporting high accuracies were often found to be using small datasets or simulated data to build
models. Although this is common practice in the domain, these models may perform comparatively
when presented with larger volumes of real-world examples.
Sensors 2020, 20, 2692                                                                             3 of 13

      Shape analysis is also a common approach to condition monitoring problems, and more relevant
to this study than the use of classifiers alone. Shape analysis primarily focuses on understanding the
signal shape profiles of normal and abnormal actuation events, attempting to identify subtle differences
caused by the aging of an instrument. These differences can then be modelled for fault identification.
Sa et al., used a shapelet algorithm which extracts a subsequence of the time series called a shapelet.
The shapelet attempts to minimize the in-class distance while maximizing the between-class distance of
examples in the dataset. They used these extracted subsequences with a decision tree model, producing
accuracies of 97 % [1]. In a similar study, Garcia et al., compared the expected shapes of signals and
used a vector autoregressive moving-average model (VARMA) to forecast the outcome of new signals.
If the new signal resulted in a signal beyond the expectation of the model a fault was considered to
have been detected [12].
      In this study, we use real-world unlabeled data collected from POMs to identify potential fault
occurrences using a fast Fourier transform and curve fitting approach. It builds on our previously
reported work in this area [13]. We corroborate our methodology against more traditional thresholding
approaches to evaluate the effectiveness of our proposed method.
      The remainder of this article is arranged as follows: Section 2 details the data used in this study
and the pre-processing steps leading to actuation extraction. Section 3 presents the methodology
of this work, more specifically, feature extract from actuation signal data, fast Fourier transform,
and curve fitting, which are all integral parts of the proposed methodology. The results of this work
with interpretation of findings are detailed in Section 4. Lastly the work is concluded in Section 5.

2. Signal Sensor Data
      In this study, we use electrical current draw data collected by sensors attached to POMs across
three regions of the United Kingdom (UK); London North-Eastern (LNE), London North-Western
(LNWN) and Sussex. Data have been collected and supplied by Network Rail, UK, and contains the
records of 331 POMs, whose actuations have been recorded over a period from April 2018 to June 2018.
      The data for each region consists of several thousand csv (comma-separated values) files, each file
containing a daily log of all the actuation operations performed by any particular POM in a given
direction (NR or RN). Each file contains the current draw in amperes (amps or A) against a time stamp
recorded in milliseconds (ms) as a continuous sequential log for any given day. Depending on the
physical location of a particular POM, an instrument on a busy railway line will naturally contain
many more actuations per day than a POM located on an infrequently used railway line. The daily log
files which make up the dataset are therefore populated with a varying number of actuations according
to frequency of POM use.
      Table 1 shows the number of files and POMs in each of the three regions initially available from
the dataset. The data are considered to be unlabeled as no indication of fault occurrences within the
logged events or otherwise are available.

                            Table 1. Files present in the dataset for each region.

                                Region         No. of Files      No. of POMs
                                 LNE              15,802               103
                                LNWN              17,081               129
                                Sussex            12,807                99

     An example of a subset of data extracted for point-operating machine POM-1 moving in the NR
direction is shown in Table 2. These data were recorded on the 1st June 2018, with the initial data entry
beginning at 02:28:05.527 in the morning. The table shows the first five records (Row0-Row4) and
the last five records (Row242-Row246) of the first actuation. The first five records of the subsequent
actuation are also shown (Row247-Row251). This example illustrates the continuous sequential way the
data are recorded. The frequency of which the data are recorded during an actuation is approximately
Sensors 2020, 20, 2692                                                                                  4 of 13

10 ms. Once an actuation has executed, data recording stops until the next operation of the POM is
actioned. Since the frequency of data records in any given actuation is approximately 10 ms, we can
distinguish between two sequential actuations by noting the time difference between each record.
Row246 and Row247 of Table 2 represent the end of one actuation (Row246) and the beginning of the
next actuation (Row247) for point-operating machine POM-1 in the NR direction. The time stamp for
these records are recorded as 2018-06-01 02:28:07.977 (Row246) and 2018-06-01 05:30:57.793 (Row247).
This time difference equates to many minutes and indicates that those two records cannot belong to the
same actuation event. Lastly, we can see from this data that for any given actuation, the current draw
recording begins at a value of 0.00 A (zero amps) and ends with a recorded value of 0.00 A. This is seen
for the records at Row0 (start of the first actuation) and Row246 (end of the first actuation), then again
at Row247 (start of second actuation).

      Table 2. Current (A) draw signal data for point-operating machine POM-1 moving in the NR direction.

                         Row No.              Date Time              POM-1 NR Current
                          Row0          2018-06-01 02:28:05.527               0.00
                          Row1          2018-06-01 02:28:05.537              13.18
                          Row2          2018-06-01 02:28:05.547              19.43
                          Row3          2018-06-01 02:28:05.557              18.04
                          Row4          2018-06-01 02:28:05.567              16.15
                             ..                    ..                           ..
                              .                     .                            .
                         Row242         2018-06-01 02:28:07.937               0.82
                         Row243         2018-06-01 02:28:07.947               0.81
                         Row244         2018-06-01 02:28:07.957               0.80
                         Row245         2018-06-01 02:28:07.967               0.76
                         Row246         2018-06-01 02:28:07.977               0.00
                         Row247         2018-06-01 05:30:57.793               0.00
                         Row248         2018-06-01 05:30:57.803               0.81
                         Row249         2018-06-01 05:30:57.813              16.22
                         Row250         2018-06-01 05:30:57.823              19.37
                         Row251         2018-06-01 05:30:57.833              17.55
                            ..                      ..                           ..
                             .                       .                            .

      Table 2 represents a typical example of the data files contained within the larger dataset available
for this study. The frequency of data records is 10 ms, although for some files, individual records that
exceeded a 10 ms frequency is observed.

2.1. Pre-Processing
      Where real-world data is concerned, it is seldom free of error. As such, a significant element of
pre-processing was required. For this study, all our data pre-processing and analysis was performed
using Knime analytics platform [14] and R Statistical package [15]. Where sensors are concerned,
missing records are common errors due to sensor malfunctions and other equipment failures. To begin,
all 45,690 files were checked for errors. Files that contained missing values or erroneous values which
resulted in logged data not akin to that shown in Table 2 were removed from the dataset. Most of the
errors identified involved data files which were entirely absent of any recorded data.
      Although the csv files in our dataset were labelled with the operating point machine name and
date of data collection, we discovered several csv files in different folders with identical file names.
Unable to ascertain the validity of these files, all files with duplicate file names were also removed
from the dataset.
Sensors 2020, 20, 2692                                                                              5 of 13

     For sensor data of this nature or similar, many different types of errors can present themselves in
the final dataset. As such, the data cleansing process is often unique to the task at hand. Since our
dataset was large, removal of erroneous files was not an issue. For smaller datasets, an appropriate
method for handling erroneous data would be more appropriate. The initial pre-processing step
described, reduced the dataset from 45,690 files to 23,389 files, as shown in Table 3.

                            Table 3. Remaining files after removal or erroneous files.

                                  Region         No. of Files      No. of POMs
                                   LNE               6533                97
                                  LNWN               9715               105
                                  Sussex             7141                91

2.2. Actuation Extraction
      Once the data was cleansed of errors, the remaining 23,389 files were further processed.
The methodology proposed in this paper requires each individual actuation to be processed separately.
This is required so that features can be extracted from each actuation. In this study, the direction of
actuation, either NR or RN, were not treated separately. Rather the actuation for a given machine
in either direction was simply treated as a sequential movement operation performed by the POM.
For this initial study, the assumption was made that the occurrence of a fault would be apparent
regardless of the direction of movement.
      For our dataset, the frequency of current draw measurements was typically 10 ms between records
as seen in Table 2. On occasion a value greater than 10 ms, generally between 20-100, is observed.
Given these observations, it was decided that a timestamp difference of greater than 500 ms would be
used as the threshold value for distinguishing between adjacent actuations in the sequential data records.
      As an example, records in Row0-Row246 of Table 2 all show a time difference of 10 ms between
subsequent records. However, the time difference between Row246 (2018-06-01 02:28:07.977) and
Row247 (2018-06-01 05:30:57.793) of Table 2 is greater than 500 ms. This difference of greater than 500 ms
indicates the end of one actuation and the start of the subsequent actuation. It is also worthy of mention
that all actuation events begin with a current reading of 0.00 A (zero amps) and end with a current
reading of 0.00 A. This can be seen in Table 2 for records Row0 (start of first actuation) and Row246
(end of first actuation), and once again for Row247, which is the start of the subsequent actuation.
      A typical current draw signal of a single actuation event for point-operating machine POM-1 is
shown in Figure 2. This event was recorded on the 01st June 2018 with the instrument moving in the
NR direction. Some of the data points for this actuation are shown in Table 2. In this paper, we describe
two phases of an actuation event—the push-out phase and the swing phase. These phases are used
in our proposed methodology to extract features from the actuation event. In other published work,
Vileiniskis et al. [3], further defines the push-out phase to consist of two stages—the motor start-up
and the unlocking stages. The swing phase also consists of two stages—the switch rail movement and
the locking stages. Other studies also describe the actuation signal similarly [5,9,16]. For the purpose
of this study, we will keep with the two phases shown in Figure 2 namely the push-out phase and the
swing phase.
Sensors 2020, 20, x FOR PEER REVIEW                                                                                                             6 of 14

                   2.    Extraction of the mean current draw and time duration of the swing phase.

  Sensors 2020,   3. x FOR
                        FastPEER
                              Fourier Transformanalysis of the time domain signal into frequency domain
Sensors 2020, 20,20,
                  2692           REVIEW                                                                 6 of
                                                                                                      6 of 1314
                       representations, followed by goodness of fit analysis of a linear fitted cure.
                    2. Extraction of the mean current draw and time duration of the swing phase.

                    3.    Fast Fourier Transform analysis of the time domain signal into frequency domain
                          representations, followed by goodness of fit analysis of a linear fitted cure.

       Figure 2. Current draw signal of a single actuation event for point-operating machine POM-1, moving
        Figure 2. Current draw signal of a single actuation event for point-operating machine POM-1, moving
       in the NR direction, recorded on the 01st June 2018. The push-out phase (red) and swing phase (blue)
        in the NR direction, recorded on the 01st June 2018. The push-out phase (red) and swing phase (blue)
       of the actuation event are shown.
        of the actuation event are shown.
3. Method
          To     isolate
            Figure          the push-out
                      2. Current                   phase        fromactuation
                                                                          the swing        phase      for any given        actuation,     a fixed time
        After       isolation     ofdraw   signal
                                      actuation        of a single
                                                         signals for          each event
                                                                                      POM,    for point-operating
                                                                                                 as described above,   machine    POM-1,
                                                                                                                                the   faultmoving
                                                                                                                                             detection
 duration          could    be   used    as  a   cut-off       point      to  separate      the   two     phases.
            in the NR direction, recorded on the 01st June 2018. The push-out phase (red) and swing phase (blue)      However,     the   current   draw
methodology proposed in this study involves the extraction of three principal features from these
 signalofproduced              by   POMs
                the actuation event are shown.  are     not     only      unique      between        different     instruments       but   also  change
signals. These features are then used to develop our fault detection capabilities. The three features
 significantly for the same POM over time. Figure 3 shows the current draw signal of two different
extracted
 POMsTomoving     are as follows:
                  isolateinthe thepush-out
                                     NR direction.  phaseThe     from signals      produced
                                                                           the swing        phase arefor visibly   different
                                                                                                            any given           in several
                                                                                                                            actuation,        ways,time
                                                                                                                                           a fixed    for
 example,
1.duration
         Extractionthe  maximum
                    couldofbe theused   current
                                   maximumas a cut-off value
                                                      current     (peak
                                                                 point      current)
                                                                    drawto(peakseparate  is  noticeably
                                                                                             the and
                                                                                      current)     two time  different
                                                                                                          phases.         for
                                                                                                                       However,
                                                                                                                duration       the  two
                                                                                                                             of thethe    instruments.
                                                                                                                                          current
                                                                                                                                      push-out      draw
                                                                                                                                                 phase.
 The
2.signal signal      produced
                produced       by  by   the
                                     POMs     twoare   POMs
                                                         not       after
                                                                 only       the
                                                                           unique
         Extraction of the mean current draw and time duration of the swing phase.1000   ms
                                                                                       between point    are  also
                                                                                                      different     noticeably
                                                                                                                    instruments   different.
                                                                                                                                      but   also  change
          For any single      theactuation       event,       thetime.
                                                                    current      draw     signal theis represented       by two    arrays,   I and   T, of
3.significantly
         Fast Fourier    for Transform
                                   same POM  analysis   over of the     timeFigure
                                                                                domain3 shows
                                                                                            signal intocurrent
                                                                                                            frequency draw   signal
                                                                                                                          domain       of two   different
                                                                                                                                      representations,
 equal
  POMs       size,
               movingn. Where   theI =NR[i1…i   n] and T The     = [t1…tn], I represents           the
                                                                                                   are current       draw array,      while Tways,
                                                                                                                                                denotes
         followed        byingoodness       direction.
                                            of  fit analysis ofsignals    a linear  produced
                                                                                      fitted cure.        visibly different      in several            for
 the    time array.
  example,                 The start current
                    the maximum           and endvalue     points      of the
                                                                   (peak          push-out
                                                                             current)            phase signal
                                                                                          is noticeably              can therefore
                                                                                                              different    for the two  be instruments.
                                                                                                                                            denoted by
 (tThe  To
    pstart , iisolate
          signal         the(tpush-out
              pstart) produced
                      and      pend,by
                                     ipend )phase
                                         the   two POMs from the
                                              respectively,             swing
                                                                      and
                                                                    after         phase
                                                                              similarly
                                                                             the   1000 ms  for
                                                                                             the any
                                                                                                  start
                                                                                                point  given
                                                                                                           and
                                                                                                         are    actuation,
                                                                                                                 end
                                                                                                              also      pointsa fixed
                                                                                                                     noticeably      thetime
                                                                                                                                 ofdifferent. duration
                                                                                                                                          swing    phase
could
 signalbe   For used
              can   be as
                  any      a cut-off
                        denoted
                         single      bypoint
                                          (tsstartto
                                  actuation            separate
                                                   , isstart
                                                  event,    ) and     the
                                                                      (tsendtwo
                                                               the current         phases.
                                                                             , isend           However,
                                                                                    ) respectively.
                                                                                  draw     signal            the current
                                                                                                     is represented       bydraw     signal produced
                                                                                                                              two arrays,     I and T, of
byequal
     POMs     size,aren.not   onlyI unique
                          Where       = [i1…in]betweenand T = different
                                                                     [t1…tn], I instruments
                                                                                    represents the     but   also change
                                                                                                          current              significantly
                                                                                                                      draw array,      while T for   the
                                                                                                                                                 denotes
same      POM        over   time.   Figure      3   shows        the   current      draw     signal
  the time array. The start and end points of the push-out phase signal can therefore be denoted       of  two   different   POMs      moving     in theby
NR    direction.
  (tpstart              The(tsignals
            , ipstart) and                produced
                                pend, ipend ) respectively,  are visibly       different in
                                                                       and similarly          theseveral
                                                                                                   start andways, end forpoints
                                                                                                                          example,     theswing
                                                                                                                                  of the    maximumphase
current
  signal value can be(peakdenotedcurrent)     is noticeably
                                      by (tsstart   , isstart) and different
                                                                       (tsend, isendfor   the two instruments. The signal produced by
                                                                                     ) respectively.
the two POMs after the 1000 ms point are also noticeably different.

        Figure 3. Current draw signal of actuation events for point-operating machines POM-2 (peak current
        ≈ 20A) and POM-3 (peak current ≈ 15A) in the NR direction.

       Figure
        Figure3.3.Current
                   Currentdraw signal
                            draw      of actuation
                                  signal           events
                                          of actuation    for point-operating
                                                        events                machines
                                                                for point-operating    POM-2 (peak
                                                                                    machines POM-2   (peak≈current
                                                                                                   current  20A)
       and POM-3   (peak  current ≈ 15A)  in the NR  direction.
        ≈ 20A) and POM-3 (peak current ≈ 15A) in the NR direction.
Sensors 2020, 20, 2692                                                                                  7 of 13

     For any single actuation event, the current draw signal is represented by two arrays, I and T,
of equal size, n. Where I = [i1 . . . in ] and T = [t1 . . . tn ], I represents the current draw array, while T
denotes the time array. The start and end points of the push-out phase signal can therefore be denoted
by (tpstart , ipstart ) and (tpend , ipend ) respectively, and similarly the start and end points of the swing
phase signal can be denoted by (tsstart , isstart ) and (tsend , isend ) respectively.
     To automate the separation of the push-out phase from the swing phase, we employed a gradient
of the slope method, calculated using pair-wise sequential adjacent records. For current draw, i,
and time, t, then;
                                                                   [i] − [i − 1]
                                              gradient ( gradn ) =                                          (1)
                                                                   [t] − [t − 1]
     The aim of the gradient of the slope method is to identify point (tsstart , isstart ) in the signal data.
For any given actuation, the signal begins with a positive gradient from point (tpstart , ipstart ) up to the
peak current point (denoted here as (tpeak , ipeak ), see Figure 3). After the peak current, the gradient
turns negative as the current draw value descends. At some point during this descend the gradient
becomes non-negative (i.e., grad ≥ 0.00), which we deem to be the start of the swing phase. To identify
the start of the swing phase (tsstart , isstart ), an array, G, of length n, is represented by

                                           1, if ( gradn ≥ 0 and gradn−1 < 0)
                                       (
                                G=                                                                         (2)
                                           0, otherwise

        The index position at which the first occurrence of “1” appears in array G, therefore, corresponds
to the index position of array, I, and array, T, whose values correspond to the coordinates for (tsstart ,
isstart ). This therefore identifies the point along the actuation signal which corresponds to the beginning
of the swing phase.
        Upon separation of the push-out phase from the swing phase, the following features are extracted.
        Peak current: The peak current (tpeak , ipeak ) of a signal is found in the push-out phase of an
actuation (see Figure 3). The peak current is taken as the maximum single current draw value found in
the push-out phase.
        Push-out phase time duration: The push-out duration is taken as the time difference in milliseconds
(ms) between tpend and tpstart .
        Mean current of the swing phase: The mean current draw of the swing phase is taken as the
arithmetic mean current value of the swing phase.
        Swing phase time duration: The swing duration is taken as the time difference in milliseconds
(ms) between tsend and tsstart .

3.1. Fast Fourier Transform Analysis
     The time series signal data of an actuation event of a POM is shown in Figure 2. Fast Fourier
transform (FFT) facilitates the analysis of such signals in the time domain, to deconstruct components
into a frequency domain representation. It is then possible to analyze the different frequencies present
in the original signal using the frequency domain components that are represented as discrete values
or bins (discrete Fourier transform (DFT)). The frequency domain is useful at showing if noise or jitter
is contained within your time domain signal, which is helpful when attempting to identify spurious
actuation signals from unlabeled data. The principles of FFT are well explained in the literature [17,18]
and so not explained further. The details of the application of FFT for this study is discussed herein.
     Typically, each single actuation event in the dataset resulted in approximately 250 sample points.
To ensure all actuation events were processed equally, a zero padding was added to the end of
every actuation signal which resulted in all profiles containing 512 samples and allowing quicker
computation time. A sliding window of size 512, together with a step size of 256 was used with the
input signal. The Hann windowing function was applied to the signal, this minimizes spectral leakage,
allowing the FFT to extract spectral data, and prevents it from producing the wrong frequencies.
Sensors 2020, 20, 2692                                                                                                               8 of 13

  Sensors 2020, 20, x FOR PEER REVIEW                                                                                                  8 of 14
FFT assumes a finite dataset, which can be thought of as a single period of a periodic signal. If data are
  theofamplitude
not               of the discontinuous
        periodic circular                 data at the
                           topologies, windowing      boundaries
                                                    using the Hann offunction,
                                                                      the signal. A FFTthe
                                                                                reduces  of the signal domain
                                                                                             amplitude  of the
  data shown indata
discontinuous     Table   2, for
                      at the     point-operating
                              boundaries          machine
                                          of the signal.   POM-1
                                                         A FFT     moving
                                                               of the  signalin the NRdata
                                                                              domain    direction,
                                                                                            shownisinplotted
                                                                                                      Table 2,as
  a frequency
for            domain
    point-operating      plot inPOM-1
                      machine     Figure moving
                                         4.      in the NR direction, is plotted as a frequency domain plot
in Figure 4.

      Figure 4. Fast Fourier transform, frequency domain plot of the time domain signal data shown in
        Figure 4. Fast Fourier transform, frequency domain plot of the time domain signal data shown in
      Table 2 for point-operating machine POM-1, moving in the NR direction.
        Table 2 for point-operating machine POM-1, moving in the NR direction.
3.2. Curve Fitting
  3.2. Curve Fitting
      For actuation events to be compared, it is necessary to process the frequency domain plots
produced For (see
                actuation
                      Figureevents      to be compared,
                                4). Anomalies         in actuation it is events
                                                                            necessary can tothenprocess     the frequency
                                                                                                    be identified             domain
                                                                                                                    to indicate          plots
                                                                                                                                   possible
  produced
fault  occurrence (see Figure
                         in the 4).
                                  POM.Anomalies
                                            An attempt  in actuation
                                                               to fit second eventsand  canthird
                                                                                              then order
                                                                                                      be identified   to indicate
                                                                                                             polynomials     to thepossible
                                                                                                                                      curve
  fault   occurrence       in  the  POM.      An    attempt      to   fit   second      and    third
proved unsuccessful, although other studies have been more successful with their data [16]. Thus,      order   polynomials      to  the curve
  proved      unsuccessful,      although      other     studies     have     been     more     successful
the frequency domain signal was further processed by taking the log10 values of both the Amplitude             with their  data   [16]. Thus,
  thethe
and    frequency
            Frequency  domain
                           values signal   was further
                                     produced       from the  processed
                                                                  FFT analysis.by taking the log10 values of both the Amplitude
  andLogthe10Frequency       values    produced        from   the    FFT     analysis.
                 calculations produce a more linear relationship between the Amplitude and Frequency
domain,  Log   10 calculations
             allowing     a linearproduce
                                    curve to abemore  fittedlinear
                                                              and the  relationship
                                                                            goodness of     between      the Amplitude
                                                                                               fit calculated.              and Frequency
                                                                                                                 The frequency       domain
  domain,
data  used allowing
               in Figure a4 linear
                               has beencurvelogto
                                                10
                                                   be   fitted
                                                    transformed  and    the
                                                                        and   goodness
                                                                                fitted   withof  fit
                                                                                                 a   calculated.
                                                                                                   linear   curve  The
                                                                                                                   usingfrequency
                                                                                                                          the  R      domain
                                                                                                                                  statistical
  data   used     in Figure    4 has  been    log 10  transformed
package [15]. A plot of this data is shown in Figure 5 below.              and    fitted   with    a linear  curve  using   the  R  statistical
  package
      After [15].
               curveAfitting,
                         plot ofthethisgoodness
                                         data is shown
                                                     of fit isinassessed
                                                                   Figure 5asbelow. the residual standard error (RSE). This makes
         After     curve   fitting,  the   goodness        of  fit
for the final feature extracted for our fault detection analysis.   is  assessed       as the residual standard error (RSE). This
  makes     for   the  final  feature   extracted      for  our   fault
      These observed residuals are subsequently used as an estimation       detection      analysis. parameter of the variability in
         These observed
the samples.        When theresiduals
                                 RSE is 0 are      subsequently
                                              (zero),    the curve fits  used theasdata
                                                                                      an estimation
                                                                                            perfectly, in parameter    of the variability
                                                                                                             the real world,    this wouldin
  the  samples.      When     the  RSE    is 0 (zero),    the   curve      fits  the  data
likely be due to overfitting. The RSE in this study becomes useful as a measure of variabilityperfectly,    in the real world,    thisin
                                                                                                                                       would
                                                                                                                                          the
  likely   be   due   to  overfitting.    The   RSE     in  this   study      becomes       useful
data, which can imply current draw variability in the actuation event of a POM. Thus, a high RSE valueas  a measure   of  variability   in the
  data,
for one which
          actuation  canevent
                          imply    current
                                 may   indicatedrawfaultvariability
                                                           occurrence     in when
                                                                              the actuation
                                                                                       compared     event
                                                                                                      to anofactuation
                                                                                                               a POM.withThus,    a highRSE
                                                                                                                               a lower     RSE
value. In this study, we used an arbitrary RSE threshold value of ≥0.3 to serve as a guide to indicate a
  value    for   one  actuation     event    may     indicate     fault    occurrence        when     compared     to an  actuation     with
  lower
error  in RSE      value. Insignal.
           the actuation       this study,     we used
                                        In practice      thisan  arbitrary
                                                              value     wouldRSE     needthreshold
                                                                                            to be setvalue     of ≥0.3 depending
                                                                                                        dynamically    to serve as on a guide
                                                                                                                                          the
  to indicate       error  in  the  actuation      signal.     In   practice       this   value    would
baseline value of each individual POM. For this study, a value of ≥0.3 was used across all instruments.      need  to be   set  dynamically
  depending on the baseline value of each individual POM. For this study, a value of ≥0.3 was used
  across all instruments.
Sensors 2020, 20, 2692                                                                                                               9 of 13
  Sensors 2020, 20, x FOR PEER REVIEW                                                                                                  9 of 14

      Figure 5. Linear curve fitted to the log10 transformations of the FFT analysis outputs for point-operating
        Figure 5. Linear curve fitted to the log10 transformations of the FFT analysis outputs for point-
      machine POM-1 in the NR direction.
        operating machine POM-1 in the NR direction.
4. Results
  4. Results
       In this section, we discuss the outcomes of the methodology described above, which is based on
         In this section,
the proposition        that anweabnormally
                                     discuss thefunctioning
                                                     outcomes ofPOM,    the methodology
                                                                                can be identifieddescribed
                                                                                                       from theabove,    which
                                                                                                                    current       is based
                                                                                                                               draw   signalon
  thethat
data    proposition
              it produces.that Identifying
                                an abnormally         functioning
                                                irregular    patterns,  POM,      can be identified
                                                                            are indicative     of likelyfrom
                                                                                                           signstheof current
                                                                                                                       wear ordraw      signal
                                                                                                                                  imminent
  data   that    it produces.     Identifying      irregular    patterns,      are indicative
failure [1]. The data used in this study are unlabeled data, here we compare actuation events fromof likely   signs   of wear    or imminent
  failure
POMs      that[1].have
                    The been
                          data processed
                                used in this   bystudy      are unlabeled
                                                    the method        described   data,
                                                                                     andhereshow we   compare
                                                                                                    how   potentialactuation     events from
                                                                                                                       fault occurrences
  POMs
can          that haveThese
     be identified.        been processed
                                    candidatesby      the method
                                                    would     then bedescribed
                                                                          flagged up    and
                                                                                          forshow
                                                                                               reviewhow and potential    fault occurrences
                                                                                                               investigation.
  canOurbe identified.      These     candidates      would     then    be   flagged     up  for  review
              feature extraction approach used traditional methods of mean current and max current draw    and    investigation.
that haveOurbeen  feature
                       usedextraction
                              and widely   approach
                                               reported    used    traditional
                                                             in other      studiesmethods         of mean current
                                                                                      [16]. Furthermore,                  and maxa current
                                                                                                                 we undertook          more
  draw that
specific    FFT have      been to
                    approach      used   and frequency
                                     extract    widely reporteddomaininfeatures
                                                                              other studies
                                                                                         which[16].
                                                                                                  wereFurthermore,
                                                                                                         transformed we     intoundertook
                                                                                                                                  the linear a
  more
form       specific
        before         FFT approach
                   calculating    the RSEtoofextract
                                                  the curvefrequency
                                                                fitted. The domain
                                                                                 RSE is features
                                                                                          used aswhich       were transformed
                                                                                                     an additional                    into of
                                                                                                                        feature as part     the
  linear
our         form before calculating the RSE of the curve fitted. The RSE is used as an additional feature as
     analysis.
  partToofdemonstrate
              our analysis.  the FFT approach, two examples of two different POMs are shown below. Figures 6
         To
and 7, show    demonstrate
                    the currentthe    FFTsignal
                                   draw    approach,       two examples of
                                                     of point-operating             two different
                                                                                 machine      POM-4POMs         are shown
                                                                                                        and POM-5              below. Figure
                                                                                                                         respectively.
  6 andFigureFigure     7, show
                   6 shows    two the      current
                                      actuation         drawfor
                                                     events      signal     of point-operating
                                                                    point-operating          machinemachine          POM-4 and
                                                                                                          POM-4 moving           in thePOM-5
                                                                                                                                         RN
  respectively.
direction recorded on the 2018-03-13 and 2018-05-17 (Figure 6A,B). Following the method proposed
above,Figure
          the RSE6 values
                       shows calculated
                                 two actuation from events
                                                       these two  for actuation
                                                                        point-operating        machine POM-4
                                                                                     events following        FFT log10 moving      in the RN
                                                                                                                           transformation
  direction
and              recorded
      linear curve           on the
                        fitting,       2018-03-13
                                   suggest    that the and   2018-05-17
                                                          actuation            (Figureat6A
                                                                         produced          theand   Figure
                                                                                                later        6B). Following
                                                                                                      date (Figure                the method
                                                                                                                        6) is indicative   of
  proposed         above,   the    RSE   values      calculated      from     these    two    actuation    events
potential failure or error. We can see from the highlighted areas (red ellipse) where the variability in the 10       following      FFT  log
  transformation
signal   occurs between   and linear
                                 the twocurve     fitting, suggest
                                            individual       events. that       the actuation
                                                                         Furthermore,              producederror
                                                                                             the potential       at the   later (Figure
                                                                                                                       signal    date (Figure
                                                                                                                                          6B)
  6) is  indicative     of  potential    failure    or  error.   We    can   see  from    the  highlighted
produces a higher RSE value of 0.256 (Figure 6C) compared to the earlier actuation, which produces a            areas   (red  ellipse)  where
  thevalue
RSE     variability
                of 0.092 in(Figure
                            the signal6D).occurs
                                            The fitted between
                                                            curve the      two individual
                                                                    of Figure      6C shows how   events.
                                                                                                        theFurthermore,         the potential
                                                                                                             FFT log10 transformation
oferror    signal (Figure
   the frequency                6B) produces
                        and magnitude          domaina higher      RSE value
                                                           data points,            of 0.256
                                                                              fit much    more (Figure
                                                                                                  closely6C)    compared
                                                                                                            to the             to the earlier
                                                                                                                     curve resulting     in a
  actuation,       which   produces      a RSE
much lower RSE value than that of Figure 6D.       value   of  0.092   (Figure     6D).   The   fitted curve    of  Figure   6C   shows   how
  theLikewise,
        FFT log10intransformation            of   the   frequency       and     magnitude      domain
                         Figure 7 we present the actuation events for point-operating machine POM-5 moving data    points,   fit  much   more
inclosely
    the NR    todirection,
                  the curve resulting
                               with the in       a much
                                             events         lower RSE
                                                        recorded       on twovalue   than that
                                                                                   separate        of Figure
                                                                                                dates.    Once6D.  again, we show the
variability in the actuation signals (Figure 7A,B) and the subsequent curve fitting following FFT log10
transformation (Figure 7C,D). The actuation event which results in a greater degree of variability
produces a higher RSE value of 0.288 (Figure 7D), compared to the event from an earlier date,
which produced a RSE value of 0.060 (Figure 7C).
Sensors 2020, 20, 2692                                                                                                                 10 of 13
Sensors 2020, 20, x FOR PEER REVIEW                                                                                                     10 of 14

       Figure 6.6. Actuation
      Figure       Actuation events
                               events of
                                      of point-operating
                                         point-operating machine
                                                            machine POM-4
                                                                       POM-4 inin the
                                                                                   the RN
                                                                                        RNdirection.
                                                                                             direction. The
                                                                                                        The events
                                                                                                              events are
                                                                                                                      are
      recorded   on  two separate  days—2018-03-13     (A) and 2018-05-17 (B)—with     their
       recorded on two separate days—2018-03-13 (A) and 2018-05-17 (B)—with their FFT log10  FFT  log10 transformation
      and  linear curveand
       transformation     fromlinear
                                each curve
                                     event from
                                            directly
                                                 eachbelow
                                                        event(C,D). Thebelow
                                                               directly red ellipse
                                                                               (C and(A,B)
                                                                                        D). highlights   the area
                                                                                             The red ellipse      of the
                                                                                                               (A and  B)
Sensors 2020,
      two     20, x FOR
           actuation    PEER that
                       events  REVIEW
                                   show   variability in the signal, which is reflected  in the  observed  RSE         11 of 14
                                                                                                                 values.
       highlights the area of the two actuation events that show variability in the signal, which is reflected
       in the observed RSE values.

       Likewise, in Figure 7 we present the actuation events for point-operating machine POM-5
 moving in the NR direction, with the events recorded on two separate dates. Once again, we show
 the variability in the actuation signals (Figure 7A and Figure 7B) and the subsequent curve fitting
 following FFT log10 transformation (Figure 7C and Figure 7D). The actuation event which results in
 a greater degree of variability produces a higher RSE value of 0.288 (Figure 7D), compared to the
 event from an earlier date, which produced a RSE value of 0.060 (Figure 7C).
       Similar observations are made throughout the dataset for other POMs where potential faults can
 be flagged using the method proposed. Interestingly, the signal profiles of point-operating machine
 POM-4 (Figure 6) are very different when compared visually to that of point-operating machine
 POM-5 (Figure 7). The areas of the actuation signal where variability is found is clearly not fixed
 between different POMs. We also observe that the max peak current for point-operating machine
 POM-4 for both the actuation events (Figure 6A and Figure 6B) is approximately 19 A. The same is
 observed for point-operating machine POM-5 (Figure 7A and Figure 7B). Therefore, we cannot
 exclusively rely on single events such as max peak current as error indicators. Thus, the method
 proposed in this study allows the entire signal to be processed accounting for instrument variation.
      Figure
      Figure
       For each 7. Actuation
                7.  Actuation
                    instrument    events
                                  events
                                      in theof
                                            of point-operating
                                               point-operating
                                               dataset, we have    machine
                                                                   machine     POM-5
                                                                               POM-5
                                                                        processed     thein  the
                                                                                             the NR
                                                                                                  NR direction.
                                                                                         inentirety     direction.    The events
                                                                                                                      The
                                                                                                         of the actuation   events    are
                                                                                                                                      are that
                                                                                                                                 events
      recorded
      recorded     on
                    ontwo   separate
                          two          days—2018-04-12
                                  separate     days—2018-04-12(A) and   2018-05-16
                                                                       (A)   and     (B)—with
                                                                                    2018-05-16    their   FFT
                                                                                                    (B)—with   log    transformation
                                                                                                                    their
                                                                                                                   10       FFT    log
 have been recorded. It is, therefore, possible to observe the RSE values for each of these events                                      10     to
      and   linear curveand
      transformation         from   eachcurve
                                 linear    eventfrom
                                                  directly
                                                        eachbelow
                                                               event(C,D).  Thebelow
                                                                      directly    red ellipse
                                                                                         (C  and (A,B)
                                                                                                   D).   highlights
                                                                                                        The   red      the area
                                                                                                                   ellipse   (A   of the
                                                                                                                                 and   B)
 produce a characteristic profile for a given machine. Plotting the RSE against time, for each
      two   actuation
      highlights    the events
                          area   ofthat
                                    the show
                                         two    variabilityevents
                                               actuation     in the signal,  which    is reflected   in signal,
                                                                                                         the observed     RSE   values.
 instrument      quickly      identifies    actuations     in the that    show
                                                                    instrument’s variability
                                                                                       timeline in the
                                                                                                    where         which
                                                                                                               it has      is reflected
                                                                                                                        potentially      failed
      in
 or about the  observed
              to fail.     RSE    values.
                        It also helps      identify    the baseline
      Similar    observations        are made      throughout      the RSE     value
                                                                         dataset   for for
                                                                                        otherany    givenwhere
                                                                                                 POMs        instrument.
                                                                                                                     potential  Tofaults
                                                                                                                                    illustrate
                                                                                                                                            can
 this point,
be flagged      two
                using  contrasting
                         the   method   examples
                                           proposed.  have     been   selected
                                                          Interestingly,    the  and
                                                                                 signal are   shown
                                                                                            profiles     in
                                                                                                        of  Figure     8 below.
                                                                                                           point-operating           It shows
                                                                                                                                   machine
      This again demonstrates that different POMs will all have their individual characteristics and
 the calculated
POM-4     (Figure     RSE
                     6)  are values     for point-operating
                               very different                        machines      POM-6      ofand    POM-3 plotted           sequentially.
therefore     a methodology           that can when       compared
                                                  be adaptive            visually
                                                                   is more          to that
                                                                               suited    to the   point-operating
                                                                                                   type of challenge     machine
                                                                                                                              addressedPOM-5  in
 From
(Figure  these    plots,   it  can   be   readily   observed      that   point-operating         machine
           7). The areas of the actuation signal where variability is found is clearly not fixed between       POM-6,       produced       RSE
this study.
 values that
different        are very
             POMs.      We      consistent
                              also   observetothatonethe another
                                                            max     (1943current
                                                                   peak     actuations).       This RSE value, of approximately
      Interestingly,       point-operating        machine       POM-3,     resultedfor in point-operating
                                                                                           two RSE values machine  of ≥0.3, whichPOM-4       for
                                                                                                                                         is the
 0.04,the
both   seems     to be the
           actuation      eventsbaseline
                                    (Figure value
                                               6A,B)(red
                                                       is  line) for this machine.
                                                          approximately       19 A.   The  In  contrast,
                                                                                            same    is      point-operating
                                                                                                       observed      for             machine
                                                                                                                          point-operating
threshold value used in this study to indicate potential fault via the methodology proposed.
 POM-3, produced
machine      POM-5          RSE values        that  were much        less consistent      (1674 actuations),          but nevertheless     maxa
      In line    with (Figure
                         the more    7A,B).    Therefore,
                                       conventional           we cannot
                                                           approaches      ofexclusively
                                                                               signal faultrely      on single
                                                                                                 detection,      twoevents    such as
                                                                                                                        additional      useful
 baseline
peak         value
       current        of  approximately         0.90  could    be inferred.
features    wereasextracted
                      error indicators.
                                   from ourThus,      the method
                                                actuation              proposed
                                                             signal data;     1) Thein maximum
                                                                                        this study allows
                                                                                                        currentthe drawentire   signal
                                                                                                                            (peak         to be
                                                                                                                                     current)
processed
of the push-outaccounting
                       phasefor  and instrument
                                       2) The mean   variation.
                                                          current draw of the swing phase. We can use these features
to validate our methodology proposed in this study. Plotting the mean current, the peak current and
the RSE on a scatter plot produces some interesting trends between different POMs.
      To illustrate this, two examples have been selected on the basis that their processed actuation
events resulted in at least one RSE value of ≥0.3. We selected such instruments so that a plot of the
peak current (push-out phase) against the mean current (swing phase) of the actuation events could
transformation and linear curve from each event directly below (C and D). The red ellipse (A and B)
      highlights the area of the two actuation events that show variability in the signal, which is reflected
      in the observed RSE values.

      This again demonstrates that different POMs will all have their individual characteristics and
Sensors 2020, 20, 2692                                                                                            11 of 13
therefore a methodology that can be adaptive is more suited to the type of challenge addressed                          in
this study.
      Interestingly,
      For               point-operating
           each instrument                 machine
                                 in the dataset,      POM-3,
                                                 we have        resultedthe
                                                            processed       in entirety
                                                                               two RSEof values   of ≥0.3, which
                                                                                           the actuation    eventsisthat
                                                                                                                      the
threshold
have   been value    used It
              recorded.     inis,
                               this study to possible
                                  therefore, indicate potential
                                                        to observe  fault
                                                                       the via
                                                                           RSEthe  methodology
                                                                                 values  for each proposed.
                                                                                                    of these events to
produce a characteristic profile for a given machine. Plotting the RSE against time, foradditional
      In  line  with  the  more    conventional   approaches     of  signal  fault detection,   two               useful
                                                                                                      each instrument
features   were   extracted   from   our actuation  signal  data;  1)  The  maximum     current   draw  (peak
quickly identifies actuations in the instrument’s timeline where it has potentially failed or about to fail.    current)
ofalso
It  the push-out    phasethe
        helps identify       and   2) The RSE
                                baseline  meanvalue
                                                 current
                                                       for draw   of theinstrument.
                                                           any given      swing phase.  ToWe    can usethis
                                                                                            illustrate   these  features
                                                                                                             point,  two
to  validate  our  methodology       proposed   in this study.  Plotting    the mean   current,
contrasting examples have been selected and are shown in Figure 8 below. It shows the calculated the peak   current  and
the  RSE   on  a scatter  plot  produces  some    interesting  trends    between   different
RSE values for point-operating machines POM-6 and POM-3 plotted sequentially. From these plots,POMs.
it canTo
       beillustrate    this, twothat
            readily observed       examples  have beenmachine
                                       point-operating     selectedPOM-6,
                                                                       on the basis  that their
                                                                                produced          processed
                                                                                            RSE values    thatactuation
                                                                                                                are very
events   resulted   in  at least  one  RSE value   of ≥0.3. We   selected    such  instruments
consistent to one another (1943 actuations). This RSE value, of approximately 0.04, seems         so that  a plot  of the
                                                                                                               to be  the
peak current
baseline    value(push-out
                   (red line)phase)    against
                                for this       the mean
                                         machine.          currentpoint-operating
                                                     In contrast,     (swing phase) ofmachine
                                                                                          the actuation
                                                                                                   POM-3, events   could
                                                                                                              produced
be  differentiated    by  RSE.
RSE values that were much less consistent (1674 actuations), but nevertheless a baseline value of
approximately 0.90 could be inferred.

      Figure 8.
      Figure  8. Sequential RSE
                            RSE values
                                 values plots
                                        plots for
                                               for point-operating
                                                   point-operatingmachine
                                                                     machinePOM-6 (n== 1943)
                                                                            POM-6(n    1943)and
                                                                                             andPOM-3 (n==
                                                                                                POM-3(n
      1674). Possible
      1674). Possible baseline
                      baseline for
                               for each
                                   each instrument
                                        instrument shown
                                                      shown in
                                                             in red.
                                                                 red.

      This again demonstrates that different POMs will all have their individual characteristics and
therefore a methodology that can be adaptive is more suited to the type of challenge addressed in
this study.
      Interestingly, point-operating machine POM-3, resulted in two RSE values of ≥0.3, which is the
threshold value used in this study to indicate potential fault via the methodology proposed.
      In line with the more conventional approaches of signal fault detection, two additional useful
features were extracted from our actuation signal data; 1) The maximum current draw (peak current)
of the push-out phase and 2) The mean current draw of the swing phase. We can use these features to
validate our methodology proposed in this study. Plotting the mean current, the peak current and the
RSE on a scatter plot produces some interesting trends between different POMs.
      To illustrate this, two examples have been selected on the basis that their processed actuation
events resulted in at least one RSE value of ≥0.3. We selected such instruments so that a plot of the
peak current (push-out phase) against the mean current (swing phase) of the actuation events could be
differentiated by RSE.
      Figure 9 shows a scatter chart for point-operating machine POM-3 and POM-7. The peak current
(A) of the push-out phase is plotted against the mean current (A) of the swing phase, with the data
points colored (red or blue) according to their RSE value. Again, we see that the pattern of the scatter
plots for the two POMs are quite different. Point-operating machine POM-7 contains data that is much
more tightly clustered together and generally of higher peak current and mean current values than
that of point-operating machine POM-3. What we do see in common however is the locations of the
data points of RSE value ≥0.3. For both point-operating instruments, the data points which meet the
threshold of RSE ≥0.3 are pushed out to the right of the major cluster.
plots for the two POMs are quite different. Point-operating machine POM-7 contains data that is
 much more tightly clustered together and generally of higher peak current and mean current values
 than that of point-operating machine POM-3. What we do see in common however is the locations of
 the data points of RSE value ≥0.3. For both point-operating instruments, the data points which meet
 the threshold of RSE ≥0.3 are pushed out to the right of the major cluster.
Sensors 2020, 20, 2692                                                                                    12 of 13

       Figure9.9.Mean
      Figure      Meancurrent
                       currentagainst
                               againstPeak
                                        Peakcurrent
                                              currentofofactuation
                                                          actuationsignal
                                                                     signaldata
                                                                            datafor
                                                                                  forpoint-operating
                                                                                      point-operatingmachine
                                                                                                      machine
      POM-3
       POM-3andandPOM-7.
                   POM-7.Data
                           Datapoints
                                pointsofofRSE  values≥0.3
                                           RSEvalues        (red),
Sensors 2020, 20, 2692                                                                                          13 of 13

Author Contributions: The work described in this article is a collaborative effort from all the authors.
Conceptualisation, P.M., P.L., and P.A.; Data Curation, P.M.; Formal Analysis, P.M.; Investigation, P.M., P.L., and
P.A.; Methodology, P.M., P.L., and P.A.; Software, P.M.; Validation, P.M.; Visualisation, P.M.; Preparing draft, review
& editing, P.M., and P.A. All authors have read and agreed to the published version of the manuscript.
Funding: This research received no external funding.
Acknowledgments: The authors would like to thank Fiona Lynch, Network Rail, UK, for supplying the dataset
for this study.
Conflicts of Interest: The authors declare no conflict of interest.

References
1.    Sa, J.; Choi, Y.; Chung, Y.; Kim, H.-Y.; Park, D.; Yoon, S. Replacement Condition Detection of Railway Point
      Machines Using an Electric Current Sensor. Sensors 2017, 17, 263. [CrossRef] [PubMed]
2.    Márquez, F.P.; Schmid, F.; Collado, J.C. A reliability centered approach to remote condition monitoring.
      A railway points case study. Reliab. Eng. Syst. Saf. 2003, 80, 33–40. [CrossRef]
3.    Vileiniskis, M.; Remenyte-Prescott, R.; Rama, D. A fault detection method for railway point systems. Proc. Inst.
      Mech. Eng. Part F J. Rail Rapid Transit 2015, 230, 852–865. [CrossRef]
4.    Alwadie, A. The Decision making System for Condition Monitoring of Induction Motors Based on Vector
      Control Model. Machines 2017, 5, 27. [CrossRef]
5.    García Márquez, F.P.; Roberts, C.; Tobias, A.M. Railway point mechanisms: Condition monitoring and fault
      detection. Proc. Inst. Mech. Eng. Part F J. Rail Rapid Transit 2009, 224, 35–44. [CrossRef]
6.    Bolbolamiri, N.; Sanai, M.S.; Mirabadi, A. Time-domain stator current condition monitoring: Analyzing point
      failures detection by Kolmogorov-Smirnov (KS) test. Int. J. Electr. Comput. Energ. Electron. Commun. Eng.
      2012, 6, 587–592.
7.    McHutchon, M.A.; Staszewski, W.J.; Schmid, F. Signal Processing for Remote Condition Monitoring of
      Railway Points. Strain 2005, 41, 71–85. [CrossRef]
8.    Atamuradov, V.; Medjaher, K.; Camci, F.; Dersin, P.; Zerhouni, N. Railway Point Machine Prognostics Based
      on Feature Fusion and Health State Assessment. IEEE Trans. Instrum. Meas. 2018, 68, 2691–2704. [CrossRef]
9.    Bian, C.; Yang, S.; Huang, T.; Xu, Q.; Liu, J.; Zio, E. Degradation detection method for railway point machines.
      arXiv 2018, arXiv:1809.02349.
10.   Eker, Ö.; Camci, F.; Kumar, U. SVM Based Diagnostics on Railway Turnouts. Int. J. Perform. Eng. 2012, 8,
      289–298.
11.   Asada, T.; Roberts, C.; Koseki, T. An algorithm for improved performance of railway condition monitoring
      equipment: Alternating-current point machine case study. Transp. Res. Part C Emerg. Technol. 2013, 30, 81–92.
      [CrossRef]
12.   García, F.P.; Pedregal, D.J.; Roberts, C. Time series methods applied to failure prediction and detection. Reliab.
      Eng. Syst. Saf. 2010, 95, 698–703. [CrossRef]
13.   Mistry, P.; Lane, P.; Allen, P.; Al-Aqrabi, H.; Hill, R. Condition Monitoring of Motorised Devices for Smart
      Infrastructure Capabilities. In Smart City and Informatization; Springer: Singapore, 2019; pp. 392–403.
14.   Knime. Available online: https://www.knime.com/ (accessed on 20 February 2020).
15.   R. Available online: https://www.r-project.org/ (accessed on 20 February 2020).
16.   Chamroukhi, F.; Same, A.; Aknin, P.; Antoni, M. Switch mechanism diagnosis using a pattern recognition
      approach. In Proceedings of the 2008 4th IET International Conference on Railway Condition Monitoring,
      Derby, UK, 18–20 June 2008; pp. 1–4.
17.   Cochran, W.T.; Cooley, J.W.; Favin, D.L.; Helms, H.D.; Kaenel, R.A.; Lang, W.W.; Maling, G.C.; Nelson, D.E.;
      Rader, C.M.; Welch, P.D. What is the fast Fourier transform? Proc. IEEE 1967, 55, 1664–1674. [CrossRef]
18.   Oberst, U. The Fast Fourier Transform. SIAM J. Control Optim. 2007, 46, 496–540. [CrossRef]

                         © 2020 by the authors. Licensee MDPI, Basel, Switzerland. This article is an open access
                         article distributed under the terms and conditions of the Creative Commons Attribution
                         (CC BY) license (http://creativecommons.org/licenses/by/4.0/).
You can also read