WHOLESALE ELECTRICITY COSTS FOR 2021 - A DRAFT REPORT FOR THE ESSENTIAL SERVICES COMMISSION - Essential ...
←
→
Page content transcription
If your browser does not render page correctly, please read the page content below
WHOLESALE ELECTRICITY COSTS
                    FOR 2021
    A DRAFT REPORT FOR THE ESSENTIAL SERVICES
                                  COMMISSION

                                  27 AUGUST 2020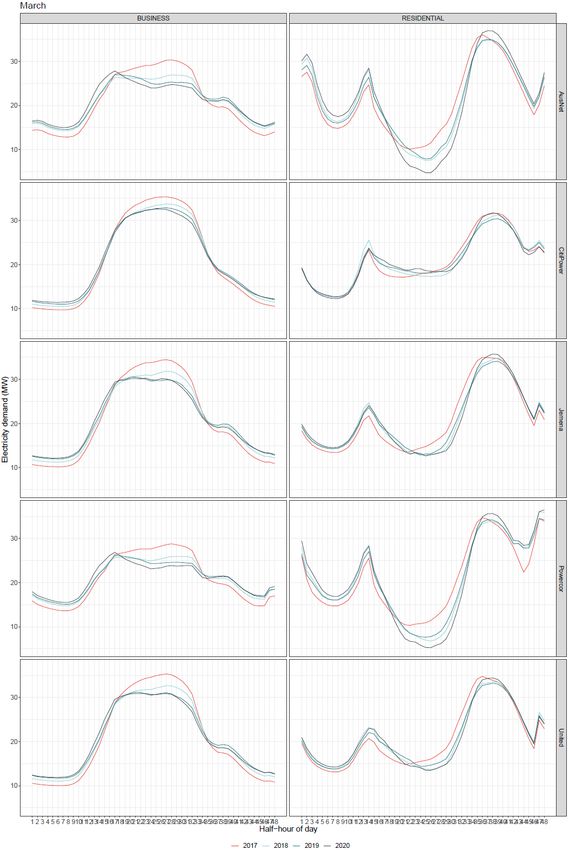
Wholesale electricity costs                                                                            1

Frontier Economics Pty Ltd is a member of the Frontier Economics network, and is headquartered in
Australia with a subsidiary company, Frontier Economics Pte Ltd in Singapore. Our fellow network
member, Frontier Economics Ltd, is headquartered in the United Kingdom. The companies are
independently owned, and legal commitments entered into by any one company do not impose any
obligations on other companies in the network. All views expressed in this document are the views of
Frontier Economics Pty Ltd.

Disclaimer

None of Frontier Economics Pty Ltd (including the directors and employees) make any representation
or warranty as to the accuracy or completeness of this report. Nor shall they have any liability (whether
arising from negligence or otherwise) for any representations (express or implied) or information
contained in, or for any omissions from, the report or any written or oral communications transmitted in
the course of the project.

frontier economics                                                                               DRAFT
Wholesale electricity costs                                                            0

CONTENTS
1         Introduction                                                                  4
1.1       Background                                                                    4
1.2       Frontier Economics’ engagement                                                4
1.3       This draft report                                                             4
1.4       Previous advice to the ESC                                                    4

2         Approach to assessing WEC                                                     6

3         Half-hourly spot prices and half-hourly load                                  8
3.1       Historical data on half-hourly price and load                                 8
3.2       Selecting appropriate historical data                                         9
3.3       Projecting half-hourly load and spot prices                                 16

4         Contract prices                                                             24

5         Contract position                                                           30

6         Wholesale electricity costs                                                 42
6.1       Wholesale electricity costs                                                 42
6.2       Volatility allowance                                                        49

7         LRET and SRES                                                               50
7.1       LRET                                                                        50
7.2       SRES                                                                        51

A         Analysis of impact of COVID-19 on load                                      53

Tables
Table 1: 12-month trade weighted average ASXEnergy derivative prices for Victoria      26

Table 2: Modelled market-based wholesale electricity cost result                       42

Table 3: Modelled volatility allowance                                                 49

Figures
Figure 1: Load factor for residential customers                                        10

Figure 2: Load factor for business customers                                           10

frontier economics                                                                  DRAFT
Wholesale electricity costs

Figure 3: Average daily profile for residential customers                                           11
Figure 4: Average daily profile for business customers                                              11

Figure 5: Average daily profile for Victorian spot prices                                           12

Figure 6: Load premium for residential customers, based on Victorian spot prices                    13
Figure 7: Load premium for business customers, based on Victorian spot prices                       13

Figure 8: Quarterly patterns of spot prices and ASXEnergy prices                                    15

Figure 9: Peak/off-peak patterns of spot prices and ASXEnergy prices                                15
Figure 10: Distribution of load-weighted price for simulate d years for residential and business load –
CitiPower                                                                                            19
Figure 11: Distribution of load-weighted price for simulated years for residential and business load –
Powercor                                                                                            20

Figure 12: Distribution of load-weighted price for simulated years for residential and business load –
AusNet                                                                                              21

Figure 13: Distribution of load-weighted price for simulated years for residential and business load –
United                                                                                              22
Figure 14: Distribution of load-weighted price for simulated years for residential and business load –
Jemena                                                                                              23

Figure 15: Victorian base swaps – open interest, prices and volumes for calendar year 2021          27

Figure 16: Victorian peak swaps – open interest, prices and volumes for calendar year 2021          28

Figure 17: Victorian base $300 caps – open interest, prices and volumes for calendar year 2021      29

Figure 18: Contract position for CitiPower residential load, ASXEnergy contract prices, calendar year
2021 (2020 dollars)                                                                                32

Figure 19: Contract position for Powercor residential load, ASXEnergy contract prices, calendar year
2021 (2020 dollars)                                                                               33

Figure 20: Contract position for Jemena residential load, ASXEnergy contract prices, calendar year
2021 (2020 dollars)                                                                             34

Figure 21: Contract position for AusNet residential load, ASXEnergy contract prices, calendar year 2020
(2021 dollars)                                                                                       35
Figure 22: Contract position for United residential load, ASXEnergy contract prices, calendar year 2020
(2021 dollars)                                                                                       36
Figure 23: Contract position for CitiPower business load, ASXEnergy contract prices, calendar year
2021 (2020 dollars)                                                                             37

Figure 24: Contract position for PowerCor business load, ASXEnergy contract prices, calendar year
2021 (2020 dollars)                                                                            38

Figure 25: Contract position for Jemena business load, ASXEnergy contract prices, calendar year 2021
(2020 dollars)                                                                                    39
Figure 26: Contract position for AusNet business load, ASXEnergy contract prices, calendar year 2021
(2020 dollars)                                                                                    40

                                                                                                DRAFT
frontier economics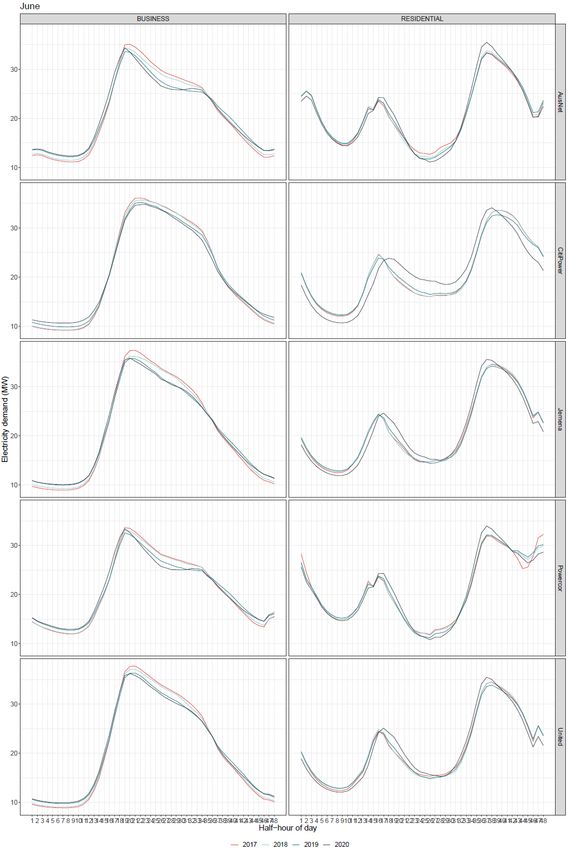
Wholesale electricity costs
Figure 27: Contract position for United business load, ASXEnergy contract prices, calendar year 2021
(2020 dollars) 41
Figure 28: CitiPower load wholesale electricity cost distribution 44
Figure 29: Powercor load wholesale electricity cost distribution 45
Figure 30: AusNet load wholesale electricity cost distribution 46
Figure 31: United load wholesale electricity cost distribution 47
Figure 32: Jemena load wholesale electricity cost distribution 48
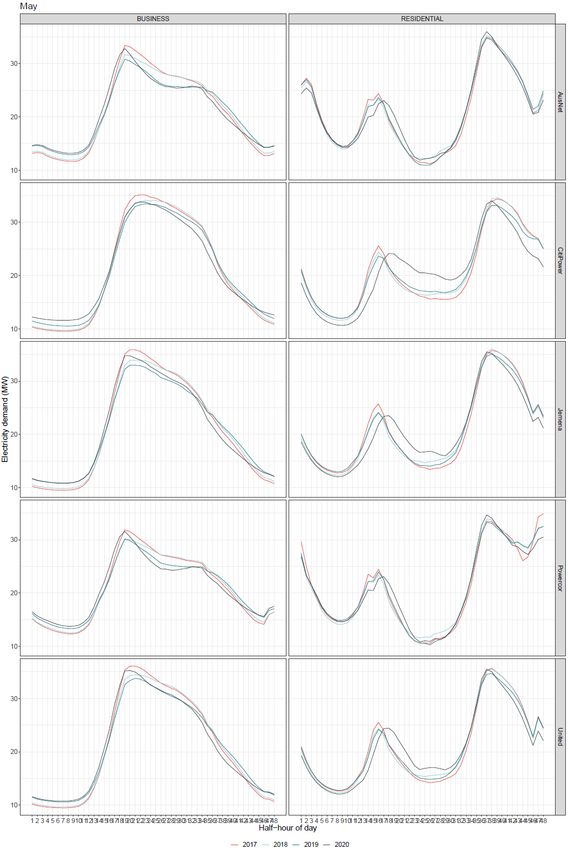
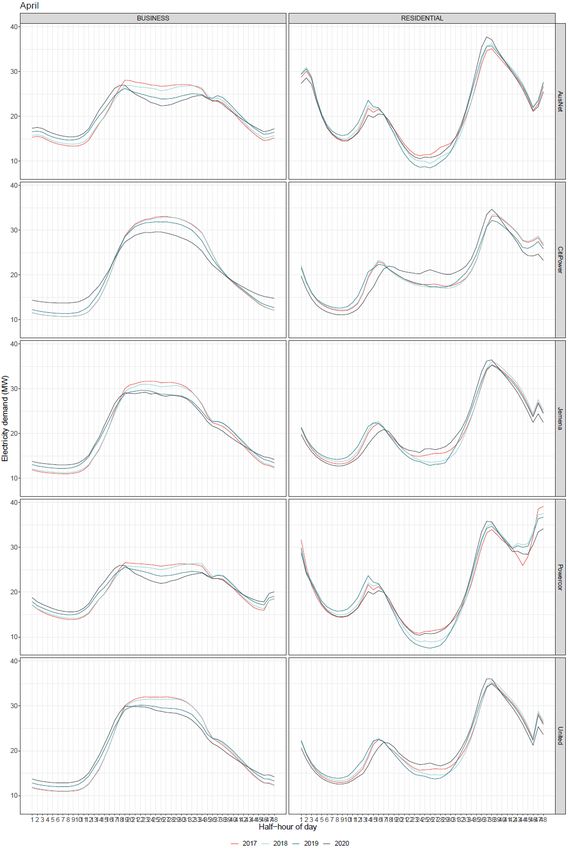
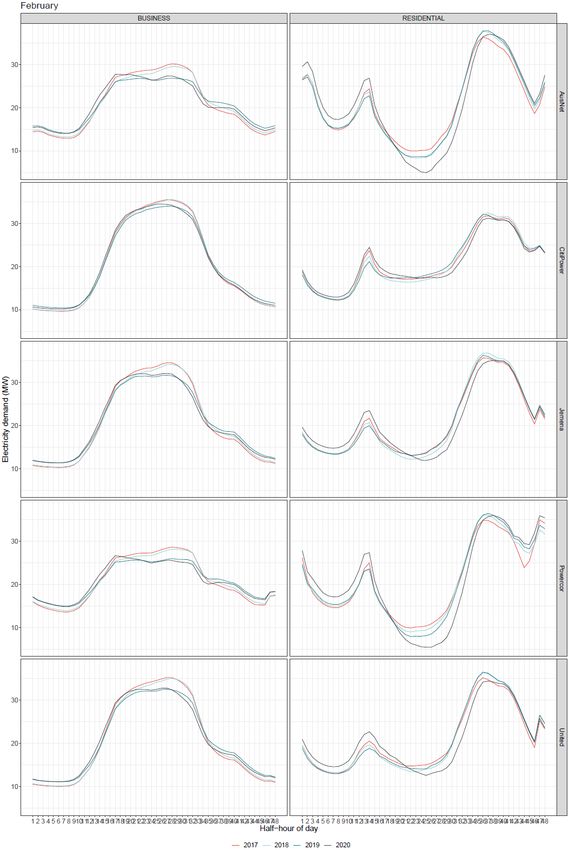
Figure 33: Average weekday consumption – February 55
Figure 34: Average weekday consumption – March 56
Figure 35: Average weekday consumption – April 57
Figure 36: Average weekday consumption – May 58
Figure 37: Average weekday consumption – June 59
Figure 38: Average weekday load shape – February 60
Figure 39: Average weekday load shape – March 61
Figure 40: Average weekday load shape – April 62
Figure 41: Average weekday load shape – May 63
Figure 42: Average weekday load shape – June 64
DRAFT
frontier economics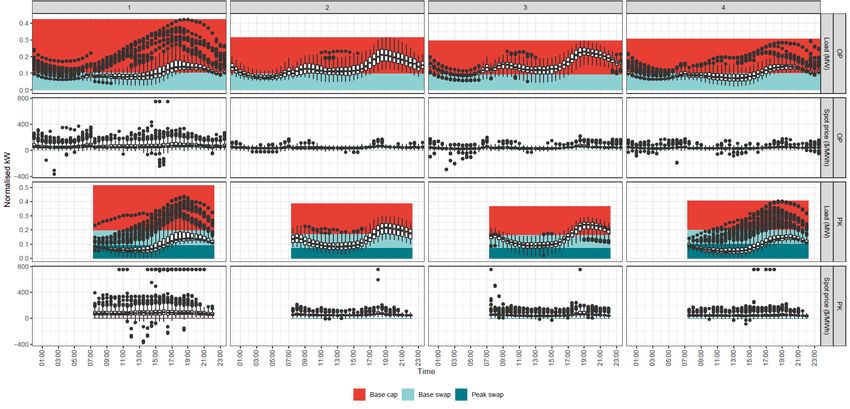
Wholesale electricity costs                                                                                                    4

1 INTRODUCTION
Frontier Economics has been engaged to advise the Essential Services Commission (ESC) on
allowances for wholesale electricity costs for calendar year 2021 for retailing electricity to small
customers, for the purposes of determining the Victorian Default Offer (VDO).

1.1         Background

The ESC is required to determine prices for the VDO to apply from 1 January 2021. To inform this the
ESC needs forecasts of retailers’ wholesale electricity costs and of retailers’ costs of complying with
environmental programs for calendar year 2021.

1.2         Frontier Economics’ engagement

Frontier Economics has been engaged by the ESC to provide advice on two aspects of the VDO:
• The wholesale electricity cost (WEC) component of retailers’ cost to supply small customers from
  1 January 2021.
• The retailers’ costs of complying with the Large-scale Renewable Energy Target (LRET) and the
  Small-scale Renewable Energy Scheme (SRES) in supplying small customers from 1 January 2021.

1.3         This draft report

This draft report sets out our advice to the ESC on the WEC and costs of complying with the LRET and
the SRES, for retailers in each of the five Victorian distribution network areas. This report is structured
as follows:
• Section 2 provides an overview of the approach used to estimate wholesale energy costs.
• Section 3 discusses the half-hourly prices and half-hourly load used in our analysis.
• Section 4 discusses the contract prices used in our analysis.
• Section 5 discusses the assumed contract position.
• Section 6 provides our estimate of the WEC.
• Section 7 provides our estimates of the costs of complying with the LRET and SRES.

In addition to this report, we also provide spreadsheets setting out details of half-hourly load and price
forecasts, contract positions resulting from our modelling, and calculations for determining the WEC.

1.4         Previous advice to the ESC

Frontier Economics has previously advised the ESC on the WEC and the cost of complying with the
LRET and the SRES for financial year 2019/20 and calendar year 2020.1 This draft report adopts

1
           Frontier Economics, Wholesale Electricity Costs, A report for the Essential Services Commission, 24 April 2019.
Available on the ESC’s website: https://www.esc.vic.gov.au/electricity-and-gas/inquiries-studies-and-reviews/electricity-and-gas-
retail-markets-review-implementation-2018/electricity-and-gas-retail-markets-review-implementation-2018-victorian-default-
offer#tabs-container2      and       https://www.esc.vic.gov.au/sites/default/files/documents/OTH%20-%20VDO%202020%20-
%20Final%20wholesale%20electricity%20and%20enviro%20costs%20for%20final%20decision%2020191112.PDF

frontier economics                                                                                                      DRAFT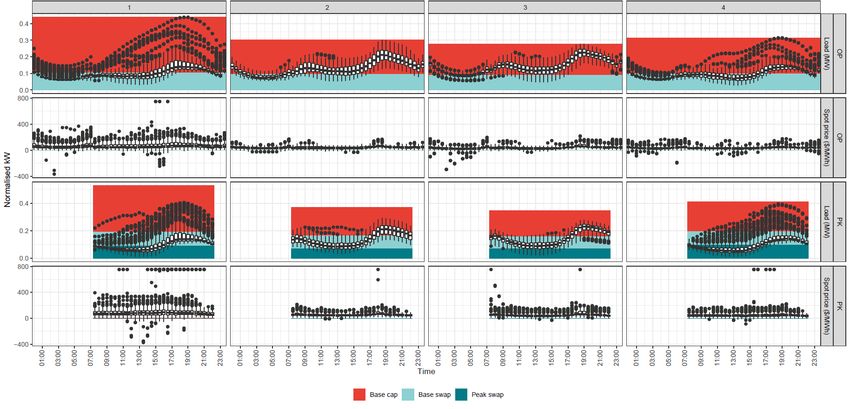
Wholesale electricity costs                                                                      5

substantially the same approach for estimating WEC and the costs of complying with the LRET and the
SRES for 2021 as we previously adopted for 2020.

frontier economics                                                                          DRAFT
Wholesale electricity costs                                                                                6

2 APPROACH TO
ASSESSING WEC
Under the settlement rules in the National Electricity Market (NEM), retailers are responsible for
purchasing electricity to meet the load of their customers in the wholesale electricity market. A retailer
will pay, for each half hour, its customer’s electricity load in that half-hour multiplied by the relevant
regional reference price from the wholesale electricity spot market for that half hour. For customers in
Victoria, the relevant regional reference price is the Victorian regional reference price.

These settlement payments that retailers face can be extremely volatile. Electricity load for small
customers can vary significantly from one half hour to the next, and electricity spot prices can be
anywhere between the Market Price Cap (which for 2020/21 is $15,000/MWh) and the market floor price
(which is -$1,000/MWh).2 Since retailers will typically commit to supply their customers at a specified
retail price for a period of time, this volatility in settlement payments can result in retailers paying more
for electricity than they receive for that electricity through the retail price they have agreed with their
customers. At worst, this exposes the retailers to the risk of financial failure.

To manage the risks associated with volatile load and spot prices, retailers will typically seek to hedge
their exposure to spot prices by entering into hedging arrangements. There are a number of ways that
retailers can hedge their exposure to spot prices. The most common are the following:
• Vertical integration through ownership of an electricity generator. A retailer that owns a generator
  has what is known as a natural hedge: when the spot price is high, the retailer will have to pay the
  high spot price for its customer’s load but, as the owner of a generator, will also receive the high spot
  price for its electricity generation.
• Power purchase agreements with a generator. Power purchase agreements provide a similar
  hedging benefit to vertical integration, but they do so through contractual arrangements between a
  retailer and a generator, rather than through ownership.
• Financial derivatives. There are a range of financial derivatives that are available to retailers (and
  generators) to hedge their exposure to volatile spot prices. The most common are swap contracts
  (which effectively lock-in a spot price for the counterparties) and cap contracts (which effectively cap
  the spot price for a retailer). These are traded both on the stock exchange and over-the-counter
  between participants.

Retailers’ energy purchase costs are typically taken to be the average cost to a retailer of purchasing
electricity from the wholesale market for its customers, taking into account both the retailer’s settlement
payments to the Australian Energy Market Operator (AEMO) and the financial outcomes from the
retailer’s hedging arrangements.

Regulatory practice in Australia has typically focused on estimating the energy purchase cost for a
benchmark retailer. In doing so, regulators have typically assumed that the benchmark retailer will make
use of exchange-traded financial derivatives to hedge its exposure to spot prices. The assumption that
a benchmark retailer will use exchange-traded financial derivatives is typically based on the following
reasoning:
• Any retailer of a reasonable size should be able to hedge its exposure to wholesale spot prices using
  exchange-traded financial derivatives, while vertical integration and entering power purchase

2
        AEMC, Schedule of reliability settings, 20 February 2020

frontier economics                                                                                   DRAFT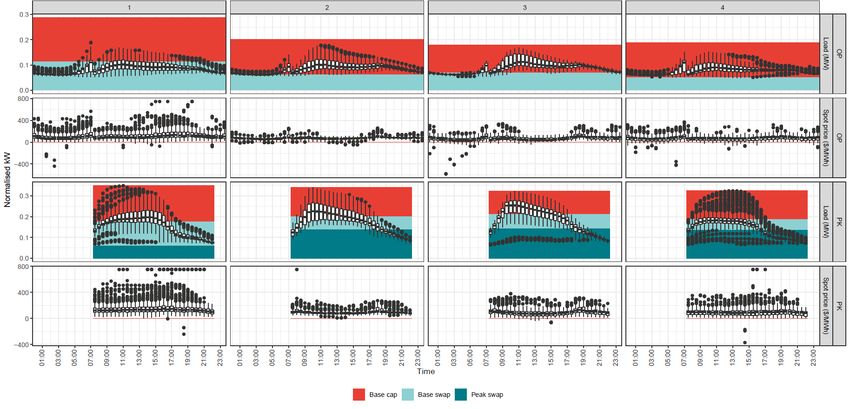
Wholesale electricity costs                                                                                   7

   agreements can be impractical for retailers with a smaller retail position in a market or with a less
   certain retail position.
• Prices for exchange-traded financial derivatives are transparent, since they are traded on the ASX.
  In contrast, the costs of building generation plant or entering into power purchase agreements is less
  transparent.

In practice, it is clear that retailers in the NEM do adopt a mix of hedging strategies, including vertical
integration and power purchase agreements. Retailers will presumably vertically integrate or enter into
power purchase agreements because they think these strategies offer advantages that financial
derivatives cannot; by excluding vertical integration and power purchase agreements from
consideration, therefore, regulators will, if anything, tend to overstate the costs that retailers will face, or
understate the risk management that retailers can achieve.
We follow this typical approach of assessing the WEC that retailers face based on an estimate of the
cost that a prudent retailer would face in supplying electricity to their customers, having regard to the
hedging contracts that a prudent retailer is likely to enter into. The hedging contracts that we base this
analysis on are quarterly base swaps, peak swaps and base caps, traded on ASXEnergy.

To estimate WEC in this way, we need to answer four questions:
• What is the expected half-hourly load of the retailer’s customers?
• What are the expected half-hourly spot prices that retailers will face?
• What is the cost of financial hedging contracts?
• What kind of hedging position is a prudent retailer likely to adopt?

From the answers to these questions we can calculate the WEC that a retailer would face.

We address these questions in the sections that follow.

frontier economics                                                                                      DRAFT
Wholesale electricity costs                                                                              8

3 HALF-HOURLY SPOT
PRICES AND HALF-
HOURLY LOAD
This section addresses the first two questions we need to answer to estimate WEC:
• What is the expected half-hourly load of the retailer’s customers?
• What are the expected half-hourly spot prices that retailers will face?

We deal with these questions together because we believe it is important to forecast half-hourly spot
prices and half-hourly load in a way that accounts for the correlation between prices and load. After all,
this correlation is a key driver of the risks that retailers face.

3.1       Historical data on half-hourly price and load

Our modelling of the WEC requires projections of half-hourly spot prices in Victoria and customer load
to be supplied by retailers in Victoria.

In our view, the best source of data about half-hourly patterns of spot prices, half-hourly patterns of
customer load, and the correlation between the two, is historical data. The historical data on prices and
load will reflect all of the complex factors that drive both spot prices and customer load, and the
interactions between them, which are difficult to accurately capture at the half-hourly level using
forecasting models. These historical data on prices and load can then be scaled to account for any
trends in prices and load over the forecast period.

The historical data that we use is:
• For prices, the half-hourly spot prices for the Victorian regional reference node, as published by
  AEMO.
• For customer load, half-hourly load data that AEMO has directly provided to the ESC on customers
  with annual consumption less than 40MWh for each of the five distribution network areas in Victoria.
  AEMO has provided separate half-hourly load data for residential customers with annual
  consumption less than 40MWh and for business customers with annual consumption less than
  40MWh.

We use this data directly provided by AEMO because it closely coincides with the customer groups to
which the VDO will apply:
• For residential customers, the VDO will apply to all residential customers. The data provided by
  AEMO is only for residential customers with annual consumption less than 40MWh, but since very
  few residential customers will have annual consumption greater than 40MWh this is unlikely to make
  a material difference to the estimated WEC.
• For small business customers, the VDO will apply to small business customers, with small business
  customers defined as customers with aggregate consumption less than 40 MWh per annum. The
  data provided by AEMO aligns with the applicability of the VDO.

In contrast, the Manually Read Interval Meter (MRIM) data that is publicly available from AEMO includes
aggregated half-hour electricity consumption for all type 5 meters in each of the five distribution network

frontier economics                                                                                 DRAFT
Wholesale electricity costs                                                                              9

areas in Victoria. This includes a mix of residential and business customers with annual consumption
up to 160MWh.

3.2       Selecting appropriate historical data

When using historical data on prices and load in this way, a useful starting point is to choose data on
prices and load from an historical period that we think is likely to be most consistent with the forecast
period. For example, the closure of coal-fired power stations may have substantial impacts on price
levels and volatility. Likewise, the increasing adoption of rooftop solar PV is likely to materially affect
load factors and prices over time.

The data that is directly provided by AEMO is for 2016/17, 2017/18, 2018/19 and 2019/20. Ideally, we
would have a longer time series of data. If the price and load data for this longer time series were
deemed likely to be a reasonable indication of outcomes for the forecast period, then the longer series
of data would likely include a broader range of potential market outcomes that could be captured in our
Monte Carlo analysis (discussed in Section 3.3). However, in our view, the benefit of having more recent
data, and load data that better matches the customers to which the VDO will apply, clearly suggests the
data directly provided by AEMO is preferable to the longer set of publicly available MRIM data.
Analysis of data

Figure 1 shows the annual load factor for the residential data for each Victorian DNSP for the last four
financial years. We can see that there is a slight drop in load factor for every DNSP from 2016/17 to
2017/18, but since then the load factor has been relatively consistent.

Figure 2 shows the annual load factor for business data for each Victorian DNSP for the last four
financial years. We can see that there was a slight increase in the load factor from 2016/17 to 2017/18
for AusNet and Powercor, but that on the whole the load factors have remained relatively steady.

Figure 3 and Figure 4 show the average daily profile for residential and business customers
respectively for each Victorian DNSP for the last four financial years, normalised to the same annual
consumption to highlight differences in the timing of daily consumption. These profiles are almost
identical between years, with only slight relative reductions in load during the day for residential and
business customers in some network areas.
In addition to analysing the load data on an annual basis, we have also analysed data for 2020 on a
weekly and monthly basis, and compared it with data from the previous years, to assess whether our
response to COVID-19 has affected consumption. We found reasonable evidence that total
consumption has changed as a result of our response to COVID-19 for each DNSP and each customer
type; the evidence suggests that aggregate consumption for residential customers has increased and
aggregate consumption for small business customers has decreased, but only from April onwards.
There was not the same evidence of a consistent change in the average daily profile for each DNSP
and each customer type. Given that it is the profile of consumption that drives the WEC, rather than
aggregate consumption, we have not attempted to adjust the load profile for any assumed ongoing
impact of COVID-19 in 2021. Our analysis of the impact of COVID-19 on load is summarised in Appendix
A.

frontier economics                                                                                 DRAFT
Wholesale electricity costs                           10

Figure 1: Load factor for residential customers

Source: Frontier Economics analysis of AEMO data

Figure 2: Load factor for business customers

Source: Frontier Economics analysis of AEMO data

frontier economics                                 DRAFT
Wholesale electricity costs                                    11

Figure 3: Average daily profile for residential customers

Source: Frontier Economics analysis of AEMO data

Figure 4: Average daily profile for business customers

Source: Frontier Economics analysis of AEMO data

frontier economics                                          DRAFT
Wholesale electricity costs                                                                                   12

Figure 5 shows the average daily profile for Victorian spot prices for the last four financial years. It is no
surprise to see that there is greater volatility in daily patterns of spot prices than there is in daily patterns
of customer load. However, in each case we do see similar patterns of low overnight prices, a price
spike tending to occur in the morning, and further high prices tending to occur in the mid-afternoon to
evening. The spot price data for 2019/20 shows that higher prices persisted for longer and higher in the
evening in 2019/20 than they did in previous financial years.

Figure 5: Average daily profile for Victorian spot prices

Source: Frontier Economics analysis of AEMO data

Figure 6 and Figure 7 combine the historical customer load data and spot price data to report the load
premium (calculated as the load-weighted price divided by the time-weighted price) for each customer
type, for each Victorian DNSP and for each of the last four financial years. In our experience, the load-
weighted spot price (and, by extension, the load premium) is a reasonable guide to the WEC. We can
see from Figure 6 and Figure 7 that the load premium over 2016/17 and 2017/18 was reasonably
constant, but increased more significantly since then, largely as a result of spot prices that remained
higher for longer in the evening in 2018/19 and 2019/20.

frontier economics                                                                                       DRAFT
Wholesale electricity costs                                                           13

Figure 6: Load premium for residential customers, based on Victorian spot prices

Source: Frontier Economics analysis of AEMO data

Figure 7: Load premium for business customers, based on Victorian spot prices

Source: Frontier Economics analysis of AEMO data

frontier economics                                                                 DRAFT
Wholesale electricity costs                                                                                14

As well as examining historical data it can be useful to compare historical price outcomes with
expectations of future prices, based on ASXEnergy contract prices. Since we will ultimately be scaling
historical half-hourly prices to an average price based on ASXEnergy contract prices, it is helpful if the
historical patterns in half-hourly prices are reasonably consistent with the pricing outcomes indicated by
ASXEnergy contract prices.

Figure 8 examines quarterly patterns of spot prices and ASXEnergy prices. For each quarter, Figure 8
presents the relationship between average quarterly prices and average annual prices: on an historical
basis this relationship is based on historical Victorian spot prices; on a forecast basis this relationship is
based on ASXEnergy base-load swaps prices for Victoria. Figure 8 reveals quite a degree of volatility
in the relationship between quarterly prices over time: average prices have tended to be highest in Q2
or Q3, but in recent years we have seen the highest prices in Q1. This is consistent with ASXEnergy
data, which sees the highest prices for Q1 contracts. In any case, to minimise any potential issues with
scaling historical half-hourly prices to ASXEnergy prices with a different quarterly pattern, we scale
historical half-hourly prices to ASXEnergy prices on a quarterly basis, so that the quarterly patterns of
prices observed in the ASXEnergy data is also reflected in our forecast half-hourly prices. This is
discussed in more detail in Section 3.3.

Figure 9 examines peak/off-peak patterns of spot prices and ASXEnergy prices. For each peak/off-
peak period, Figure 9 presents the relationship between average peak/off-peak prices and average
annual prices: on an historical basis this relationship is based on historical Victorian spot prices; on a
forecast basis this relationship is based on ASXEnergy base-load swaps prices for Victoria. Figure 9
reveals that historically peak prices have tended to be higher than average and off-peak prices have
tended to be lower than average (as would be expected) and that this pattern is also reflected in the
ASXEnergy data.

frontier economics                                                                                    DRAFT
Wholesale electricity costs                                                                                15

Figure 8: Quarterly patterns of spot prices and ASXEnergy prices

Source: Frontier Economics analysis of AEMO data and ASXEnergy data

Figure 9: Peak/off-peak patterns of spot prices and ASXEnergy prices

Source: Frontier Economics analysis of AEMO data and ASXEnergy data

Based on the analysis of historical half-hourly load and half-hourly prices set out above, our approach
for this report is to continue to adopt the approach that we adopted in our advice to the ESC for the VDO
for 2021; that is, we continue to include all historical data available to us (in this case data from 2016/17,
2017/18, 2018/19 and 2019/20) in a Monte Carlo simulation when forecasting half-hourly load and half-
hourly prices. Implicit in this approach is the assumption that patterns of load and prices for each of
these four historical years can provide useful information on patterns of load and price outcomes for
2021.

As we have seen above, there has been little change in the average daily load profile for residential or
small business customers, and, in our view, reason to think that half-hourly load from 2016/17 through

frontier economics                                                                                    DRAFT
Wholesale electricity costs                                                                                16

to 2019/20 can provide useful information on potential load and price outcomes for 2021. While there is
some indication that load in the middle of the day is falling slightly – likely as a result of increased solar
PV generation – the effect does not appear to be significant. Our assessment suggests that under
current market conditions, these changes in load (and, more broadly, the effect that solar PV has on
load) would not have a material impact on our estimate of WEC. However, this will need to be monitored
in future.
While there is little change in the average daily load profile, there have been more significant changes
in price outcomes over the period 2016/17 through to 2019/20. In particular, the average daily profile for
spot prices shows that the peak in spot prices in the mid-afternoon to evening period has become more
pronounced each year from 2016/17 to 2019/20, and persistent longer in the evening. This is primarily
driven by an increasing number of high price events during the afternoon and evening in Q1. What is
more, the analysis of ASXEnergy data that we have undertaken – including as summarised in Figure 8
– suggests that the market is expecting similar high price events to occur during Q1 2021.

This raises the question of whether only using half-hourly prices (and load) from more recent years
would be preferable to including data from all four historical years in a Monte Carlo simulation. For
instance, as an alternative to using data from all four years from 2016/17 through to 2019/20 we could
exclude data from 2016/17 on the basis that 2016/17 had fewer high price events during the afternoon
and evening in Q1 than subsequent years. For this draft report we continue to use all available data,
consistent with the approach that we have adopted in previous years. However, we have investigated
the effect of excluding data from 2016/17 on our estimate of the WEC and have found that it would result
is a difference of less than 2% in the WEC.

3.3       Projecting half-hourly load and spot prices

As discussed, rather than take a single one of the years 2016/17, 2017/18, 2018/19 or 2019/20 as
representative of outcomes in 2021, we perform a Monte Carlo simulation on the four years of half-
hourly load and price data. In our view there are two benefits of using a Monte Carlo analysis:
• Any single year will be subject to unique market conditions that are unlikely to be repeated. This
  creates the risk that any single year may not be representative of conditions that might be expected
  in the future. However, using a Monte Carlo approach based, in this case, on four years of data
  increases the likelihood of basing our analysis on a representative set of conditions.
• Using a Monte Carlo analysis allows us to create a distribution of market conditions, providing some
  insight into the expected distribution of the WEC.

The Monte Carlo simulation is used to generate a year of half-hourly data by randomly drawing one day
of data, from the pool of available historical days, for each day of the forecast year. This random drawing
of data is done from a pool of like days (where days are classified according to day type –
weekday/weekend – and quarter). The Monte Carlo simulation is then performed 500 times to get a
distribution of simulated years, which allows us to choose a simulated year from within this distribution
to use in the modelling.

For example, a single simulated year will be generated as follows:
• The first day of 2021 is 1 January 2021, which is a Friday. Since this is a Friday in Q1, the half-hourly
  load and spot data for the first day of 2021 will determined by randomly drawing a day’s half-hourly
  data from all the Q1 weekdays that occurred in 2016/17 through to 2019/20.
• The second day of 2021 is 2 January 2021, which is a Saturday. Since this is a Saturday in Q1, the
  half-hourly load and spot data for the second day of 2021 will be determined by randomly drawing a
  day’s half-hourly data from all the Q1 weekend days that occurred in 2016/17 through to 2019/20.

frontier economics                                                                                    DRAFT
Wholesale electricity costs                                                                                                        17

• And so on for the 365 days that make up 2021, having regard, for each day, to its type and its quarter.

This process is then repeated 500 times to generate 500 simulated years, each year made up entirely
of historical outcomes in 2016/17 through to 2019/20.

For each of these simulated years, load and prices are drawn at the same time (i.e. from the same
historical day) so that the correlation between load and prices is maintained.
Once we have completed this Monte Carlo simulation, we make a last adjustment to the consumption
data, normalising each of the simulated years to 1 GWh of annual consumption. This maintains the load
shape and correlation between load and prices, but each year now has a uniform annual consumption.
We also make a further adjustment to the half-hourly spot prices. We consider that historical half-hourly
spot prices provide the best source of information about patterns of half-hourly spot prices and how
these are correlated with half-hourly load, but historical spot prices are not necessarily a good predictor
of the future average level of Victorian spot prices. There is no reason, for instance, that Victorian spot
prices over the period 1 July 2019 to 30 June 2020 will, on average, be the same as Victorian spot prices
for 2021. In our view, the best available public information about the average level of Victorian spot
prices for 2021 is the contract prices published by ASXEnergy. These contract prices – particularly the
prices of base swaps – provide the market’s view on what will be the average spot price for 2021. Given
this, for each simulated year, we assume that the average level of prices is consistent with ASXEnergy
futures prices. Specifically, for each simulated year we scale the half-hourly prices so that the time-
weighted average price in each quarter is equal to the relevant quarterly base swap prices for 2021 from
ASXEnergy3 (less an assumed contract premium of 5 per cent on the underlying prices) 4. We use the
40-day average of ASXEnergy contract prices for quarterly base swap prices (up to 21 July 2020) as
representing the market’s current view of spot prices for each quarter of 2021.5 This approach to
generating half-hourly price forecasts results in:
• The appropriate average level of spot prices (i.e. the time-weighted quarterly average price is
  consistent with ASXEnergy prices).
• The appropriate half-hourly profile of spot prices (i.e. the half-hourly profile of prices, and load, are
  consistent with historical outcomes).

3
          An alternative approach would be to attempt to scale half-hourly prices having regard to each of base swaps, peak
swaps and cap prices. However, the scaling process would require subjective judgements about how to simultaneously scale to
each of these prices. Given there would be little on which to base these subjective judgements our preference is to scale only to
base swap prices, which is a mechanical process. We note, however, that the calculation of the WEC does use each of the
contract prices from ASXEnergy.
4
           The contract premium cannot be directly observed, since it is the difference between an expectation at a point in time
of future spot prices (which cannot be observed) and the observed forward contract prices at that point in time. However, by
comparing data on out-turn spot prices and observed forward contract prices, an indication of the contract premium can be
inferred. There will be significant volatility in this observed data point, because unexpected changes in market conditions will affect
out-turn spot prices but not observed forward contract prices. Nevertheless, if this comparison is made over enough observations,
an estimate of the contract premium can be developed. We have undertaken this analysis for the full set of data since the
commencement of trade on ASXEnergy; based on that analysis, we consider that an assumption of a contract premium of 5% is
reasonable. In its report for the Australian Energy Council, ACIL Allen recommended that “the appropriate level of contract
premium is an outcome of the analysis rather than an input”. We are unsure how this can be implemented and believe it would be
incorrect to do so in any case. As discussed, the actual contract premium is by nature an unobservable value theoretically derived
through comparing an expected outcome at a point in time to the observed outcome at the same point in time.
5
            We note that there is a difference in the averaging period that we use for estimating spot prices for 2021 and the
averaging period we use for calculating contract prices to be used in estimating the WEC for the VDO. As discussed, we use the
most recent 40-day average ASXEnergy prices as the best guide to the market’s view on spot prices that will occur in 2020.
However, based on instructions from the ESC, we use 12-month trade weighted average ASXEnergy prices to set the contract
price for retailers when determining the WEC. In our view, there is no necessity for these averaging periods to be consistent. One
way to think about the WEC that we are calculating using this approach is that we are estimating the contract payments that a
retailer would face if that retailer had purchased its contracts for 2021 over the last 12 months (at the same time as trade occurs
on ASXEnergy) and uses those contracts to hedge the risk it would face based on current expectations of spot prices.

frontier economics                                                                                                           DRAFT
Wholesale electricity costs 18 Analysis of data An indication of the results of this Monte Carlo simulation can be provided by calculating the load- weighted price for each of the 500 simulated years. As we discussed, in our experience the load- weighted price is a reasonable guide to the WEC. Figure 10 through Figure 14 show the distribution of load-weighted prices for each of the 500 simulated years from our Monte Carlo analysis, for each distribution area and for each customer type. As discussed, the average spot price in each of these simulated years is the same – based on the 40-day average ASXEnergy base swap price – but the half- hourly profile of both spot prices and load are different. It should be clear from Figure 10 through Figure 14 that the Monte Carlo simulation has resulted in a distribution of load-weighted prices driven by differences in the half-hourly patterns of spot prices and load. frontier economics DRAFT
Wholesale electricity costs                                                                                            19

Figure 10: Distribution of load-weighted price for simulate d years for residential and business load – CitiPower

Source: Frontier Economics

frontier economics                                                                                                  DRAFT
Wholesale electricity costs                                                                                          20

Figure 11: Distribution of load-weighted price for simulated years for residential and business load – Powercor

Source: Frontier Economics

frontier economics                                                                                                DRAFT
Wholesale electricity costs                                                                                        21

Figure 12: Distribution of load-weighted price for simulated years for residential and business load – AusNet

Source: Frontier Economics

frontier economics                                                                                              DRAFT
Wholesale electricity costs                                                                                        22

Figure 13: Distribution of load-weighted price for simulated years for residential and business load – United

Source: Frontier Economics

frontier economics                                                                                              DRAFT
Wholesale electricity costs                                                                                        23

Figure 14: Distribution of load-weighted price for simulated years for residential and business load – Jemena

Source: Frontier Economics

frontier economics                                                                                              DRAFT
Wholesale electricity costs                                                                            24

4 CONTRACT PRICES
This section addresses the third question we need to answer to estimate WEC:
• What is the cost of financial hedging contracts?

As discussed, our approach to assessing the WEC that retailers face is based on an estimate of the
cost that a prudent retailer would face in supplying electricity to their customers, having regard to the
hedging contracts that a prudent retailer is likely to enter into. The hedging contracts that we base this
analysis on are ASXEnergy contracts. There are three main types of electricity contracts that are traded
on ASXEnergy:
• Base swaps for each quarter.
• Peak swaps for each quarter.
• Base $300 caps for each quarter.

These contracts trade for a number of years in advance. Prices are published by ASXEnergy for each
contract for each trading day.
Cap contracts for Q3 and Q4

While Base $300 caps for each quarter have generally traded on ASXEnergy, these contracts are not
available for Q3 and Q4 2021. ASXEnergy has withdrawn these contracts due to the forthcoming change
to 5 minute settlement in the NEM.6

The fact that these contracts are not traded on ASXEnergy does not necessarily mean that retailers
have no equivalent hedging opportunities. Retailers may be able to enter into these contracts over-the-
counter, sign longer-term power purchase agreements with power stations, batteries or demand-side
management providers, or vertically integrate.

For this draft report we continue to include $300 caps in Q3 and Q4 as an option for retailers to hedge
their load. Given that a price is not available for $300 caps in Q3 and Q4, we use the relationship
between Q1 caps and Q3 and Q4 caps from 2020, and the price of Q1 caps in 2021, to infer a price for
Q3 and Q4 caps in 2021.
Contract price data

Figure 15 through Figure 17 set out the relevant trading data for each of these three contract types, for
each quarterly product. The trading data that is presented is open interest (which measures the total
volume of contracts in the market), the settlement price and the trading volume.

We can see from Figure 15 through Figure 17 that base swap contracts for calendar year 2021 and
caps for Q1 are currently trading regularly. Indeed, we can see that trade in these contracts is occurring
on most trading days. This suggests that the daily prices for base swaps and caps for Q1 does provide
a genuine indication of the market’s view of future prices.
However, trade in peak swaps and caps for Q2 is a lot lower, which raises the prospect that the available
prices for peak swaps for calendar year 2021 and caps for Q2 may not represent the market’s current
view of likely price outcomes for 2021. While there is some risk to this, we would note that the relative
level of peak swap prices, compared to base swap prices, is consistent with what we would generally
expect. We also note that peak swaps generally form part of our estimate of an efficient portfolio of

6
        https://www.asxenergy.com.au/newsroom/industry_news/delisting-of-australian-elect

frontier economics                                                                                DRAFT
Wholesale electricity costs 25 contracts, and excluding these from the analysis risks understating the costs that retailers face in hedging the higher load that they tend to face during peak periods. Our view is that economic decisions in competitive markets will be based on the market value of contracts (and we consider 40-day average prices are a good proxy for this market value), regardless of when those contracts are purchased. If a retailer has purchased contracts in the past at prices above the current market price, we would expect that competition from existing or new entrant retailers would force the retailer to make retail price offers based on the current cost of purchasing contracts; to do otherwise would be to risk losing customers to competitors able to enter or expand by purchasing contracts at the current cost and making retail price offers based on those current costs. Similarly, if a retailer has purchased contracts in the past at prices below the current market price, we would expect that maximising shareholder value would require them to make retail price offers based on the current cost of purchasing contracts; making retail price offers based on lower historical contract costs would result in less profit than simply selling the contracts again at the current contract price. We have not changed our view on this: we believe that market forces will result in retailer’s pricing decisions being based on the current value of contracts in a competitive market. However, there may be good reasons that a regulator will choose to base regulated prices on something other than 40-day average contract prices. For instance, a longer averaging period, such as 12 months or 24 months, would be expected to provide regulated prices that are more stable over time and would also likely result in regulated prices that are more reflective of incumbent retailers’ actual historical costs (since most retailers will buy contracts over a number of years leading up to the year). The ESC has asked us to use 12-month trade weighted contract prices in estimating the WEC. We calculate the 12- month trade weighted contract price for each contract by taking an average of the daily settlement price for that contract over the last 12 months, but weighting each daily settlement price by the share of the total volume of trade over the last 12 months that happened on that day. This means that the settlement price on a day on which no trade occurred is given a weighting of zero in calculating the 12-month trade weighted contract price, while the settlement price on the day on which the most trades occurred in the last 12 months is given the highest weighting. ASXEnergy contract prices are shown in Table 1, for the 12-month trade weighted average price, up to 21 July 2020. It is clear from Figure 15 through Figure 17 that contract prices for calendar year 2021 have generally trended lower during 2020. These recent reductions bring down the 12-month trade weighted average prices shown in Table 1. The recent reductions in contract prices for 2021 have been occurring at the same time that spot electricity prices have been falling. These reductions in spot prices are typically attributed, at least in part, to the effects of COVID-19. COVID-19 is generally considered one of the drivers of lower international prices for oil, gas and coal, which contributes to lower fuel prices for some power stations in the NEM. COVID-19 is also generally considered to cause lower aggregate electricity demand in the NEM. The combination of lower fuel prices and lower demand results in lower spot electricity prices. The expectation of a prolonged period of lower fuel prices and lower demand would account for the generally lower contract prices seen in Figure 15 through Figure 17. frontier economics DRAFT
Wholesale electricity costs                                                                       26

Table 1: 12-month trade weighted average ASXEnergy derivative prices for Victoria

                                                                                QUARTER
                                                        CALENDAR
                PRODUCT            STATUS
                                                          YEAR
                                                                     Q1       Q2       Q3         Q4

                $300 Caps               Base              2020     $34.51    $2.81    $1.57      $5.20

 TRADE                                                             $98.98    $56.07   $53.10    $52.64
                Swaps                   Base              2020
WEIGHTED

                Swaps                   Peak              2020     $164.29   $80.50   $65.84    $66.87

Source: Frontier Economics analysis of ASXEnergy data

frontier economics                                                                             DRAFT
Wholesale electricity costs 27 Figure 15: Victorian base swaps – open interest, prices and volumes for calendar year 2021 Source: Frontier Economics analysis of ASX data frontier economics DRAFT
Wholesale electricity costs                                                                     28

Figure 16: Victorian peak swaps – open interest, prices and volumes for calendar year 2021

Source: Frontier Economics analysis of ASX data

frontier economics                                                                           DRAFT
Wholesale electricity costs                                                                         29

Figure 17: Victorian base $300 caps – open interest, prices and volumes for calendar year 2021

Source: Frontier Economics analysis of ASX data

frontier economics                                                                               DRAFT
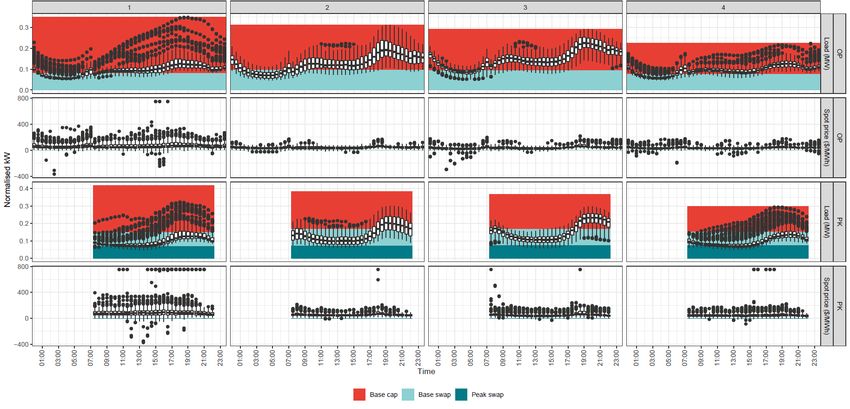
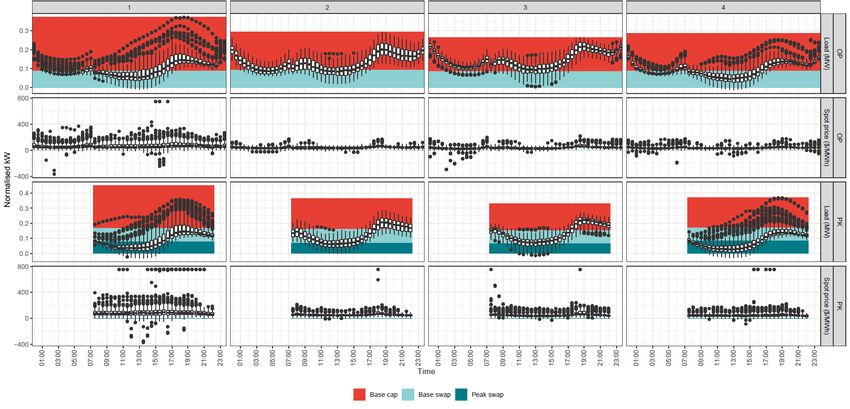
Wholesale electricity costs                                                                              30

5 CONTRACT POSITION
This section addresses the final question we need to answer to estimate WEC:
• What kind of hedging position is a prudent retailer likely to adopt?

We use our portfolio optimisation model – STRIKE – to determine the efficient mix of hedging products
that a prudent retailer would likely adopt. STRIKE calculates an efficient frontier, which represents the
contracting positions that provide the lowest energy purchase cost for a given level of risk (as measured
by standard deviation).

STRIKE applies a Minimum Variance Portfolio (MVP) approach to the task of hedging a retailer’s
exposure to wholesale spot prices. STRIKE incorporates an estimate of a retailer’s exposure to the
wholesale spot market, which is determined by the retailer’s load and wholesale spot prices. There is
an expected return and a variance associated with this. STRIKE also incorporates the types of hedging
products that are typical in the electricity industry. These contracts – swaps and caps – generate
cashflows that also have an expected return and a variance. Instead of assessing the expected return
and associated risk for each asset in isolation, STRIKE applies the concepts of portfolio theory to
evaluate the contribution of each asset to the risk of the portfolio as a whole. Based on this approach,
STRIKE calculates efficient hedging strategies.
In order to determine a hedging position for the purposes of estimating the WEC for each customer type
in each distribution area in Victoria, we make use of the following inputs in STRIKE:
• Forecast spot prices and load, as discussed in Section 3. As we discussed, we have developed 500
  simulated years of half-hourly spot prices and load for 2021. There is a distribution of outcomes within
  these 500 simulated years. Our view is that an efficient retailer’s hedging position should have regard
  to the uncertainty associated with what kind of year 2021 will be; will 2021 be a year with high prices
  and high load corresponding, so that the load-weighted price is high, or will 2021 be a year with low
  prices and high load corresponding, so that the load-weighted price is low? To account for this
  uncertainty, we input 7 simulated years into STRIKE, representing those simulated years that
  represent the 99th, 95th, 75th, 50th, 25th, 5th and 1st percentile when the 500 simulated years are ranked
  according to load-weighted price.
• Contract prices, as discussed in Section 4. We present results for 12-month trade weighted contract
  prices.

As discussed, STRIKE calculates an efficient frontier, which represents the contracting positions that
provide the lowest energy purchase cost for a given level of risk. The contract position that we use to
calculate the WEC is based on the most conservative contracting position on the efficient frontier, which
is the point on the efficient frontier with the lowest risk (but highest cost).
Outlined in Figure 18 to Figure 27 are the resulting contract positions at the conservative point for 2021,
for each load profile and for each distribution area. For each quarter (the vertical panels) and each
peak/off-peak period (the horizontal panels), the charts show the following:
• The distribution of half-hourly load for the 48 half-hours of the day (shown by the box plots in the
  ‘Load’ panel).
• The distribution of half-hourly spot prices for the 48 half-hours of the day (shown by the box plots in
  the ‘Spot price’ panel). The price chart is truncated at a spot price of $750/MWh.
• The quantity of swaps and caps at the conservative point of the efficient frontier (shown by the
  coloured areas in the ‘Load’ panel).

frontier economics                                                                                  DRAFT
Wholesale electricity costs                                                                               31

In general, the contract position at the conservative point involves:
• purchasing swaps to cover (approximately) average demand
• purchasing caps, on top of that, to cover (approximately) to peak demand
• in some cases, incurring a small amount of pool exposure at absolute peak demand times.

As seen in Figure 18 to Figure 27, the contract position at the conservative point generally results in
complete coverage of the highest demand half hours, but does not always do so. The reason that there
can remain some residual pool exposure even at the conservative point is that STRIKE balances the
costs and risks of remaining exposed to the spot price at these highest demand half hours against the
costs and risks associated with being over-contracted. Signing additional contracts is neither costless
nor riskless, and while being exposed to the spot price during a small number of high demand half-hours
can result in large payments, being over-contracted for a large number of lower demand half-hours can
also result in large payments. Some retailers may have a preference for additional contract cover to
meet forecast peak demand in all cases, but we note that the volatility allowance (discussed in Section
6.2) is intended to reflect the residual risk at the conservative point and could be used to purchase
additional cap cover.

It should also be noted that the conservative point on the efficient frontier reflects the contract position
that achieves the lowest risk given the projected state of the world that is input into STRIKE. In the event
that different states of the world were input into STRIKE, the model would find a different contract
position that achieves the lowest risk. In particular, if it were assumed, for instance, that next year will
have an unusually large number of very high price events that coincided with high load, then the model
would certainly find a different contract position that achieves the lowest risk. That load forecasts and
price forecasts (and their correlation) are important to the costs that retailers face in supplying regulated
customers is why we use the best available information to develop load forecasts and price forecasts
that are consistent with the observed peakiness of historic load and historic prices (and the observed
correlation between them).

frontier economics                                                                                   DRAFT
Wholesale electricity costs                                                                                                    32

Figure 18: Contract position for CitiPower residential load, ASXEnergy contract prices, calendar year 2021 (2020 dollars)

Note: Spot price chart truncated at a spot price of $750/MWh.

frontier economics                                                                                                          DRAFT
Wholesale electricity costs                                                                                                   33

Figure 19: Contract position for Powercor residential load, ASXEnergy contract prices, calendar year 2021 (2020 dollars)

Note: Spot price chart truncated at a spot price of $750/MWh.

frontier economics                                                                                                         DRAFT
Wholesale electricity costs                                                                                                 34

Figure 20: Contract position for Jemena residential load, ASXEnergy contract prices, calendar year 2021 (2020 dollars)

Note: Spot price chart truncated at a spot price of $750/MWh.

frontier economics                                                                                                       DRAFT
Wholesale electricity costs                                                                                                 35

Figure 21: Contract position for AusNet residential load, ASXEnergy contract prices, calendar year 2020 (2021 dollars)

Note: Spot price chart truncated at a spot price of $750/MWh.

frontier economics                                                                                                       DRAFT
Wholesale electricity costs                                                                                                 36

Figure 22: Contract position for United residential load, ASXEnergy contract prices, calendar year 2020 (2021 dollars)

Note: Spot price chart truncated at a spot price of $750/MWh.

frontier economics                                                                                                       DRAFT
Wholesale electricity costs                                                                                                 37

Figure 23: Contract position for CitiPower business load, ASXEnergy contract prices, calendar year 2021 (2020 dollars)

Note: Spot price chart truncated at a spot price of $750/MWh.

frontier economics                                                                                                       DRAFT
Wholesale electricity costs                                                                                                38

Figure 24: Contract position for PowerCor business load, ASXEnergy contract prices, calendar year 2021 (2020 dollars)

Note: Spot price chart truncated at a spot price of $750/MWh.

frontier economics                                                                                                      DRAFT
Wholesale electricity costs                                                                                              39

Figure 25: Contract position for Jemena business load, ASXEnergy contract prices, calendar year 2021 (2020 dollars)

Note: Spot price chart truncated at a spot price of $750/MWh.

frontier economics                                                                                                    DRAFT
Wholesale electricity costs                                                                                              40

Figure 26: Contract position for AusNet business load, ASXEnergy contract prices, calendar year 2021 (2020 dollars)

Note: Spot price chart truncated at a spot price of $750/MWh.

frontier economics                                                                                                    DRAFT
Wholesale electricity costs                                                                                              41

Figure 27: Contract position for United business load, ASXEnergy contract prices, calendar year 2021 (2020 dollars)

Note: Spot price chart truncated at a spot price of $750/MWh.

frontier economics                                                                                                    DRAFT
Wholesale electricity costs                                                                                42

6 WHOLESALE
ELECTRICITY COSTS
Based on the data discussed in Section 3 through Section 5, this section reports the WEC that we have
estimated.

6.1        Wholesale electricity costs

We estimate WEC by calculating settlement payments and differences payments resulting from the half-
hourly spot prices and load, contract prices and contract position that we have developed.
Results

The WECs that we have estimated are based on half-hourly spot prices and load from the median
simulated year (when these years are ranked according to WEC). The WECs that we have estimated
are based on 12-month trade weighted average ASXEnergy contract prices up to 21 July 2020. The
WECs that we have estimated are based on the contract position from the conservative point on the
efficient frontier for each DNSP.

These WECs are set out in Table 2.

Table 2: Modelled market-based wholesale electricity cost result

                                    WHOLESALE ELECTRICITY COSTS ($/MWH, REAL $2021)
 ENTITY
                                         RESIDENTIAL                               BUSINESS

 AUSNET                                      $96.18                                   $84.83

 CITIPOWER                                   $91.84                                   $88.18

 JEMENA                                      $100.03                                  $87.35

 POWERCOR                                    $94.20                                   $82.58

 UNITED                                      $100.58                                  $89.38

Source: Frontier Economics

Figure 28 through Figure 32 show the distribution of WEC for each customer type and for each DNSP
area across the full set of 500 simulated years from our Monte Carlo analysis. For each of these 500
simulated years we use the same contract prices and the same contract position; all that changes
between these 500 simulated years is the half-hourly profile of prices and the half-hourly load profile.
Since each of these WECs is based on a hedged position, they are more concentrated than the load
weighted prices. The average spread for the WEC is $16.74/MWh while the average spread for the load
weighted price is $20.95/MWh.

We note that these distributions do not reflect the distribution of all possible outcomes that retailers could
face. If patterns of spot prices or load are materially different from the historical period on which we
based our Monte Carlo analysis, or if average spot prices were too much different from suggested by

frontier economics                                                                                    DRAFT
Wholesale electricity costs 43 current ASXEnergy contract prices, the wholesale energy cost could fall outside the range implied by these distributions. frontier economics DRAFT
Wholesale electricity costs                                            44

Figure 28: CitiPower load wholesale electricity cost distribution

Source: Frontier Economics

frontier economics                                                  DRAFT
Wholesale electricity costs                                           45

Figure 29: Powercor load wholesale electricity cost distribution

Source: Frontier Economics

frontier economics                                                 DRAFT
Wholesale electricity costs                                         46

Figure 30: AusNet load wholesale electricity cost distribution

Source: Frontier Economics

frontier economics                                               DRAFT
Wholesale electricity costs                                         47

Figure 31: United load wholesale electricity cost distribution

Source: Frontier Economics

frontier economics                                               DRAFT
Wholesale electricity costs                                         48

Figure 32: Jemena load wholesale electricity cost distribution

Source: Frontier Economics

frontier economics                                               DRAFT
You can also read