Regulated retail electricity prices for 2020-21 - Technical appendices-Draft determination - Queensland ...
←
→
Page content transcription
If your browser does not render page correctly, please read the page content below
Technical appendices—Draft determination

Regulated retail electricity
prices for 2020–21
Regional Queensland

March 2020
© Queensland Competition Authority 2020
The Queensland Competition Authority supports and encourages the dissemination and exchange of information.
However, copyright protects this document.

The Queensland Competition Authority has no objection to this material being reproduced, made available online or
electronically but only if it is recognised as the owner of the copyright
 2 and this material remains unaltered.
Queensland Competition Authority Contents

Contents

STRUCTURE OF TECHNICAL APPENDIX 1

APPENDIX A: MINISTER'S DELEGATION 2

APPENDIX B: SUBMISSIONS AND REFERENCES 10

APPENDIX C: NETWORK COST APPROACH (SMALL CUSTOMERS) 12

APPENDIX D: DRAFT JURISDICTIONAL SCHEME CHARGES 14

APPENDIX E: ENERGY COST APPROACH 16

APPENDIX F: COST PASS-THROUGH APPROACH 31

APPENDIX G: OBSOLETE TARIFFS (CUSTOMER IMPACTS) 33

APPENDIX H: DATA USED TO ESTIMATE CUSTOMER IMPACTS 40

APPENDIX I: BUILD-UP OF DRAFT NOTIFIED PRICES 41

APPENDIX J: DRAFT GAZETTE NOTICE 47

 i
Queensland Competition Authority Structure of technical appendix STRUCTURE OF TECHNICAL APPENDIX This technical appendix aims to provide stakeholders with a more comprehensive understanding of our price setting process for notified prices. It is designed to be read in conjunction with the draft determination report (main report), not as a substitute. We have provided supporting and other information in the appendices as follows: Appendix A: Minister's delegation Appendix B: Submissions and references Appendix C: Network cost approach (small customers) Appendix D: Draft jurisdictional scheme charges Appendix E: Energy cost approach Appendix F: Cost pass-through approach Appendix G: Obsolete tariffs (customer impacts) Appendix H: Data used to estimate customer impacts Appendix I: Build-up of draft notified prices Appendix J: Draft gazette notice. 1
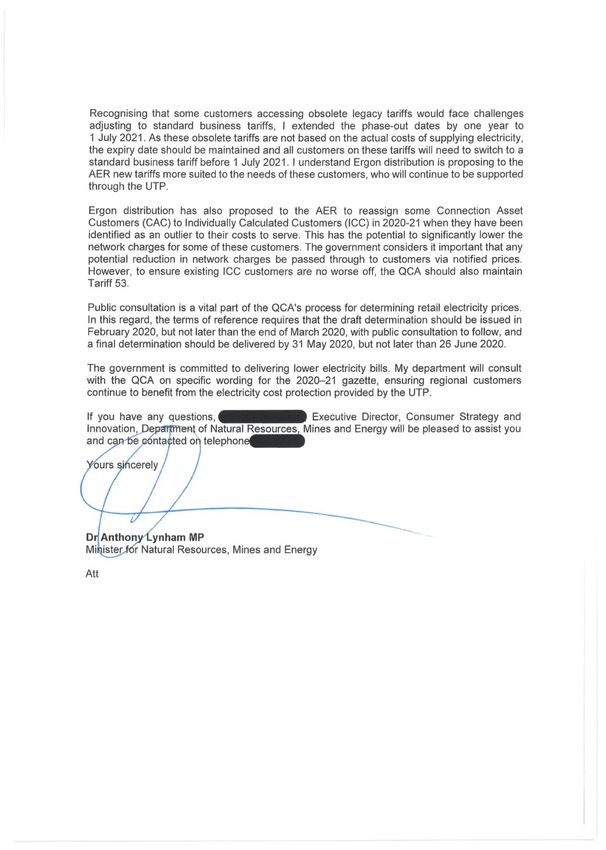
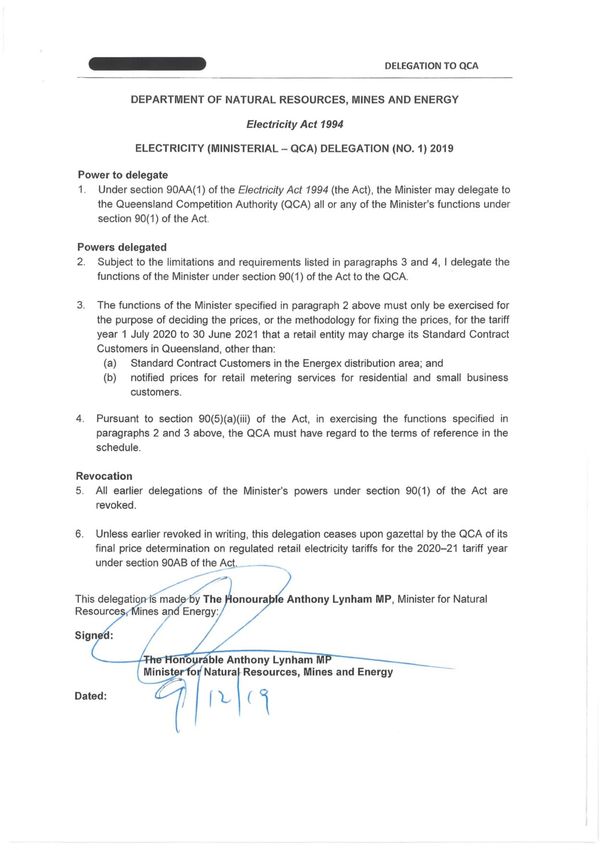
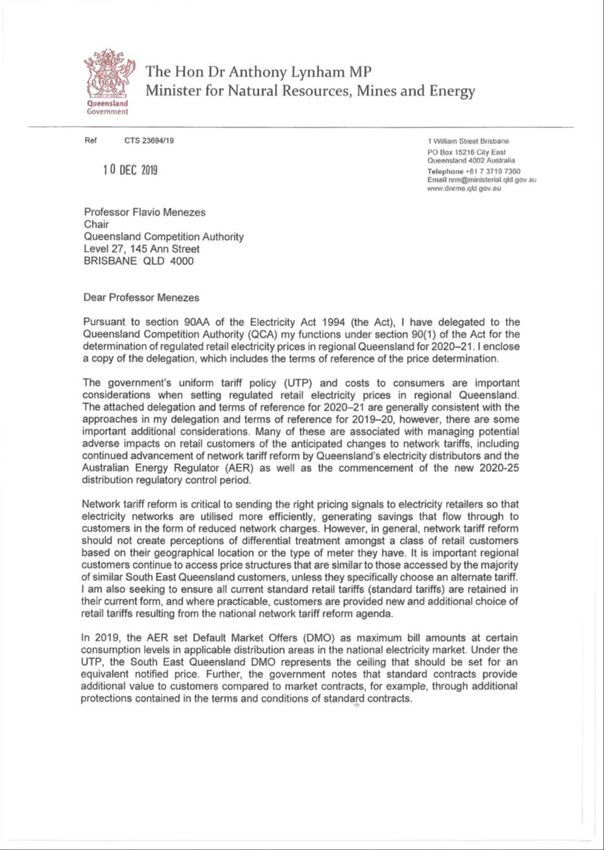
Queensland Competition Authority Appendix A: Minister's delegation

APPENDIX A: MINISTER'S DELEGATION

 2
Queensland Competition Authority Appendix A: Minister's delegation

 3
Queensland Competition Authority Appendix A: Minister's delegation

 4
Queensland Competition Authority Appendix A: Minister's delegation

 5

Queensland Competition Authority Appendix A: Minister's delegation

 6
Queensland Competition Authority Appendix A: Minister's delegation

 7
Queensland Competition Authority Appendix A: Minister's delegation

 8
Queensland Competition Authority Appendix A: Minister's delegation

 9
Queensland Competition Authority Appendix B: Submissions and references

APPENDIX B: SUBMISSIONS AND REFERENCES

Submissions
We received 10 submissions on our interim consultation paper. These are available on our website.1

 Stakeholder Abbreviated form Sub number Date received

 Australian Sugar Milling Council ASMC 1 13 Jan 2020

 Canegrowers Canegrowers 2 3 Feb 2020

 Cotton Australia Cotton Australia 3 13 Jan 2020

 Energy Queensland EQ 4 13 Jan 2020

 Kalamia Cane Growers Organisation Kalamia 5 13 Jan 2020

 National Seniors Australia NSA 6 13 Jan 2020

 Queensland Council of Social Services QCOSS 7 13 Jan 2020

 Queensland Consumers' Association Queensland Consumers' Association 8 13 Jan 2020

 Queensland Farmers' Federation QFF 9 13 Jan 2020

References
ACIL Allen Consulting (ACIL Allen) 2020, Estimated Energy Costs 2020–21 Retail Tariffs, draft report
prepared for the QCA, February 2020.
Australian Energy Market Commission (AEMC) 2013, Advice on Best Practice Retail Price Regulation
Methodology, final report, September 2013.
Australian Energy Market Operator (AEMO) 2019a, 2019–20 Electricity Final Budget and Fees, June 2019.
––– 2019b, 2019 Electricity Statement of Opportunities, August 2019.
––– 2019c, Draft 2020 Integrated System Plan, draft report, December 2019.
Australian Energy Regulator (AER) 2017, Powerlink Transmission Determination 2017–18 to 2021–22, final
decision, April.
AER 2019a, Energex Distribution Determination 2020 to 2025, draft decision, October.
––– 2019b, Ergon Energy Distribution Determination 2020 to 2025, draft decision, October.
AER 2020, Draft Determination, Default Market Offer Prices 2020–21, February 2020.
Energex 2019a, Tariff Structure Statement 2020–25, June 2019.
––– 2019b, Tariff Structure Statement – Explanatory Notes 2020–25, June 2019.
––– 2019c, Revised Tariff Structure Statement 2020–25, December 2019.
––– 2019d, Revised Tariff Structure Statement – Explanatory Notes 2020–25, December 2019.
Ergon Energy 2019a, Tariff Structure Statement 2020–25, June 2019.
––– 2019b, Tariff Structure Statement – Explanatory Notes 2020–25, June 2019.

1 We received one confidential submission that is not available on our website.

 10
Queensland Competition Authority Appendix B: Submissions and references

––– 2019c, Revised Tariff Structure Statement 2020–25, December 2019.
––– 2019d, Revised Tariff Structure Statement – Explanatory Notes 2020–25, December 2019.
Queensland Government 2019, Queensland Budget 2019–20—Budget Strategy and Outlook: Budget Paper
No. 2, June 2019.
Reserve Bank of Australia (RBA) 2019, Statement on Monetary Policy—November 2019, November 2019.

 11
Queensland Competition Authority Appendix C: Network cost approach (small customers) APPENDIX C: NETWORK COST APPROACH (SMALL CUSTOMERS) This appendix sets out in greater detail how we estimated draft network costs2 for small customer tariffs using a price indexation approach, specifically an 'X-factor' approach (as noted in section 4.1). An X-factor approach provides for the pass-through of changes in network costs (as determined by the AER). To apply this approach, 2019–20 network costs are adjusted using the AER’s nominal X-factors. The AER determines five X-factors for the purposes of revenue smoothing—the X-factor for the first year is also known as P0. These X-factors indicate the changes in allowable annual cost/revenue (in real terms) of the distribution and transmission businesses. To convert the X-factors from real to nominal terms, we have used the AER's X-factors, the CPI and the price formula: for distribution charges, we used the 2020–21 Energex3 specific CPI of 1.9 per cent and X-factor of 20.3 per cent, resulting in a nominal X-factor of –18.4 per cent4 for transmission charges, we used the 2020–21 Powerlink specific CPI of 2.45 per cent and X-factor of 0.15 per cent, resulting in a nominal X-factor of 2.3 per cent.5 To estimate 2020–21 network costs, we used the relevant X-factors to escalate/de-escalate the 2019–20 distribution and transmission charges. The table below provides an illustration of how the X-factor approach was applied to estimate network costs for the residential flat-rate tariff (retail tariff 11). Table 1 Example—application of X-factor approach (residential flat-rate tariff) Type A B C D E 2019–20 AER's nominal 2020–21 X-factor Fixed (c/day) Usage (c/kWh) Fixed (c/day) Usage (c/kWh) Distribution 42.100 6.999 –18.4% 34.354 5.711 Transmission 6.700 1.425 2.3% 6.854 1.458 Total network 48.800 8.424 – 41.208 7.169 Note: The 2020-21 fixed charges were estimated using the formula: = × (1 + ), while the usage charges were estimated using the formula: = × (1 + ). The total network charges are the sum of the distribution and transmission charges. Source: Our analysis using data from the AER and Energy Queensland. The application of the X-factor approach to estimate network costs for non-flat-rate tariffs6 is more complex, because the composition of the 2019–20 network charges for these tariffs (in terms of distribution and transmission charges) is unknown. This is because we determined the 2019–20 network charges (in our 2 For the purposes of this report, 'network cost/price' is a general reference to distribution and transmission costs/prices, unless otherwise indicated. 3 Our draft decision is to base notified prices for small customers on the costs of supply in SEQ. This means that network costs for small customers are based on Energex's costs. 4 These are draft estimates provided in the AER's draft decision. The draft reduction in Energex's revenue is mainly due to a lower return on capital and decrease in allowance for tax/revenue adjustments. See AER 2019a. 5 The AER is expected to update the X-factor (provided in its final decision) to incorporate an updated return on debt in April 2020. The reduction in Powerlink's revenue is primarily driven by a lower return on capital. See AER 2017. 6 For the purpose of this appendix, 'non flat-rate tariff' is a general reference to retail tariffs 12A, 22A, 14 and 24. 12
Queensland Competition Authority Appendix C: Network cost approach (small customers)

2019–20 determination) to make them consistent with the UTP. We did this by reducing the Ergon
Distribution network charges to Energex levels, while maintaining the Ergon Distribution tariff structures.7
Therefore, we propose to use the composition of the relevant Ergon network tariff to calculate the
proportion of distribution/transmission charges as a share of network charges. By using the relevant
proportions, we broke down the 2019–20 network charges into distribution and transmission charges
before applying the relevant X-factors to estimate the 2020–21 network costs.

7 See our 2019–20 final determination for more information.

 13
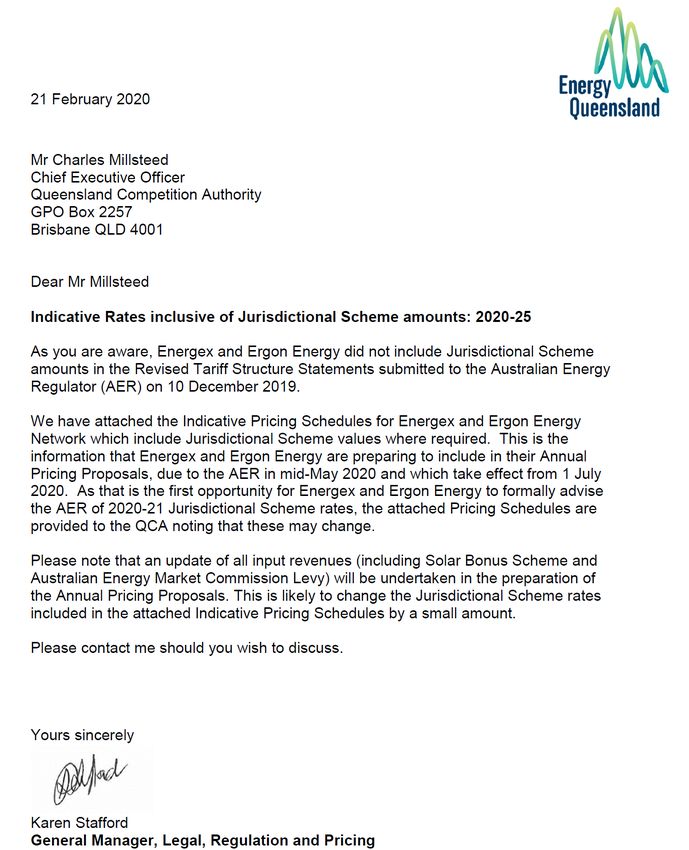
Queensland Competition Authority Appendix D: Draft jurisdictional scheme charges

APPENDIX D: DRAFT JURISDICTIONAL SCHEME CHARGES

As discussed in section 3.3.1, the draft jurisdictional scheme charges were based on estimates provided by
Energy Queensland—see letter below.
Table 2 2020–21 Draft jurisdictional scheme charges for small customers (GST exclusive)

 Tariff class Retail tariff Fixed (c/day) Usage (c/kWh)

 Residential 11, 12A, 14 1.100 0.920

 Small business 20, 22A, 14, 41 1.100 1.010

 Controlled load 31, 33 - 0.790

 Unmetered 91 - 0.664

 Large business 44, 45, 46 ,50 51.600 0.067

 Very large business 51A—51D, 53 1052.300 0.051

Source: Energy Queensland.

 14
Queensland Competition Authority Appendix D: Draft jurisdictional scheme charges

 15
Queensland Competition Authority Appendix E: Energy cost approach APPENDIX E: ENERGY COST APPROACH This appendix provides further detail on why we consider ACIL Allen's estimates are appropriate, including for each of the three energy cost components estimated (as noted in section 4.2.1). It covers some of the more complex methods and assessments used in estimating energy costs. ACIL Allen's draft report, including the information we relied on to prepare this technical appendix, is available on our website.8 Wholesale energy costs A retailer incurs wholesale energy costs when purchasing electricity from the National Electricity Market (NEM) to meet the demand of its customers. The NEM is a volatile market where spot prices are settled every half-hour and currently can range from –$1,000 to $14,700 per megawatt hour (MWh).9 Retailers adopt a range of strategies to reduce spot price volatility risk (spot price risk), including: pursuing a hedging strategy by purchasing financial derivatives10—such as futures, swaps, caps and options entering long-term power purchase agreements with generators investing in their own electricity generators. For the 2020–21 determination, we engaged ACIL Allen to assist with estimating wholesale energy costs for customers whose prices are settled on: the net system load profiles (NSLPs) in the Energex and Ergon distribution areas the controlled load profiles (CLPs) in the Energex distribution area. The NSLP and CLP approximate how much electricity is consumed by customers on accumulation meters in a region, for each half-hour of the day. Unlike smart/interval meters, accumulation meters do not record when during the day electricity was consumed or how much was consumed at that time. To allow for half- hourly settlement within the NEM (with different spot prices and volume for each half hour), the Australian Energy Market Operator (AEMO) uses the NSLP to approximate the amount of electricity consumed by customers on accumulation meters in a region, for each half hour of the day. At this stage, most customers in Queensland are on accumulation meters. There are currently two types of CLPs in the Energex distribution area—CLP 9000 and CLP 9100—which capture the consumption profiles of south east Queensland customers on tariffs equivalent to retail tariffs 31 and 33 respectively. We have also requested ACIL Allen to investigate the feasibility of estimating wholesale energy costs for the new controlled load network tariffs that Energy Queensland proposed in its 2020–25 Tariff Structure Statement11 (section 5.1.6). 8 ACIL Allen 2020. 9 The minimum spot price (market floor price) and the maximum spot price (market price cap) are defined in chapter 3 of the National Electricity Rules. The market price cap is published by the AEMC every February and is effective from 1 July. For more information, see www.aemc.gov.au. 10 Generally, purchasing financial derivatives enables retailers to lock in a price, or a maximum price (in the case of caps) at which a given volume of electricity will be transacted at a future date. 11 Energex 2019c, Ergon Energy 2019c. 16
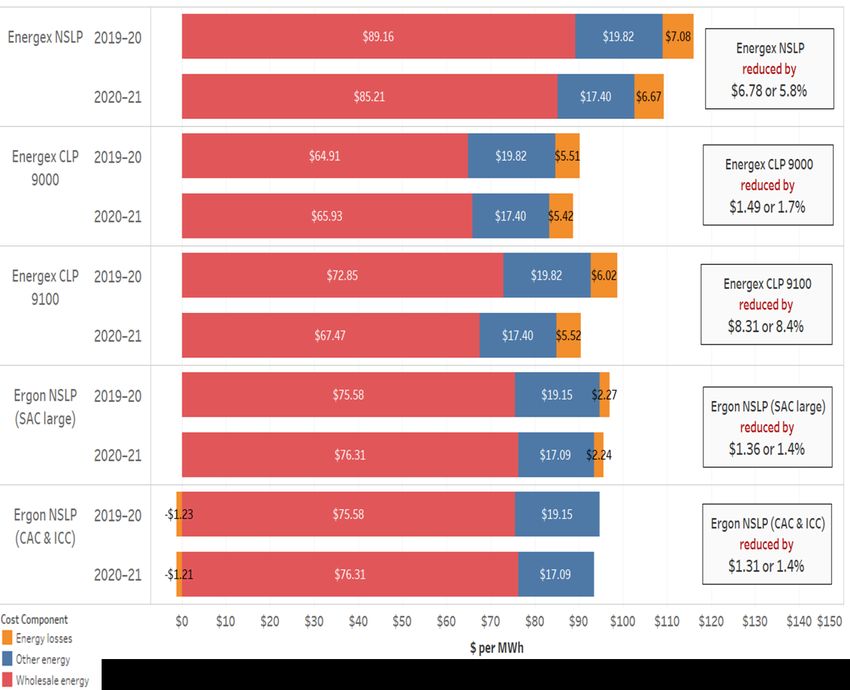
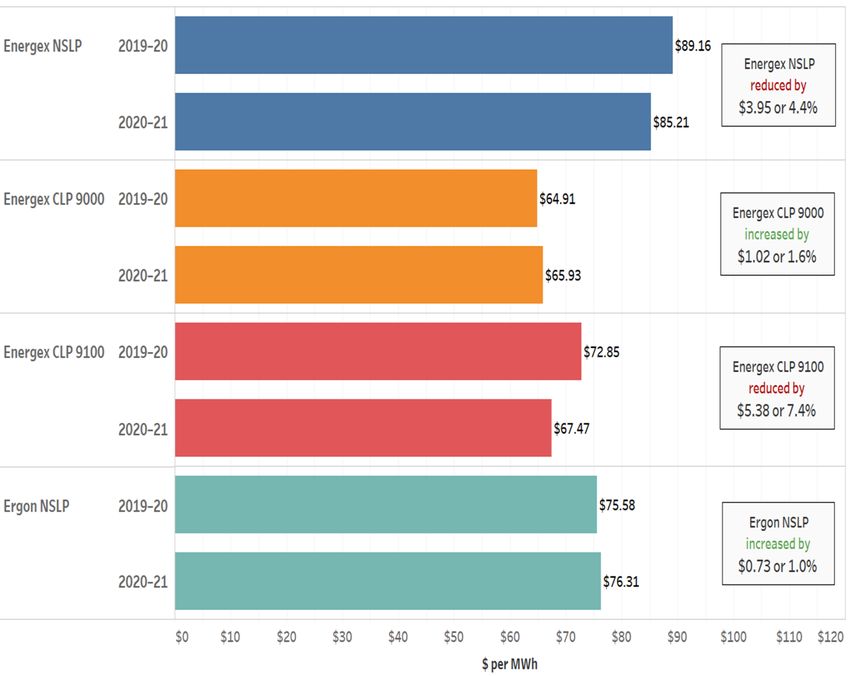
Queensland Competition Authority Appendix E: Energy cost approach Summary of analysis and findings Consistent with previous years, ACIL Allen has estimated wholesale energy costs using a market hedging approach. This approach is designed to simulate the NEM from a retailer's perspective. More specifically, it involves: simulating the expected spot prices that a retailer faces, considering temperature data, demand load profiles, generation supply/costs and power station availability, then estimating wholesale energy costs for a retailer that hedges spot price risk through the purchase of ASX Energy futures12. Compared to the estimates for the 2019–20 price determination, ACIL Allen estimated that wholesale energy costs for 2020–21 will: decrease for customers, whose prices are settled on the Energex NSLP and Energex CLP 9100. This decrease reflects the projected decrease in spot price volatility in Queensland and other NEM regions—resulting from the expected entry of approximately 5200 MW of utility-scale solar and wind generation. Of the 5200 MW new capacity, 1350 MW is committed to enter the Queensland market increase marginally for customers, whose prices are settled on the Ergon NSLP. This reflects the projected increase in the uptake of rooftop solar PV in the Ergon area, which reduces the electricity consumed from the grid during non-peak periods (i.e. daylight hours). Such a development increases the wholesale energy costs of the Ergon NSLP, because a greater proportion of the electricity from the grid is consumed during peak periods13 increase marginally for customers, whose prices are settled on the Energex CLP 9000. This increase is primarily driven by the load requirement and pattern of the Energex CLP 9000 (controlled by Energex).14 About 65 per cent of the load requirements for the Energex CLP 9000 occurs between 10 pm and 2 am (see section 5.1.3). ACIL Allen's modelling estimated that wholesale prices during these periods are not decreasing, given that the entry of substantial utility-scale solar generation is unlikely to put downward pressure on prices during these periods. 12 ASX energy futures are exchange-traded energy financial derivatives, which allow retailers to reduce the spot price volatility risk when purchasing electricity from the NEM. For more information, see https://www.asxenergy.com.au/ 13 ACIL Allen projects a continued uptake of rooftop solar PV in the Energex area too. However, given the historically and comparatively stronger uptake of rooftop solar PV in the Energex area, the projected future uptake does not change the load shape of the NSLP as severely as that of the NSLP in the Ergon area. 14 The load requirement and pattern of the Energex CLP 9000 are controlled by Energex through the management of its network tariff—NTC 9000 Super Economy. Under this network tariff, Energex ensures that the supply of electricity is available for a minimum of eight hours per day. Energex manages the load for this network tariff such that it maintains customer comfort, maximises utilisation and minimises peak demand on the Energex network. 17
Queensland Competition Authority Appendix E: Energy cost approach

Figure 1 Wholesale energy costs by settlement class (draft estimates)

Source: Our analysis using data from ACIL Allen.

Spot prices—demand profiles and historical energy cost levels
To simulate expected spot prices, ACIL Allen used its stochastic demand model to develop 49 weather-
influenced simulations of hourly demand for 2020–21—using temperature data from 1970–71 to 2018–19
and demand load profiles from 2016–17 and 2018–19.
The historical demand load profiles were sourced from AEMO. When simulating the weather-influenced
hourly demand, ACIL Allen also incorporated AEMO's latest peak demand forecast for 2020–21.15 This
section provides an overview of the demand profiles that ACIL Allen used for its analysis. More details are
available in chapter 4 of ACIL Allen's draft report.
Over the past few years, the Energex and Ergon NSLPs have become 'peakier', due to increased penetration
of rooftop solar PV, which has reduced daytime demand but has had limited effect on the evening peak
demand (see figures below). The Energex NSLP has the highest proportion of electricity from the grid
consumed during peak periods relative to other demand profiles. Consequently, it has the highest
wholesale energy costs of the profiles analysed in Queensland. The Ergon NSLP is less 'peaky' than the
Energex NSLP, largely due to a slightly slower uptake of rooftop solar PV, and consequently, it has lower
wholesale energy costs.

15 AEMO 2019b.

 18
Queensland Competition Authority Appendix E: Energy cost approach

Figure 2 Energex NSLP

 0.045

 0.040

 0.035

 0.030
 (MW, relative)

 0.025

 0.020

 0.015

 0.010

 0.005

 0.000

 11:30 AM

 1:30 PM

 3:30 PM
 12:00 AM
 12:30 AM
 1:00 AM
 1:30 AM
 2:00 AM
 2:30 AM
 3:00 AM
 3:30 AM
 4:00 AM
 4:30 AM
 5:00 AM
 5:30 AM
 6:00 AM
 6:30 AM
 7:00 AM
 7:30 AM
 8:00 AM
 8:30 AM
 9:00 AM
 9:30 AM
 10:00 AM
 10:30 AM
 11:00 AM

 12:00 PM
 12:30 PM
 1:00 PM

 2:00 PM
 2:30 PM
 3:00 PM

 4:00 PM
 4:30 PM
 5:00 PM
 5:30 PM
 6:00 PM
 6:30 PM
 7:00 PM
 7:30 PM
 8:00 PM
 8:30 PM
 9:00 PM
 9:30 PM
 10:00 PM
 10:30 PM
 11:00 PM
 11:30 PM
 2011-12 2012-13 2013-14 2014-15 2015-16 2016-17 2017-18 2018-19

Note: 'Relative MW' means the annual loads for each profile have been scaled so they add up to one. This removes differences
in absolute scale between the different profiles and changes in absolute size over time.
Source: ACIL Allen 2020.

Figure 3 Ergon NSLP

 0.035

 0.030

 0.025

 0.020
 (MW, relative)

 0.015

 0.010

 0.005

 0.000
 2:30 AM

 3:30 AM

 6:00 PM

 7:00 PM
 12:00 AM
 12:30 AM
 1:00 AM
 1:30 AM
 2:00 AM

 3:00 AM

 4:00 AM
 4:30 AM
 5:00 AM
 5:30 AM
 6:00 AM
 6:30 AM
 7:00 AM
 7:30 AM
 8:00 AM
 8:30 AM
 9:00 AM
 9:30 AM
 10:00 AM
 10:30 AM
 11:00 AM
 11:30 AM
 12:00 PM
 12:30 PM
 1:00 PM
 1:30 PM
 2:00 PM
 2:30 PM
 3:00 PM
 3:30 PM
 4:00 PM
 4:30 PM
 5:00 PM
 5:30 PM

 6:30 PM

 7:30 PM
 8:00 PM
 8:30 PM
 9:00 PM
 9:30 PM
 10:00 PM
 10:30 PM
 11:00 PM
 11:30 PM

 2011-12 2012-13 2013-14 2014-15 2015-16 2016-17 2017-18 2018-19

Note: 'Relative MW' means the annual loads for each profile have been scaled so they add up to one. This removes differences
in absolute scale between the different profiles and changes in absolute size over time.
Source: ACIL Allen 2020.

On the Energex CLPs, more electricity is generally consumed during off-peak periods and non-summer
quarters (due to higher water heating loads in non-summer months) than on the Energex and Ergon NSLPs
(see the figures below). Therefore, the Energex CLPs have lower wholesale energy costs relative to the
NSLPs. The Energex CLP for retail tariff 33 typically has a higher wholesale energy cost than the Energex CLP
for retail tariff 31. This is because the former generally has relatively more electricity consumed during
daylight hours and the evening peak than the latter.

 19
Queensland Competition Authority Appendix E: Energy cost approach

Figure 4 Energex CLP 9000 (retail tariff 31)

 0.160

 0.140

 0.120

 0.100
 (MW, relative)

 0.080

 0.060

 0.040

 0.020

 0.000
 12:00 AM

 11:30 AM

 8:00 PM

 11:00 PM
 12:30 AM
 1:00 AM
 1:30 AM
 2:00 AM
 2:30 AM
 3:00 AM
 3:30 AM
 4:00 AM
 4:30 AM
 5:00 AM
 5:30 AM
 6:00 AM
 6:30 AM
 7:00 AM
 7:30 AM
 8:00 AM
 8:30 AM
 9:00 AM
 9:30 AM
 10:00 AM
 10:30 AM
 11:00 AM

 12:00 PM
 12:30 PM
 1:00 PM
 1:30 PM
 2:00 PM
 2:30 PM
 3:00 PM
 3:30 PM
 4:00 PM
 4:30 PM
 5:00 PM
 5:30 PM
 6:00 PM
 6:30 PM
 7:00 PM
 7:30 PM

 8:30 PM
 9:00 PM
 9:30 PM
 10:00 PM
 10:30 PM

 11:30 PM
 2011-12 2012-13 2013-14 2014-15 2015-16 2016-17 2017-18 2018-19

Note: 'Relative MW' means the annual loads for each profile have been scaled so they add up to one. This removes differences
in absolute scale between the different profiles and changes in absolute size over time.
Source: ACIL Allen 2020.

Figure 5 Energex CLP 9100 (retail tariff 33)

 0.070

 0.060

 0.050

 0.040
 (MW, relative)

 0.030

 0.020

 0.010

 0.000
 9:30 AM

 11:00 PM
 12:00 AM
 12:30 AM
 1:00 AM
 1:30 AM
 2:00 AM
 2:30 AM
 3:00 AM
 3:30 AM
 4:00 AM
 4:30 AM
 5:00 AM
 5:30 AM
 6:00 AM
 6:30 AM
 7:00 AM
 7:30 AM
 8:00 AM
 8:30 AM
 9:00 AM

 10:00 AM
 10:30 AM
 11:00 AM
 11:30 AM
 12:00 PM
 12:30 PM
 1:00 PM
 1:30 PM
 2:00 PM
 2:30 PM
 3:00 PM
 3:30 PM
 4:00 PM
 4:30 PM
 5:00 PM
 5:30 PM
 6:00 PM
 6:30 PM
 7:00 PM
 7:30 PM
 8:00 PM
 8:30 PM
 9:00 PM
 9:30 PM
 10:00 PM
 10:30 PM

 11:30 PM

 2011-12 2012-13 2013-14 2014-15 2015-16 2016-17 2017-18 2018-19

Note: 'Relative MW' means the annual loads for each profile have been scaled so they add up to one. This removes differences
in absolute scale between the different profiles and changes in absolute size over time.
Source: ACIL Allen 2020.

Spot prices—generation supply and cost forecasts
In addition to the 49 simulated demand profiles, ACIL Allen used its stochastic outage model to develop 11
hourly power station availability simulations. ACIL Allen then applied its proprietary electricity model
(PowerMark) to generate 539 simulations of 8760 hourly wholesale electricity spot prices for 2020–21,
using the stochastic demand profiles and power station availabilities as inputs.
PowerMark simulates the behaviour of generators in the NEM, considering the cost and technological
characteristics of generators, fuel prices, generator bidding strategies, demand for electricity, weather and

 20
Queensland Competition Authority Appendix E: Energy cost approach power station availability. ACIL Allen incorporated changes to the existing generation supply, where market participants have formally announced changes, including mothballing, closure and change in operating approach of power plants. Near-term new generators are included, should ACIL Allen deem these plants to be committed projects. ACIL Allen's forecast of the generation supply and costs within the NEM closely aligns with AEMO's latest Integrated System Plan (ISP).16 The ISP was developed to provide technical/market data that informs the decision-making processes of interested parties as they operate/invest in the NEM. ACIL Allen's modelling also includes the formation of CleanCo.17 CleanCo's portfolio includes the Wivenhoe pumped storage facility, the Swanbank E gas power station, Barron Gorge, Kareeya and Koombooloomba hydro stations. The key impact of CleanCo is the change in operation of Wivenhoe. As part of CleanCo (a small generation portfolio), Wivenhoe is operated more aggressively, where it ramps up during periods of high spot prices. This would likely place downward pressure on peak prices. ACIL Allen advised that its wholesale spot price modelling broadly aligns with the market's expectations of spot price outcomes (ASX futures) for 2020–21. More details are available in chapters 2 and 4 of ACIL Allen's draft report. Hedged energy costs—hedging methodology and contract prices To simulate the wholesale energy costs incurred by a retailer that hedges spot price risk, ACIL Allen developed a hedging methodology based on the standard ASX energy base, peak and cap futures contracts. To develop a hedging methodology, ACIL Allen tested a substantial number of strategies to derive the strategy with the lowest cost and variance, considering the latest demand data. Contract prices were estimated using the trade-weighted average of ASX Energy daily settlement prices of base, peak and cap contracts for 2020–21. To calculate the trade-weighted futures contract prices, ACIL Allen has used the contract prices and volume of contracts traded until 6 January 2020. For the final determination, actual ASX Energy futures data until early April 2020 will be used to estimate contract prices. More details on ACIL Allen's approach are available in chapter 4 of its draft report. Compared to the contract prices estimated for the 2019–20 final determination, futures contract prices for 2020–21, on an annualised and trade-weighted basis, have: decreased by about $3.60/MWh for base contracts decreased by about $7.80/MWh for peak contracts decreased by about $0.80/MWh for cap contracts. 16 AEMO, 2019c. 17 In 2019, the Queensland Government restructured its government-owned generators and establish a separate entity, CleanCo, to operate its existing renewable energy generation assets and develop new renewable energy projects. 21
Queensland Competition Authority Appendix E: Energy cost approach Figure 6 Annualised quarterly electricity futures contract prices ($/MWh) $120 $100 $80 ($/MWh, nominal) $60 $40 $20 $0 2013-14 (Final 2014-15 (Final 2015-16 (Final 2016-17 (Final 2017-18 (Final 2018-19 (Final 2019-20 (Final 2020-21 (Draft Determination) Determination) Determination) Determination) Determination) Determination) Determination) Determination) Base contract price Peak contract price Cap contract price Source: ACIL Allen 2020. This reflects market participants expecting some softening in spot price outcomes due to the large amount of renewable generation expected to enter service. Approximately 5200 MW of new utility-scale solar and wind generation is expected to enter the NEM. Of the 5200 MW new capacity, 1350 MW is committed to enter the Queensland market. It is noted that cap contract prices, on a trade weighted basis, have decreased marginally between 2019– 20 and 2020–21, which suggest that market participants are not expecting the large amount of additional renewable capacity to increase price volatility, despite the intermittent nature of renewable generation. By applying the hedging methodology together with the simulated spot prices, ACIL Allen has derived 539 annual hedged energy costs for a given NSLP. ACIL Allen has taken the 95th percentile of this distribution of hedged costs as the final estimate of the wholesale energy costs. Wholesale energy costs for new controlled load network tariffs Energy Queensland has proposed new controlled load network tariffs for 2020–25 in its latest Tariff Structure Statements (TSS)18: In the Energex area, it proposed a controlled load tariff for small business customers. Typical applications of this tariff are expected to be single large loads such as irrigation pumps and motors. In the Ergon area, it proposed controlled load tariffs for large business customers. These tariffs are expected to be suitable for connections where the nature of the operation (i.e. size of equipment, connection type, suitability for load control, etc.) is similar/identical to those of small customers on controlled load tariffs. Energy Queensland noted that the terms and conditions for these network tariffs will be set out in its pricing proposal (likely to be published in May or June 2020). ACIL Allen advised that estimating wholesale energy costs for a given tariff needs to be based on observable demand load data. At this stage, no information is available on the shape of the load associated with these new network tariffs or how Energex and Ergon intend to manage these loads. Therefore, ACIL Allen 18 Energex (2019c, 2019d), Ergon Energy (2019c, 2019d). 22
Queensland Competition Authority Appendix E: Energy cost approach considered that it is not possible to develop separate wholesale energy cost estimates for these new network tariffs at this stage. Our consideration—wholesale energy costs Our draft decision is to estimate the wholesale energy costs based on the advice from ACIL Allen (discussed in section 4.2.1). In developing its forecasts of demand profiles and generation supply/costs, ACIL Allen has used the latest available market data, including the uptake of rooftop solar PV, AEMO's latest peak demand and supply projections as well as market participants' formal announcements on generation availability/operation. We consider that such an approach adequately takes into account the likely variation in demand profiles and generation supply/costs within the NEM. We also note that ACIL Allen's approach has generated a distribution of spot prices for 2020–21 that is consistent with the distribution and variability of historical outcomes. This distribution covers a wide range of potential price outcomes that captures the extent and level of high spot price events consistent with those observed historically. Furthermore, ACIL Allen's spot price modelling broadly aligns with the market's expectations of spot price outcomes (ASX futures) for 2020–21. Generally, the purchase of ASX futures enables retailers to lock in a price, or a maximum price (in the case of caps), at which a given volume of electricity will be transacted at a future date. Therefore, futures contract prices incorporate market participants' risk-weighted expectations of future spot prices. To develop a hedging methodology, ACIL Allen tested a substantial number of strategies to derive a strategy with the lowest cost and variance. We consider such an approach to be appropriate as it is likely to reflect how a retailer would hedge in practice using ASX futures. To estimate wholesale energy costs, ACIL Allen has taken the 95th percentile of the distribution of 539 annual hedged energy costs for a given NSLP. We consider this is a conservative estimate given there is only a 5 per cent probability that the final estimate underestimates the energy costs that retailers face in the NEM. To conclude, we consider ACIL Allen's market hedging approach: adequately takes into account the issues raised in submissions is transparent and likely to produce reliable estimates that best reflect the actual costs retailers incur when purchasing electricity from the NEM. The Australian Energy Market Commission (AEMC) also endorsed such an approach in its 2013 advice on best practice retail regulation.19 We have also accepted ACIL Allen's advice on the matter of developing separate wholesale energy cost estimates for the new controlled load network tariffs (i.e. that it is not possible to develop separate estimates at this stage). 19 AEMC 2013. 23
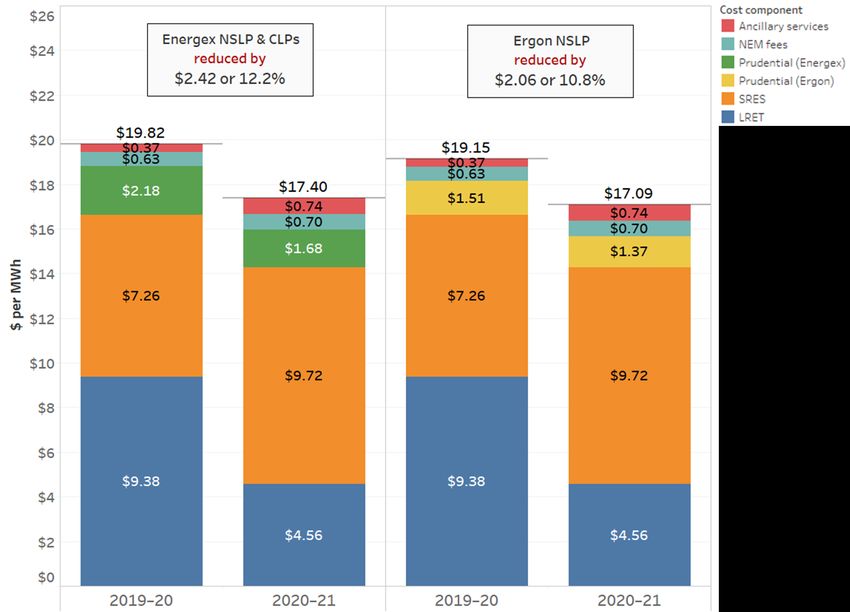
Queensland Competition Authority Appendix E: Energy cost approach Other energy costs In addition to wholesale energy costs, we need to account for other energy costs that retailers incur when purchasing electricity from the NEM: renewable energy target (RET) costs NEM management fees and ancillary services charges prudential capital costs. Our draft decision is to estimate other energy costs based on ACIL Allen's advice (discussed in section 4.2.1). Renewable energy target The RET scheme provides incentives for the electricity sector to increase generation from renewable sources and reduce greenhouse gas emissions. It consists of the large-scale renewable energy target (LRET) and small-scale renewable energy scheme (SRES). The costs of these incentives are paid by retailers through the purchase of large-scale generation certificates (LGCs) and small-scale technology certificates (STCs). LGCs or STCs can be created when eligible electricity is generated by utility-scale renewable generators or small-scale renewable systems. Retailers surrender the purchased LGCs and STCs to the Clean Energy Regulator (CER) to meet their obligations under the RET scheme. Large-scale renewable energy target The LRET sets annual targets for the amount of electricity that must be sourced from large-scale renewable energy projects, such as utility-scale wind and solar generation. The mandated LRET is 33,850 GWh for 2020, and 33,000 GWh for 2021.20 Retailers must purchase a set number of LGCs according to the: renewable power percentage (RPP) published by the CER amount of electricity they have acquired and sold to customers in the calendar year. To estimate the LRET costs, ACIL Allen has used a market-based approach by forecasting the expected average LGC prices and RPP values. Under this approach, LRET costs (in $/MWh) for the relevant calendar years were estimated by multiplying the expected average LGC prices and RPP values. The LRET cost for the financial year was derived by averaging the two calendar-year estimates. ACIL Allen estimated that the LRET cost for 2020–21 will be $4.56/MWh for all retail tariffs—a reduction of $4.82/MWh compared to the 2019–20 final determination. This reduction is mainly due to lower expected LGC prices. ACIL Allen's market based approach to estimating LRET costs uses the latest data, where available and appropriate. We consider such an approach is likely to produce the most reliable estimate of LRET costs to be incurred by retailers in 2020–21. Large-scale generation certificate prices The expected LGC prices were estimated using LGC forward prices21 provided by TFS Australia (an energy brokerage company). ACIL Allen estimated the expected LGC prices by averaging the forward prices traded over a two-year period prior to the commencement of the relevant calendar year (i.e. 2020 and 2021). This 20 Section 40, Renewable Energy (Electricity) Act 2000 (Cth). For more information, see http://www.cleanenergyregulator.gov.au. 21 Forward prices are predetermined prices for an underlying commodity, currency, or financial asset, as agreed between the buyer and seller of a forward contract, to be transacted at a future date. 24
Queensland Competition Authority Appendix E: Energy cost approach approach assumes that retailers build up their LGC coverage over two years to meet their obligations under the LRET scheme. ACIL Allen estimated the expected LGC prices to be $30.51/MWh for 2020 and $16.17/MWh for 2021. LGC forward prices have fallen since they were last estimated for the 2019–20 final determination. This reflects the market's expectation of an increase in supply of LGC due to: a number of renewable energy projects reaching financial close in recent months, with most of these projects expected to be commissioned during 2020 a surge in renewable investment driven by decreasing costs in renewable generation, greater demand for renewable power purchase agreements (PPAs) from corporate users and increased appetite of renewable investors to take on greater exposure to merchant risks22. ACIL Allen advised that the significantly lower average LGC forward prices for 2020 also reflect the market view that the LRET scheme is highly likely to be fully subscribed by 2020. The LGC forward market is an active market consisting of several brokers and trading platforms. As such, it provides a sound basis for estimating the value of LGCs. We consider that LGC forward pricing is likely to be the most reliable indicator of the current market consensus view of LGC costs that retailers will face to meet their obligations under the LRET scheme. Renewable power percentage As discussed, the RPP values dictate the number of LGCs that a retailer needs to purchase and surrender to the CER. To estimate the RPP, ACIL Allen used the mandated LRET targets (published by the CER) and its estimates of electricity acquisitions for 2020 and 2021. The RPP value was estimated by dividing the LRET target by the electricity acquisitions of liable entities. ACIL Allen's approach to calculating the RPP aligns with the CER's. The estimated RPPs are 19.61 per cent for 2020 and 19.44 per cent for 2021. Small-scale renewable energy scheme The SRES provides an incentive for individuals and small businesses to install eligible small-scale renewable energy systems—such as solar panel systems, small-scale wind systems, small-scale hydro systems, solar hot water systems and heat pumps. Customers installing these systems create STCs, which retailers must purchase and surrender to the CER to fulfil their obligations under the SRES. Similar to the LRET, retailers must purchase a set number of STCs according to the: small-scale technology percentage (STP) published by the CER amount of electricity they have acquired and sold to customers in the calendar year. ACIL Allen estimated the SRES costs by multiplying the expected STC price and the relevant calendar year STP. The SRES cost for the financial year was derived by averaging the two calendar-year estimates. The SRES cost for 2020–21 is estimated to be $9.72/MWh for all retail tariffs—an increase of $2.46/MWh compared to the 2019–20 final determination. This substantial increase is mainly driven by higher STPs, which reflect a higher uptake in small-scale renewable energy systems than previously estimated. ACIL Allen's approach to estimating SRES costs uses the latest market data, where available and appropriate. We consider such an approach is likely to produce the most reliable estimate of SRES costs to be incurred by retailers in 2020–21. 22 Merchant risks in this context refer to the financial risks associated with the exposure to movement of spot prices in the NEM. Generally, this type of risk can be managed through power purchase agreements. 25
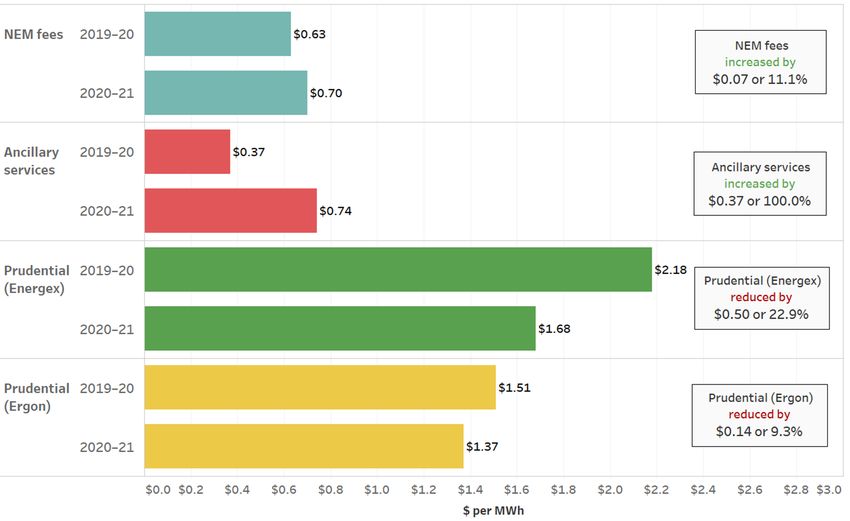
Queensland Competition Authority Appendix E: Energy cost approach

Small-scale technology certificates price
The expected STC price was based on the CER's clearing house price. The STC clearing house is operated by
the CER, and the clearing house price is currently fixed at $40 per STC (or per MWh of electricity generated
by eligible renewable systems).
Small-scale technology percentage
As discussed, the STP values dictate the number of STCs that retailers needs to purchase and surrender to
the CER. To estimate the STPs for the draft determination, ACIL Allen has updated the CER's published non-
binding STPs to reflect the most recent expected uptake in small-scale renewable energy systems and the
estimated carryover of surplus STCs of 8 million certificates from 2019. We consider such an approach could
potentially reduce the variation in the SRES cost estimates between the draft and final determinations,
noting that the CER updates the STPs in March 2020.
The estimated STPs are 26.42 per cent for 2020 and 22.15 per cent for 2021. These estimates are
substantially higher than the CER's non-binding STPs of 14.56 per cent for 2020 and 12.88 per cent for 2021.

NEM management fees and ancillary services charges
When purchasing electricity from the NEM, retailers incur fees to cover the costs of operating the NEM
and managing power system safety, security and reliability.
NEM management fees
NEM management fees are levied by AEMO to cover its costs related to operating the NEM, performing its
function as the National Transmission Planner, full retail contestability funding of Energy Consumers
Australia. ACIL Allen estimated the NEM fees using the budget and projected fees in AEMO's report on its
final budget and fees for 2019–20.23
ACIL Allen estimated that for 2020–21, NEM fees will be $0.70/MWh, an increase of $0.07/MWh, compared
to the 2019–20 final determination. This increase primarily reflects the higher costs that AEMO expects to
incur when managing the NEM. AEMO noted that increased complexities in managing the grid and the
changing nature of generation meant that further investment will be required to manage the NEM.24
Ancillary services charges
Ancillary services charges cover the costs of services used by AEMO to manage power system safety,
security and reliability. These services maintain key technical characteristics of the electricity grid, including
standards for frequency, voltage, network loading, and system restart processes. Ancillary services are
divided into three major categories—Frequency Control Ancillary Services (FCAS), Network Support Control
Ancillary Services (NSCAS) and System Restart Ancillary Services (SRAS).
ACIL Allen estimated the ancillary services charges using the average ancillary service payments25 observed
over the preceding 52 weeks.
For 2020–21, ancillary services charges were estimated to be $0.74/MWh, an increase of $0.37/MWh,
compared to the 2019–20 final determination. This substantial increase is due to several events leading to
a surge in demand for FCAS, including due to the Basslink interconnector outage (August 2019 to October
2019), the planned outage of the Heywood to Mortlake line (September 2019) and the 'islanding' of the
South Australian electricity grid due to an outage of the Heywood interconnector (November 2019).

23 AEMO 2019a.
24 AEMO 2019a.
25 AEMO provides data on weekly settlements for ancillary service payments in each interconnected region within the

 NEM.

 26
Queensland Competition Authority Appendix E: Energy cost approach Prudential capital costs Prudential capital costs are the costs that a retailer incurs to provide financial guarantees to AEMO and to lodge initial margins with the ASX in order to trade in futures contracts. ACIL Allen estimated prudential capital costs in line with the latest published AEMO requirements and margin requirements for trading in the ASX futures market. Prudential costs for customers, whose prices are settled on the Energex NSLP were estimated using the consumption profile of the Energex NSLP. These costs were also used as a proxy for the prudential costs of the Energex CLPs. Similarly, prudential costs of the Ergon NSLP were estimated using the consumption profile of the Ergon NSLP. Prudential costs have fallen since the 2019–20 final determination, largely driven by lower expected price volatility in the NEM. ACIL Allen estimated the 2020–21 prudential costs to be $1.68/MWh for the Energex NSLP (and CLPs) and $1.37/MWh for the Ergon NSLP. To estimate prudential costs, ACIL Allen aligned its methodologies with how retailers incur these costs in practice, taking into account AEMO's prudential requirements and the ASX's margin requirements. We consider such an approach to be appropriate as it enhances the accuracy of ACIL Allen's estimates and is likely to produce the most reliable estimates of prudential costs to be incurred by retailers in 2020–21. AEMO prudential costs When sourcing electricity from the NEM, a retailer is required to provide financial guarantees to AEMO. These financial guarantees (prudential obligations) are essential for AEMO to manage credit risks associated with a retailer's financial ability to meet its contractual obligations when purchasing electricity from the NEM. To determine the required prudential obligations, AEMO assesses and calculates a maximum credit limit (MCL) for each counterparty (or retailer in this context). ACIL Allen used the MCL, the relevant consumption profiles and the costs of funding a bank guarantee to estimate the AEMO prudential costs that a retailer is expected to incur. When estimating the AEMO prudential costs, ACIL Allen assumed that the retailer has no vertical integration (through generation ownership or PPAs) and does not engage in reallocation of prudential obligations. Reallocation is an AEMO procedure that allows counterparties to reduce their prudential obligations through instruments such as swaps or options. More details on ACIL Allen's approach are available in chapter 4 of its draft report. ACIL Allen estimated the 2020–21 AEMO prudential costs to be $0.46/MWh for the Energex NSLP (and CLPs) and $0.34/MWh for the Ergon NSLP. Hedge prudential costs Retailers are required to lodge initial margins with the ASX to trade in ASX futures contracts. These margins are essential for the ASX to manage risks associated with a retailer's financial ability to meet its contractual obligations when trading in futures. The costs of these margins (hedge prudential costs) must be accounted for, as ASX futures were relied upon to hedge spot price risks and derive the wholesale energy costs estimates. ACIL Allen estimated the hedged prudential costs considering: the costs of funding the margins—noting that the funds lodged as margins with the ASX receive a money market return which offsets some of the funding costs the ASX parameters which determine the initial margin—including the price scanning range, intra monthly spread charge and spot isolation rate for base, peak and cap contracts 27
Queensland Competition Authority Appendix E: Energy cost approach the annual average prices for base, peak and cap contracts the consumption profiles of the Energex and Ergon NSLP. An additional margin may apply when contract prices move in an unfavourable manner for the buyer or seller of ASX contracts. However, ACIL Allen did not provide an allowance for an additional margin, as it is assumed that favourable and unfavourable movements in contract prices will cancel each other out over time. More details on ACIL Allen's approach are available in chapter 4 of its draft report. ACIL Allen estimated the 2020–21 hedge prudential costs to be $1.22/MWh for the Energex NSLP (and CLPs) and $1.03/MWh for the Ergon NSLP. Summary of other energy costs Figure 7 Other energy costs—LRET and SRES (draft estimates) Source: Our analysis using data from ACIL Allen. Figure 8 Other energy costs—NEM fees, ancillary services and prudential costs (draft estimates) Source: Our analysis using data from ACIL Allen. 28
Queensland Competition Authority Appendix E: Energy cost approach Figure 9 Total other energy costs (draft estimates) Source: Our analysis using data from ACIL Allen. Energy losses Some electricity is lost when it is transported over transmission and distribution networks to customers. As a result, retailers must purchase additional electricity to allow for these losses when supplying customers. ACIL Allen has accounted for energy losses by applying the latest transmission and distribution loss factors published by AEMO in a manner that aligns with AEMO's NEM settlement process. These loss factors are: the average energy-weighted transmission loss factor—estimated by ACIL Allen, using the loss factors and energy consumed at each of the Transmission Node Identities (TNI) provided by AEMO the distribution loss factor published by AEMO. The calculated losses in ACIL Allen's draft report are based on AEMO's 2019–20 published loss factors, as loss factors for 2020–21 have not yet been published. ACIL Allen will update the loss factors using AEMO's 2020–21 loss factors in its final report. As noted in our main report, our draft decision is to estimate the energy losses based on ACIL Allen's advice. Given its alignment with AEMO's settlement process, we consider ACIL Allen's methodology is likely to best reflect the actual energy losses incurred by retailers. Total energy cost allowances for 2020–21 The chart below summarises the changes in total energy cost allowances for 2020–21. 29
Queensland Competition Authority Appendix E: Energy cost approach

Figure 10 Changes in total energy cost allowances (draft estimates)

Note: Totals may not add up precisely due to rounding.
Source: Our analysis using data from ACIL Allen.

 30
Queensland Competition Authority Appendix F: Cost pass-through approach APPENDIX F: COST PASS-THROUGH APPROACH This appendix provides further information on how we calculated the draft small-scale energy scheme (SRES) pass-through amounts (discussed in section 5.3). Our approach was to: estimate the under- over-recovery of SRES costs in 2019–20 make appropriate adjustments to the estimated under (over) recovery of SRES costs to determine the draft amounts to be passed-through in 2020–21 notified prices. Under- or over- recovery of SRES costs in 2019–20 First, we calculated the expected actual cost of SRES compliance during 2019–20, based on: the Clean Energy Regulator's (CER's) final small-scale technology percentage (STP) for 2019 and ACIL Allen's updated CER forecast of the STP for 2020, which reflects the most recent expected uptake in small-scale renewable energy systems and the estimated carryover of surplus small-scale technology certificates (STCs) from 2019. We then compared our estimate of the cost of SRES compliance to the SRES allowance in 2019–20 notified prices, which revealed an under-recovery of $2.372/MWh (0.2372 c/kWh). Table 3 2019–20 SRES under-recovery for all settlement classes Period STP Clearing SRES Average house price cost SRES cost Final Non- (per MWh)a (per MWh) (per MWh) binding 2019–20 final 1 Jul–31 Dec 2019 21.73% – $40.00 $8.692 $7.258 determination allowance 1 Jan–30 Jun 2020 – 14.56% $40.00 $5.824 2019–20 actual cost 1 Jul–31 Dec 2019 21.73% – $40.00 $8.692 $9.630 (expected) 1 Jan–30 Jun 2020 26.42%b – $40.00 $10.568 Under-recovery in 2019–20 (before adjusting for energy losses, the time value of money, variable retail $2.372 cost allocators, and standing offer adjustment/headroom) a Determined by the Clean Energy Regulator. b The CER is expected to determine its final 2020 STP in March 2020, which we will incorporate for our final determination. Note: For presentation purposes, figures in this table have been rounded, so they may not add, subtract or multiply exactly. SRES pass-through amounts for 2020–21 To estimate the appropriate pass-through amounts for each settlement class, we adjusted the estimated under-recovery of SRES costs to account for: energy losses (to determine the SRES liabilities based on energy acquired), by applying a loss factor for each settlement class to reflect transmission and distribution losses, using the loss factors applied in the 2019–20 determination the time value of money (to restore the real value of the under-recovered amounts), by applying a nominal weighted-average cost of capital of 6.8 per cent.26 the variable retail cost allocators and standing offer adjustment or headroom allowance (consistent with the manner these allowances were applied as part of the 2019–20 determination). 26 Based on QCA's latest internal analysis. 31
Queensland Competition Authority Appendix F: Cost pass-through approach

Table 4 SRES pass-through amounts by settlement class
 Energex net system load profile (NSLP)—residential and controlled load tariffs

 A SRES under-recovery in 2019–20 (c/kWh) 0.2372

 B Energy losses in 2019–20 (total loss factor) 1.065

 C Discount rate (time value of money) 6.80%

 D Under-recovery before the application of standing offer adjustment and variable retail cost 0.2698
 allowance (2020–21 c/kWh)

 E Variable retail cost allowance (residential) in 2019–20 (%) 11.27%

 F Standing offer adjustment in 2019–20 (%) 5.0%

 G SRES cost pass-through for 2020–21 (c/kWh) 0.3152

 Energex NSLP—small business and unmetered supply tariffs

 A SRES under-recovery in 2019–20 (c/kWh) 0.2372

 B Energy losses in 2019–20 (total loss factor) 1.0650

 C Discount rate (time value of money) 6.80%

 D Under-recovery before the application of standing offer adjustment and variable retail cost 0.2698
 allowance (2020–21 c/kWh)

 E Variable retail cost allowance (residential) in 2019–20 (%) 12.80%

 F Standing offer adjustment in 2019–20 (%) 5.0%

 G SRES cost pass-through for 2020–21 (c/kWh) 0.3195

 Ergon Energy NSLP—large business and street lighting tariffs

 A SRES under-recovery in 2019–20 (c/kWh) 0.2372

 B Energy losses in 2019–20 (total loss factor) 1.024

 C Discount rate (time value of money) 6.80%

 D Under-recovery before the application of headroom and variable retail cost allowance (2020–21 0.2594
 c/kWh)

 E Variable retail cost allowance (very large business) in 2019–20 (%) 6.0445%

 F Headroom allowance in 2019–20 (%) 5.0%

 G SRES cost pass-through for 2020–21 (c/kWh) 0.2888

 Ergon Energy NSLP—very large business tariffs

 A SRES under-recovery in 2019–20 (c/kWh) 0.2372

 B Energy losses in 2019–20 (total loss factor) 0.987

 C Discount rate (time value of money) 6.80%

 D Under-recovery before the application of headroom and variable retail cost allowance (2020–21 0.2500
 c/kWh)

 E Variable retail cost allowance (very large business) in 2019–20 (%) 6.0445%

 F Headroom allowance in 2019–20 (%) 5.0%

 G SRES cost pass-through for 2020–21 (c/kWh) 0.2784

Note: The SRES cost-pass through amounts were calculated using the formula: = × × (1 + ) × (1 + ) × (1 + ).

 32
Queensland Competition Authority Appendix G: Obsolete tariffs (customer impacts)

APPENDIX G: OBSOLETE TARIFFS (CUSTOMER IMPACTS)

Our draft decision on the arrangements for customers on obsolete retail tariffs is set out in chapter 4. This
appendix contains an analysis by Ergon Retail of bill impacts for customers moving from 2019–20 obsolete
tariffs to an alternative standard business tariff. The customer impacts are calculated on an individual tariff
basis. As some customers are supplied under multiple tariffs, the overall impact to an individual customer
may be a combination of the impacts shown below.

Tariff 20 (large)
Transitional tariff 20 (large) aligns with tariffs 44 to 53, which are based on Ergon Energy network tariffs
and charges.
Figure 11 Change in electricity bills for business customers on tariff 20 (large) moving to large customer
 standard business tariffs

 33
Queensland Competition Authority Appendix G: Obsolete tariffs (customer impacts)

Tariff 21
Tariff 21 is a declining block tariff that aligns with tariff 20 for small business customers.
Figure 12 Change in electricity bills for small business customers on tariff 21 moving to tariff 20

Tariff 22 (small and large)
Transitional tariff 22 (small and large) aligns with tariffs 20 for small business customers and tariffs 44 to 53
for large business customers, which are based on Ergon Energy network tariffs and charges.
Figure 13 Change in electricity bills for large business customers on tariff 22 (small and large) moving to
small customer standard tariffs

 34
Queensland Competition Authority Appendix G: Obsolete tariffs (customer impacts)

Figure 14 Change in electricity bills for large business customers on tariff 22 (small and large) moving
 to large customer standard business tariffs

Tariff 37
Tariff 37 is a business time-of-use tariff that aligns with tariffs 20 or 22A for small business customers and
one of tariffs 44 to 53 for large business customers.
Figure 15 Change in electricity bills for small business customers on tariff 37 moving to tariff 20

 35
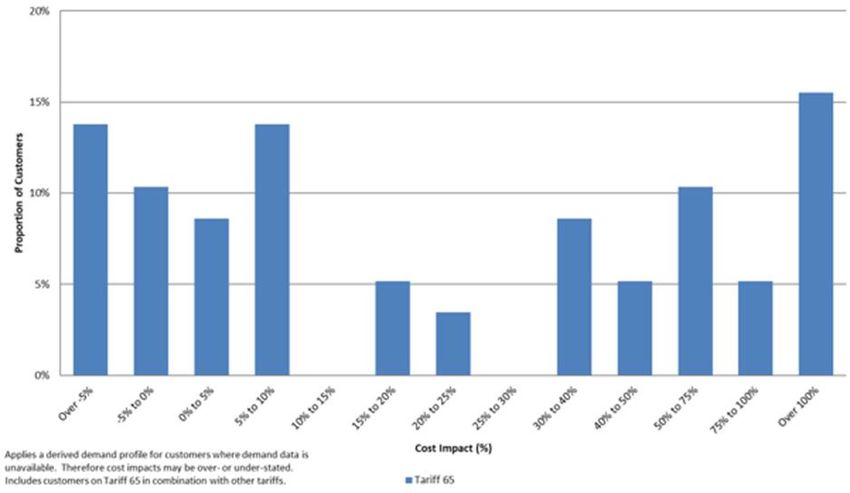
Queensland Competition Authority Appendix G: Obsolete tariffs (customer impacts)

Figure 16 Change in electricity bills for large business customers on tariff 37 moving to large customer
 standard business tariffs

Tariff 62 and 65
Tariffs 62 and 65 are time-of-use tariffs for farming and irrigation customers. These tariffs align with tariffs
20 or 22A for small business customers and tariffs 44 or 45 for large business customers.
Figure 17 Change in electricity bills for small business customers on tariff 62 moving to tariff 20

 36
You can also read