Joint Consultation Paper - WESTERN METROPOLITAN MELBOURNE TRANSMISSION CONNECTION AND SUBTRANSMISSION CAPACITY - Jemena
←
→
Page content transcription
If your browser does not render page correctly, please read the page content below
Joint Consultation Paper

 WESTERN METROPOLITAN
MELBOURNE TRANSMISSION
    CONNECTION AND
SUBTRANSMISSION CAPACITY

     10th February 2012
Contents

Executive Summary                                                           2

1      Purpose                                                              9

2      The need for investment                                             10
       2.1 Background                                                      10
       2.2 Emerging constraints at Keilor Terminal Station                 11
       2.3 Emerging distribution system constraints                        14
       2.4 Closing comments on the need for investment                     17

3      Investment Options                                                  18
       3.1 Regulatory test requirements                                    18
       3.2 Alternative options considered, and study horizon adopted       18
       3.3 Investment sequence and capital costs of network only options   24
       3.4 Non-network alternative options                                 26

4      Range of Reasonable Scenarios                                       33
       4.1 Regulatory test requirements                                    33
       4.2 Demand forecasts and value of unserved energy                   33
       4.3 Capital and operating costs of options                          35
       4.4 Market development scenarios                                    36
       4.5 Sensitivity Testing                                             36
       4.6 Summary of Reasonable Scenarios                                 38

5      Methodology and results of analysis                                 40
       5.1 Methodology and approach                                        40
       5.2 Results of the analysis                                         40
       5.3 Qualitative analysis of relevant considerations                 44

6      Conclusion                                                          44

7      Submissions                                                         45

Appendix 1: Network configuration following commissioning of
           DPTS in 2016                                                    47
Executive Summary
Background and Purpose
This regulatory test consultation paper has been prepared by the Australian Energy Market
Operator (AEMO), Jemena Electricity Networks (Jemena) and Powercor Australia
(Powercor) in accordance with the requirements of clause 5.6.2 of the National Electricity
Rules (“the Rules”).
The purpose of this document is to provide a basis for consultation (in accordance with
clause 5.6.2(f) of the Rules) on the credible options to address emerging network constraints
in the western Melbourne metropolitan area.
This regulatory test consultation paper:
• Describes the need that AEMO, Jemena and Powercor (“the NSPs”) are seeking to
address, and the assumptions applied in identifying that need.
• Describes and undertakes an economic assessment of the credible options that the
NSPs consider may address the identified need.
• Presents the analysis methodology and summarises the economic assessment results.
• Identifies the establishment of Deer Park Terminal Station by November 2016 as the
option that the NSPs currently consider maximises the present value of net economic
benefit to all those who produce, consume and transport electricity in the market.
The need for investment
Keilor Terminal Station (KTS) is one of the major terminal stations in the Melbourne
metropolitan area. It is located in the north west of greater Melbourne and it supplies a total
of approximately 600 MW of demand to around 210,000 customers, in the inner western and
north-western suburbs of Melbourne, as well as rural areas including Woodend, Sunbury,
Lancefield and Kyneton.
In the 2011 Transmission Connection Planning Report (TCPR) 1 , Jemena and Powercor
identified that, due to significant demand growth from residential, industrial and commercial
development to the west of Melbourne, action will be required to prevent loading distribution
and transmission connection assets beyond their thermal capabilities. Along with the TCPR
and further planning studies undertaken jointly by the NSPs, this regulatory test consultation
paper suggests that there are significant economic benefits associated with increasing the
transmission connection and subtransmission capacity – or reducing the loading on existing
network assets – in the western Melbourne metropolitan area.
Based on the latest available terminal station demand forecasts published by AEMO, the
2011 TCPR presented estimates of:
1
CitiPower, Jemena Electricity Networks, Powercor Australia, SP AusNet and United Energy Distribution.
“2011 Transmission Connection Planning Report”. Available from:
http://www.powercor.com.au/Electricity_Networks/Powercor_Network/Powercor_-_Network_Planning/.
Page 2• the energy at risk2 and expected unserved energy3 at KTS with one transformer out of
service for the 50th percentile demand forecast4;
• the hours per year that the 50th percentile demand forecast is expected to exceed the
N-1 capability rating at the station; and
• the value to consumers of the expected unserved energy for the 50th percentile demand
forecast.
The results of this analysis are shown in the figure below.
th
Figure 1: Energy at risk at KTS for the 50 percentile demand forecast
Annua l Energy and H our s at Risk a nd Expec ted C us tomer Va lue a t K TS
unde r (N-1) c ondition
Hours at Ris k (LH scale) Energy at Risk MWhrs (LH sc ale) Cus tomer V alue (RH scale)
25,000 $16, 000 k
$14, 000 k
20,000
$12, 000 k
M Whr at Risk / Ho urs at Risk
$10, 000 k
15,000
$8, 000 k
10,000
$6, 000 k
$4, 000 k
5,000
$2, 000 k
0 $0 k
2012 2013 2014 2015 2016 2017 2018 2019 2020 2021
Year
Based on the terminal station demand forecasts for KTS, the option assessments show that
action to address the capacity constraint at the station, prior to the summer of 2016/17, is
economically justified. In addition, action is economically justified over the next five years to
address constraints within the sub-transmission network in the KTS supply area.
2
“Energy at risk” is, for a given forecast of demand, the total energy that would not be supplied if: a major
outage of a transformer occurs at that station in a specified year; the outage has an expected duration of 2.6
months; and no other mitigating action is taken. This statistic provides an indication of the magnitude of loss
of energy that would arise in the unlikely event of a major outage of a transformer. The term “major outage”
is used throughout the TCPR to refer to an outage that has a mean duration of 2.6 months, typically due to a
significant failure within the transformer. The actual duration of an individual major outage may vary from
under 1 month up to 9 months. Further details are provided in section 4.4 of the 2011 TCPR.
3
“Expected unserved energy” is the energy at risk weighted by the probability of a major outage of a
transformer, where a “major outage” is defined as one that has a mean duration of 2.6 months. This statistic
provides an indication of the amount of energy that may be expected to be not supplied in a year, taking into
account the very low probability that one transformer at the station will be unavailable due to a major outage.
4 th
A 50 percentile, or 50% probability of exceedence (POE), demand refers to a demand level that is expected
th
to be exceeded once in every two year period. Similarly, a 10 percentile, or 10% POE, demand refers to a
demand level that is expected to be exceeded once in every ten year period.
Page 3In light of the growing demand at KTS and the forecast increase in load at risk, the NSPs
have examined a number of different options to increase capacity at the station and within
the associated sub-transmission network. These options are outlined below.
Options for addressing projected constraints
Through joint planning, the NSPs have examined a number of long term options to augment
the transmission connection and sub-transmission capacity in the KTS supply area. These
options include various alternative configurations of sub-transmission loop augmentations
along with different options for increasing transmission connection capacity at various
existing and / or new sites. The six options identified for further detailed study and
application of the regulatory test are:
• “Do nothing”: This option provides a point of reference for determining the total net
market benefit of each network option by presenting the expected involuntary load
shedding that would be required to manage network loading assuming there was no
network augmentation or non-network service provider action.
• Option 1: Establish a new Deer Park Terminal Station (for service by the end of
2016).
• Option 2: Install a sixth transformer at KTS and a fourth transformer at Altona
Terminal Station (ATS) for service by the end of 2016.
• Option 3: Install a fourth transformer at ATS for service by the end of 2016.
• Option 4: Engage non-network support services; specifically demand management
in the form of voluntary load curtailment to defer Option 1 by one year.
• Option 5: Establish and engage non-network support services; specifically in the
form of local generation to defer sub-transmission line augmentation and the
installation of a sixth transformer at KTS with all remaining augmentations as per
Option 2.
Net market benefits of options
Table 1 shows the estimated net market benefits of these options relative to the “Do nothing”
option over the period from 2012 to 2030, using central estimates for all variables.
Table 1: Summary of results – Base case cost-benefit analysis of options
(Net market benefits relative to “Do nothing” option in present value terms in $ million)
Total market benefit Total cost Net market benefit
Option 1 17,322 200 17,122
Option 2 17,311 230 17,081
Option 3 17,319 217 17,102
Option 4 17,309 194 17,115
Option 5 17,321 326 16,995
Page 4These results indicate the substantial net market benefits – in the form of large reductions in
expected unserved energy - delivered by all augmentation options, relative to the “Do
nothing” option. The results show that, assuming central estimates for all key variables,
Option 1 delivers the highest net market benefits.
Table 2 below shows the results of the comparative analysis of the augmentation options,
relative to Option 1. “Base case” denotes the use of central assumptions for all variables.
The net market benefit of each option (relative to Option 1) under the base case scenario is
shown in the first row of the table, and then results are presented reflecting the base case
changed for one variable only (in turn: demand growth rate, capital cost, network operating
costs, value of customer reliability and discount rate). The shaded cell in each row indicates
the option that maximises net market benefit for that particular set of assumptions.
Table 2: Summary of results- Sensitivity testing of individual variables
(Net market benefits relative to Option 1 in present value terms in $ million)
Option 1 Option 2 Option 3 Option 4 Option 5
Base Case 0 -41.3 -20.6 -7.5 -127.3
Demand forecast sensitivity
Lower bound (base annual
growth rate reduced by 15%)
0 -29.6 -29.5 -0.5 -95.1
Capital cost sensitivity
Upper Bound (Base + 30%) 0 -50.4 -25.8 -5.2 -116.9
Lower Bound (Base - 30%) 0 -32.2 -15.3 -9.8 -137.7
Operating cost sensitivity
Upper Bound (Base + 50%) 0 -42.0 -21.0 -7.0 -125.4
Lower Bound (Base - 50%) 0 -40.7 -20.1 -7.9 -129.1
Value of customer reliability
Upper Bound ($69,000 / MWh) 0 -42.3 -21.0 -9.2 -126.8
Lower Bound ($51,000 / MWh) 0 -40.3 -20.1 -5.7 -127.7
Discount rate sensitivity
Upper Bound (12% real) 0 -25.9 -13.6 -3.4 -75.0
Lower Bound (6% real) 0 -52.0 -25.4 -10.1 -164.4
Examination of the sensitivity of net market benefits to changes in individual variables
(shown in Table 2 above) is a precursor to full sensitivity testing involving different
combinations of assumptions on all key variables. Table 2 shows that Option 1 is
consistently the superior option when changes to individual variables are introduced.
Table 3 below sets out a comparison of the present value of net market benefits of each
option for different combinations of assumptions applied under various scenarios. Seven
scenarios are presented: the “base case” or most likely scenario, and six other scenarios,
which represent plausible combinations of upper and lower bound assumptions on the key
variables of demand growth, capital cost, operating cost, value of customer reliability and
discount rate. The shaded cell in each row indicates the option that maximises net market
benefit for that particular scenario.
Page 5Table 3: Summary of results - Economic evaluation of options under various scenarios
5
(Net market benefits relative to Option 1 in present value terms in $ million)
Scenario Option 1 Option 2 Option 3 Option 4 Option 5
Base Case 0 -41.3 -20.6 -7.5 -127.3
Scenario A
• Central demand growth
• Upper bound capital cost 0 -51.3 -26.4 -4.6 -114.4
• Upper bound operating cost
• Central VCR estimate
• Central discount rate
Scenario B
• Central demand growth
• Upper bound capital cost 0 -63.6 -32.0 -5.6 -152.5
• Upper bound operating cost
• Lower bound VCR estimate
• Lower bound discount rate
Scenario C
• Central demand growth
• Lower bound capital cost 0 -38.5 -18.0 -10.4 -176.0
• Lower bound operating cost
• Lower bound VCR estimate
• Lower bound discount rate
Scenario D
• Lower bound demand growth
• Upper bound capital cost 0 -36.6 -38.9 2.4 -78.8
• Upper bound operating cost
• Central VCR estimate
• Central discount rate
Scenario E
• Lower bound demand growth
• Upper bound capital cost 0 -48.2 -46.0 1.0 -114.2
• Upper bound operating cost
• Lower bound VCR estimate
• Lower bound discount rate
Scenario F
• Lower bound demand growth
• Lower bound capital cost 0 -28.9 -24.0 -3.9 -144.5
• Lower bound operating cost
• Lower bound VCR estimate
• Lower bound discount rate
The results set out in Table 2 and Table 3 show that:
5
It should be noted that cost estimates for the non-network solutions, Options 4 and 5, are indicative-only, as
a non-network proposal has not yet been received. This consultation exercise provides non-network
proponents with a further opportunity to develop cost effective proposals.
Page 6• Option 1 maximises net market benefit under the base case set of assumptions; and
• Option 1 maximises net market benefits in the majority of sensitivity tests and scenario
analyses involving the variation of assumptions within plausible limits.
• Option 4 only provides maximum benefits if there is a combination of lower demand
growth and higher capital cost. This indicates that if demand is 15% per annum less
than forecast and capital costs are 30% higher, there may be scope for deferring the
DPTS project one year.
The impact on net market benefits of deferring the proposed augmentation was examined.
That examination confirms that under base case assumptions:
• Option 1 has the highest net market benefit of all options, regardless of whether the
augmentation is delivered in 2016 or deferred for one year; and
• Commissioning Option 1 in 2016 will maximise net market benefits.
Examination of the impact on net market benefits of reduced demand forecasts – a reduction
of 15% from the annual growth rate assumed in the base case – also confirmed that
commissioning Option 1 in 2016 will maximise net market benefits.
A qualitative assessment of options against a number of considerations also suggests that
Option 1 is the superior option. In particular:
• Option 1 requires the lowest amount of new line work construction in established
residential and park land areas, thereby reducing community and environmental impacts;
and
• Option 1 places transformation capacity closer to the load earlier than other options, and
therefore delivers additional benefits in terms of reduced losses.
Description of the proposed project
The proposed project involves constructing a new terminal station at Deer Park (DPTS) with
two 150 MVA 220/66 kV transformers and six 66 kV exits on an existing site owned by
SP AusNet, at the corner of Christies Road and Riding Boundary Road, Ravenhall by
November 2016. The key elements in the proposed project are as follows:
• Connection of DPTS to the Keilor Terminal Station (KTS)-Geelong Terminal Station
(GTS) No. 2 220 kV line.
• Connection to DPTS of a new zone substation Truganina (TNA) at 66/22kV.
• Transferring 66/22kV zone substations Melton (MLN) and Sunshine (SU) to DPTS, and
the construction of a second KTS to Sunbury zone substation (SBY) 66 kV line to relieve
overloads at KTS and on the existing KTS-SBY, KTS to Sydenham zone substation
(SHM) and KTS-MLN 66 kV looped lines.
Page 7Submissions
In accordance with the consultation requirements in clause 5.6.2(f) of the Rules, interested
parties are invited to provide submissions to the following address by: 26th March 2012
Neil Watt,
Manager Network Strategy,
Powercor Australia Limited,
Locked Bag 14090,
Melbourne 8001
Email: NWatt@citipower.com.au
Submissions will be published on the AEMO, Jemena and Powercor websites. If you do not
want your submission to be publicly available please clearly stipulate this at the time of
lodgement.
Further details in relation to this project can be obtained from:
Jason Pollock Tan Bui
Senior Engineer Senior Planning Engineer
Network Planning Asset Strategy
AEMO Jemena
Phone: (03) 9609 8386 Phone: (03) 8544 9589
Email: Jason.Pollock@aemo.com.au Email: Tan.Bui@jemena.com.au
Rob Ingram
Team Leader
Network Planning
Powercor
Phone: (03) 8363 8306
Email: RIngram@powercor.com.au
Page 81 Purpose
This regulatory test consultation paper has been prepared by the Australian Energy Market
Operator (AEMO), Jemena Electricity Networks (Jemena) and Powercor Australia
(Powercor) in accordance with the requirements of National Electricity Rules (“the Rules”)
clause 5.6.2.
In Victoria, the Distribution Businesses (“the DBs”) are responsible for planning and directing
augmentation of their distribution networks and the connection assets that connect their
networks to the transmission network, known as the Declared Shared Network (DSN).
AEMO is responsible for planning and directing augmentation of the Victorian DSN.
This paper sets out the results of the technical and economic studies undertaken by AEMO,
Jemena and Powercor (“the NSPs”) to assess options to alleviate projected distribution and
transmission connection asset constraints in the western Melbourne metropolitan area.
As part of the regulatory test process, and pursuant to clause 5.6.2(f) of the Rules, the
purpose of this document is to provide a basis for consultation, with registered participants
and interested parties, on the possible options to address emerging constraints in the
western Melbourne metropolitan area.
The regulatory test is a form of cost-benefit analysis for assessing alternative investment
options. The current version of the test (version 3) comprises two limbs:
the ‘reliability limb’, where investment is targeted to achieve mandated network
performance requirements; and
the ‘market benefits limb’, where investment is targeted to deliver the maximum net
benefit to the market.
The investment options for the western Melbourne metropolitan area have been assessed in
accordance with the market benefits limb of the regulatory test. Clause (1)(b) of the
regulatory test states that an option satisfies this limb of the test if:6
“the option maximises the expected net economic benefit to all those who produce, consume
and transport electricity in the national electricity market compared to the likely alternative
option/s in a majority of reasonable scenarios. Net economic benefit equals the market
benefit less costs.”
This regulatory test consultation paper:
• Describes the need that AEMO, Jemena and Powercor (“the NSPs”) are seeking to
address, and the assumptions applied in identifying that need.
• Describes and undertakes an economic assessment of the credible options that the
NSPs consider may address the identified need.
• Presents the analysis methodology and summarises the economic assessment results.
6
Clause 1 of Version 3 of the regulatory test as published by the Australian Energy Regulator in its Final
Decision: Regulatory Test version 3 and in the accompanying Application Guidelines, in November 2007.
Page 9• Identifies the establishment of Deer Park Terminal Station by November 2016 as the
option that the NSPs currently consider maximises the present value of net economic
benefit to all those who produce, consume and transport electricity in the market.
2 The need for investment
2.1 Background
Keilor Terminal Station (KTS) is one of the major terminal stations in the Melbourne
metropolitan area. It is located in the north west of greater Melbourne and it supplies a total
of approximately 600 MW of demand to around 210,000 customers, in the inner western and
north-western suburbs of Melbourne, as well as rural centres including Woodend, Sunbury,
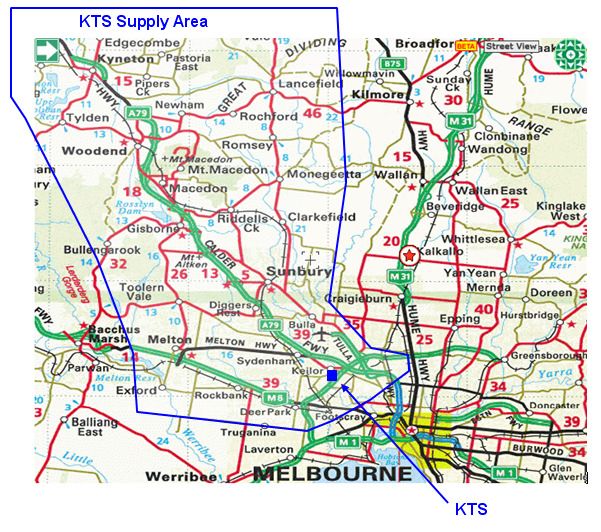
Lancefield and Kyneton. The geographic area supplied from KTS is depicted in the map
below.
Figure 2: Area supplied from Keilor Terminal Station
KTS comprises five 150 MVA transformers. Four of the transformers are split across two
groups that are connected by three 66 kV line loops across an open 66 kV bus tie circuit
Page 10breaker. The fifth transformer operates as a “hot standby”7 unit and can connect to either
bus group, as required, following loss of one of the other four transformers. By May 2012,
the fifth transformer is planned to be permanently connected onto load by the creation of a
fifth 66 kV bus at KTS and 66 kV loop rearrangements. Once these works are completed,
the station will essentially be comprised of two separate transformer groups, as follows:
• A two transformer group comprised of the B3 and B4 transformers will supply the
St Albans, Melton, Sydenham, Sunbury and Woodend areas.
• A three transformer group comprised of the B1, B2 and B5 transformers will supply
the Melbourne Airport, Airport West, Pascoe Vale, Essendon, Braybrook and
Sunshine areas.
Under these arrangements, the loss of a transformer on the B3 and B4 transformer group
will be automatically replaced by one of the transformers on the other group. Automatic
switching arrangements are not in place for the loss of one of the three transformers in the
B1, B2 and B5 transformer group.
For the period prior to this project being completed, Jemena and Powercor will, under high
load conditions, temporarily transfer load away and re-configure the station to enable the B5
transformer to take load under system normal conditions. The reconfiguration will increase
the N rating of the station by opening 66 kV line loops across buses and temporarily
supplying three zone substations on single radial lines. This reconfiguration is required to
limit the maximum prospective fault levels, or short circuit current, on the existing four 66 kV
buses to within switchgear ratings. The operational effect of the temporary station
reconfiguration will be similar to the permanent splitting of the station into two groups, as
described above.
In addition to the fifth transformer project described above, Powercor and Jemena8 plan to
direct the installation of a 100 MVAr capacitor bank at the station by the summer of 2013/14.
The proposed capacitor bank will improve the power factor and reduce transformer load at
the station. The analysis of emerging constraints at KTS, which is presented below,
assumes that the proposed 100 MVAr capacitor bank is installed by the summer of 2013/14.
2.2 Emerging constraints at Keilor Terminal Station
Demand for electricity within the area supplied by KTS is undergoing significant growth due
to the expansion of residential, industrial and commercial development to the west of
Melbourne. In particular there are new large information technology loads in the form of
several data centres proposed for the Sunshine area. The need to address emerging
constraints at KTS has been identified in the 2011 TCPR and in previous TCPRs.
Based on the latest available terminal station demand forecasts published by AEMO, the
2011 TCPR presented estimates of:
7
A transformer that is connected as a “hot standby” unit generally has one side of the transformer
disconnected from the network, such that it does not normally carry any load, to limit the maximum
prospective fault level, or short circuit current contribution, that would result immediately following a network
fault condition. Following loss of a parallel transformer, the hot standby transformer can be seamlessly
connected to carry load. The result is that the station’s N-1 rating will match its N rating.
8
These DBs are responsible for planning and directing the augmentation of the transmission connection
facilities at KTS.
Page 11• the energy at risk9 and expected unserved energy10 at KTS with one transformer out of
service for the 50th percentile demand forecast;
• the hours per year that the 50th percentile demand forecast is expected to exceed the
N-1 capability rating at the station; and
• the value to consumers of the expected unserved energy for the 50th percentile demand
forecast.
The results of this analysis are shown in the figure below.
th
Figure 3: Energy at risk at KTS (assuming a 50 percentile demand)
Annua l Energy and H our s at Risk a nd Expec ted C us tomer Va lue a t K TS
unde r (N-1) c ondition
Hours at Ris k (LH scale) Energy at Risk MWhrs (LH sc ale) Cus tomer V alue (RH scale)
25,000 $16, 000 k
$14, 000 k
20,000
$12, 000 k
M Whr at Risk / Ho urs at Risk
$10, 000 k
15,000
$8, 000 k
10,000
$6, 000 k
$4, 000 k
5,000
$2, 000 k
0 $0 k
2012 2013 2014 2015 2016 2017 2018 2019 2020 2021
Year
The 2011 TCPR noted that once the permanent station reconfiguration is completed in May
2012, there will be sufficient capacity at the station to supply all customer demand until 2017
under system normal conditions (that is, all transformers in service) for the 50th percentile
demand forecast. However from 2012 onwards, for a major outage of one transformer at
KTS over the summer peak load period, there would be insufficient capacity at the station to
supply all customer demand.
By summer 2016/17 (depicted as 2017 in Figure 3), the energy that would not be supplied
under system normal (N condition) and a transformer outage (N-1 condition) on the KTS
transformer groups is estimated to be 3.2 MWh and 10,128 MWh respectively for the 50th
percentile demand forecast. Over the summer 2016/17 period, there would be insufficient
capacity to meet demand for about 1 hour and 222 hours in that year under N and N-1
9
“Energy at risk” is, for a given forecast of demand, the total energy that would not be supplied if: a major
outage of a transformer occurs at that station in a specified year; the outage has an expected duration of 2.6
months; and no other mitigating action is taken. This statistic provides an indication of the magnitude of loss
of energy that would arise in the unlikely event of a major outage of a transformer.
10
“Expected unserved energy” is the energy at risk weighted by the probability of a major outage of a
transformer, where a “major outage” is defined as one that has a mean duration of 2.6 months. This statistic
provides an indication of the amount of energy that may be expected to be not supplied in a year, taking into
account the very low probability that one transformer at the station will be unavailable due to a major outage.
Page 12conditions respectively. The estimated value to consumers of the 3.2 MWh and
10,128 MWh of the energy not supplied is approximately $192,000 and $607.7 million
respectively (based on a value to customer reliability of $60,000 per MWh)11.
In other words, at the 50th percentile summer demand level, and in the absence of any other
operational response that might be taken to mitigate impacts on customers:
• under system normal conditions over the summer of 2016/17, insufficient capacity at
KTS would be expected to lead to involuntary supply interruptions that would cost
consumers $192,000; and
• a major outage of one transformer at KTS over the summer of 2016/17 would be
anticipated to lead to further involuntary supply interruptions that would cost
consumers $607.7 million.
It is emphasised however, that the probability of a major outage of one of the five
transformers is very low, at about 1.0% per transformer per annum, whilst the expected
unavailability per transformer per annum is 0.217%. When the energy at risk (10,128 MWh)
is weighted by this low transformer unavailability, the expected unserved energy (for loss of
one transformer) is estimated to be around 109.7 MWh. Combining this with the energy that
would not be supplied (3.2 MWh) under system normal conditions, the total expected
unserved energy is estimated to have a value to consumers of around $6.8 million.
It should also be noted that the above estimates are based on an assumption of average
(50th percentile) summer temperatures occurring in each year. If summer temperatures are
higher, customer demand will increase significantly due to air conditioning loads. At the 10th
percentile demand forecast, the energy that would not be supplied in the summer of 2016/17
for N and N-1 conditions is estimated to be 916.3 MWh and 15,335 MWh respectively. The
estimated cost to consumers of this unserved energy in the summer of 2016/17 for N and N-
1 conditions is approximately $55.0 million and $920.1 million respectively. The total
corresponding value of the expected unserved energy is approximately $65 million.
These key statistics for the summer of 2016/17 under N and N-1 outage conditions are
summarised in the table below.
The overall probability-weighted expected unserved energy considers the probability of a
transformer outage combined with a 33% weighting on the 10th percentile demand and a
67% weighting on the 50th percentile demand, as described in section 4.2.
11
The value of unserved energy is derived from the sector values given in Table 2-1 of the 2011 Victorian
Annual Planning Report, weighted in accordance with the composition of the load, by sector, at KTS.
Page 13Table 4: Summary of analysis of energy at risk and expected unserved energy
at KTS for summer 2016/17
MWh Valued at consumer
interruption cost
th
Energy not supplied at 50 percentile demand forecast
3.2 $192,973
under N condition
Energy at risk, at 50th percentile demand forecast under N-
10,128 $607.7 million
1 outage condition
Expected unserved energy at 50th percentile demand
109.7 $6.6 million
under N-1 outage condition
th
Total expected unserved energy at 50 percentile demand
112.9 $6.8 million
for N and N-1 conditions
th
Energy not supplied at 10 percentile demand forecast
916.3 $55.0 million
under N condition
th
Energy at risk, at 10 percentile demand forecast under N-
15,335 $920.1 million
1 outage condition
th
Expected unserved energy at 10 percentile demand under
166.1 $10.0 million
N-1 outage condition
th
Total expected unserved energy at 10 percentile demand
1,082.4 $65.0 million
for N and N-1 conditions
Overall probability-weighted expected unserved energy 432.8 $26.0 million
2.3 Emerging distribution system constraints
The Jemena 2011 Distribution System Planning Report (DSPR) identified that there are
emerging constraints over the five-year (2012-2016) distribution planning period for the KTS-
SHM, KTS-SBY and KTS-MLN 66 kV sub-transmission lines forming the KTS-MLN-
SBY(WND)-SHM-KTS loop system. The KTS-MLN-SBY(WND)-SHM-KTS 66 kV sub-
transmission loop supplies zone substations Melton (MLN), Woodend (WND), Sunbury
(SBY) and Sydenham (SHM) from Keilor Terminal Station (KTS). The DSPR outlined that12:
• the most critical line on the KTS-MLN-SBY(WND)-SHM-KTS 66 kV sub-transmission
loop is the KTS-SBY 66 kV line under the first order contingency condition of loss of the
KTS-SHM 66 kV line. The KTS-SBY 66 kV line is made up of a combination of steel,
aluminium with steel reinforcement, all aluminium and copper conductors. Therefore it is
tentatively planned to reconductor this line with the standard 37/3.75 AAC towards the
end of the five year (2012-2016) distribution planning period; and
• Jemena and Powercor, in conjunction with AEMO are currently investigating the future
plan for supplying the Western Melbourne Region. The preferred option under review
involves the transfer of zone substation MLN to the new Deer Park Terminal Station
which would remove the contingent risk load from the KTS-SBY(WND)-SHM-KTS loop.
12
Jemena Electricity Networks,2011 Distribution System Planning Report. The report is available at:
http://jemena.com.au/Assets/What-We-Do/Assets/Jemena-Electricity-
Network/Planning/Distribution%20System%20Planning%20Report%202011.pdf
Page 14Recent joint planning studies (which extend to 2030) completed by Jemena, Powercor and
AEMO have confirmed the need to address emerging constraints on the KTS-MLN-
SBY(WND)-SHM-KTS 66 kV sub-transmission loop.
The results of recent studies for the 50th percentile demand forecast are outlined below.
Figure 4 depicts the energy not supplied under system normal condition for the 50th
percentile demand forecast, and the hours per year that the 50th percentile demand forecast
is expected to exceed the N capability rating. The line graph shows the value to consumers
of the energy that would not be supplied in each year, for the 50th percentile demand
forecast.
Figure 4: Energy not supplied at KTS-MLN-SBY(WND)-SHM-KTS 66kV sub-transmission loop
th
under N condition (assuming a 50 percentile demand)
Annual Energy, Hours at Risk and Expected Customer Value at KTS-MLN-
SBY-(WND)-SHM-KTS loop under system normal condition
Energy not supplied above N (LHS) Hours above N (LHS) Consumer value (RHS)
12,000 $700,000 k
MWHr not supplied / Hours above N (hrs)
$600,000 k
10,000
$500,000 k
8,000
$400,000 k
6,000
$300,000 k
4,000
$200,000 k
2,000
$100,000 k
0 $0 k
2012 2013 2014 2015 2016 2017 2018 2019 2020 2021
Year
Figure 5 depicts the energy at risk with one line out of service (N-1 condition) for the 50th
percentile demand forecast, and the hours per year that the 50th percentile demand forecast
is expected to exceed the N-1 capability rating. The line graph shows the value to
consumers of the expected unserved energy in each year, for the 50th percentile demand
forecast.
Page 15Figure 5: Energy at risk at KTS-MLN-SBY(WND)-SHM-KTS 66kV sub-transmission loop under
th
N-1 condition (assuming a 50 percentile demand)
Annual Energy, Hours at Risk and Expected Customer Value at KTS-MLN-
SBY-(WND)-SHM-KTS loop under (N-1) condition
Energy at risk above N-1 (LHS) Hours at risk above N-1 (LHS) Consumer value (RHS)
60,000 $12,000 k
MWHr at Risk / Hours at Risk (hrs)
50,000 $10,000 k
40,000 $8,000 k
30,000 $6,000 k
20,000 $4,000 k
10,000 $2,000 k
0 $0 k
2012 2013 2014 2015 2016 2017 2018 2019 2020 2021
Year
As shown in Figure 4, there will be sufficient capacity on the loop to supply all customer
demand until 2018 under system normal condition for the 50th percentile demand forecast.
However, Figure 5 shows that from 2012 onwards, for a line outage over the summer peak
load period, there would be insufficient capacity on the remaining lines to supply all customer
demand.
By summer 2016/17 (depicted as 2017 in Figure 5), the energy at risk under a line outage
(N-1 condition) is estimated to be 12,316 MWh for the 50th percentile demand forecast. Over
the summer 2016/17 period, there would be insufficient capacity to meet demand for about
798 hours in that year for an N-1 condition. The estimated value to consumers of the 12,316
MWh of the energy at risk is approximately $739 million (based on a value to consumer
reliability of $60,000/MWh).
It is emphasised however that the probability of a line outage is low, at about 0.093 faults per
km per annum, whilst the expected unavailability per line per annum is 0.2128%. When the
energy at risk is weighted by this low line unavailability, the expected unserved energy (for
the entire loop) is estimated to be around 32.7 MWh. The total expected unserved energy is
estimated to have a value to consumers of around $2 million.
These key statistics for the summer of 2016/17 under N-1 outage condition are summarised
in the table below.
Table 5: Summary of analysis of energy risk and expected unserved energy at KTS-MLN-
SBY(WND)-SHM-KTS 66kV sub-transmission loop for summer 2016/17
MWh Valued at consumer
interruption cost
th
Energy at risk, at 50 percentile demand forecast under N-
12,316 $739 million
1 outage condition
th
Expected unserved energy at 50 percentile demand under
32.7 $1.97 million
N-1 outage condition
Page 162.4 Closing comments on the need for investment
Terminal station demand forecasts for KTS indicate that by the summer of 2016/17, there
will be a risk of substantial involuntary supply interruption due to inadequate capacity at the
station. In addition, action is economically justified over the next five years to address
constraints within the sub-transmission network in the KTS supply area.
In light of the growing demand at KTS and the forecast increase in load at risk, the NSPs
have examined a number of different options to increase capacity, or reduce loading, at
Keilor and within the associated sub-transmission network. These options are outlined in
section 3.
Page 173 Investment Options
3.1 Regulatory test requirements
The market benefits limb of the regulatory test requires the assessment of a proposed
investment option relative to a number of alternative options, where the term “alternative
option” is defined as:13
(a) a genuine alternative to the option being assessed, in that it:
(i) delivers similar outcomes to those delivered by the option being assessed; and
(ii) would become operational in a similar timeframe to the option being assessed;
(b) a practicable alternative to the option being assessed in that it is technically feasible.
In determining whether an alternative option is likely, a network service provider must
consider a range of matters, including whether the alternative option has a genuine
proponent and whether it is commercially feasible.14 However, the absence of a proponent
will not in itself exclude a project from being a likely alternative option for the purpose of the
regulatory test.15
Clause 11 of the regulatory test requires the NSPs to consider whether any option provides
other services in addition to prescribed network services. In cases where other services are
also provided, the regulatory test requires a particular treatment of the ‘other service’
component of the investment. It should be noted, however, that all of the options (described
below) to address the emerging constraints in the western Melbourne metropolitan area only
provide prescribed transmission and distribution services.
3.2 Alternative options considered, and study horizon adopted
A number of long-term options to augment transmission connection and sub-transmission
capacity in the western Melbourne metropolitan area have been identified and assessed to
varying levels. These options include various alternative configurations of sub-transmission
loop augmentations along with different options for increasing or offloading transmission
connection capacity at various existing and/or new sites. The options examined included the
following:
• establishing a new terminal station at Deer Park;
• installing a sixth transformer at KTS and a fourth transformer at Altona Terminal
Station (ATS) with load then being transferred away to ATS and Brooklyn Terminal
Station (BLTS);
• installing a fourth transformer at ATS with load then being transferred away to ATS
and BLTS;
13
Clause 16 of the Regulatory Test.
14
Clause (17)(b) and (17)(c) of the Regulatory Test. The extent to which an alternative option is commercially
feasible is to be demonstrated by determining whether an objective operator, acting rationally according to
the economic criteria prescribed by this test, would be prepared to construct or provide the alternative option.
15
Clause (17)(b) of the Regulatory Test.
Page 18• installation of connection asset transformation capacity at the existing Sydenham
Terminal Station site;
• construction of a new terminal station at Tarneit;
• construction of a new terminal station at Truganina;
• installation of a third transformer at BLTS;
• engagement of non-network support services; specifically demand management in
the form of voluntary load curtailment to defer the establishment of new Deer Park
Terminal Station; and
• establishment and engagement of non-network support services; specifically in the
form of local generation on the sub-transmission KTS-SBY-MLN loops to defer the
installation of a 6th transformer at KTS whilst retaining a new 4th transformer at ATS
with load transferred away from KTS to BLTS as per the second dot point above.
Following initial assessment, some of these options (described below) were not studied in
further detail, because their costs were assessed as being considerably higher than other
options:
• Development of a new station at Sydenham was excluded from further detailed
examination because Sydenham is not located in the proximity of the metropolitan
growth area. This option would therefore require additional 66 kV line work
compared to other options, and it would involve the installation of expensive
500/220 kV transformation before connection assets could be installed.
• Development of a new station at Tarneit was not examined in further detail because it
would be located further away from the northern growth corridor than other options,
and it would therefore require the installation of considerably more 66 kV lines to
supply zone substations Melton (MLN) and Sunshine (SU).
• Development of a new Truganina Terminal Station was not examined further as it
would require expensive 500/220 kV transformation or costly 220 kV line diversion
work from the existing Keilor to Geelong line easement. This option would cost
considerably more than the options included in this regulatory test assessment.
• Augmentation of Brooklyn Terminal Station (BLTS) was not examined in further detail
because the installation of a third transformer after completion of the rebuild of the
station in 2012 would require the existing 66 kV loops to ATS to return to BLTS at a
cost of $32 million, in addition to the costs of Option 3 (described in Table 6 below).
Table 6 details the alternative network options that the NSPs consider to be credible options
for addressing the emerging constraints.
For the purpose of evaluating the costs and net market benefits of each option, a study
horizon of 19 years (to 2030) was adopted. It is noted that from 2030 onwards:
• future investment requirements are expected to be unaffected by the choice of
alternative options today; and
• all the alternative options (apart from “Do nothing”) are expected to deliver
comparable levels of network service and reliability.
Page 19Therefore, the costs and benefits delivered under all the alternative options from 2030 can
be considered to be comparable. In view of the uncertainty associated with projecting
network performance and investment requirements beyond 2030, and the effect of applying
a discount rate to cash flows occurring at that time, all costs and benefits accruing beyond
2030 have been excluded from the analysis of net market benefits.
Each of the alternative options assessed under this application of the Regulatory Test
include investments from 2016 to 2030. This is necessary in order to identify the
investments in the short-term which will be the most efficient over the long-term. However
this Regulatory Test application is being used to justify the initial investments only. The
NSPs will continue to work together to identify the optimal timing of the subsequent
investments at the appropriate time using the latest available information.
Page 20Table 6: Network only options for addressing emerging constraints in the KTS supply area
Indicative capital cost
Option
Description in present value terms at
8% real discount rate
“Do nothing” This option provides a point of reference for determining the total net market benefit of each network option. Zero
Option 1: This option involves the establishment of new terminal station at Deer Park (DPTS) by November 2016 including: $187.4 million
Establish Deer • two 150 MVA 220/66 kV transformers and six 66 kV exits at DPTS
Park Terminal
Station • connection to KTS-Geelong Terminal Station (GTS) No.2 220 kV line
• construction of 66 kV lines to connect new zone substation Truganina (TNA) to DPTS
• construction of 66 kV lines to transfer existing zone substations Melton (MLN) and Sunshine (SU) to DPTS
• construction of a second KTS-Sunbury zone substation (SBY) 66 kV line to relieve overloads at KTS and on the
KTS-SBY-SHM-MLN 66 kV loops
Installation of third transformer at DPTS by November 2018 including:
• 150 MVA 220/66 kV transformer at DPTS
• construction of 66 kV lines to connect new Rockbank East zone substation (RBE) to DPTS
Installation of fourth transformer at ATS by November 2021 including:
• 150 MVA 220/66 kV transformer at ATS
• construction of 66 kV lines to connect new Tarneit zone substation (TRT) to ATS
• construction of 66 kV lines to transfer existing Bacchus Marsh zone substation (BMH) to ATS
• construction of a second KTS-Sydenham (SHM) 66kV line (KTS-SHM No.2)
Connection of second 220 kV line (KTS-GTS No.1) at DPTS by November 2023.
Installation of fourth transformer at DPTS by November 2024 including:
• 150 MVA 220/66 kV transformer at DPTS
• construction of 66 kV lines to transfer existing Sunshine East zone substation (SSE) to DPTS
Installation of a sixth transformer at KTS by November 2025 including:
• 150 MVA 220/66 kV transformer at KTS
• augmentation of KTS-SBY 66 kV line
Construction of 66kV lines to connect new Rockbank zone substation (RBK) to DPTS by November 2026
Construction of 66kV lines to connect new Wyndham Vale zone substation (WVL) to ATS by November 2027
Two 100 MVAr capacitor banks at DPTS by November 2029.
Page 21Indicative capital cost
Option
Description in present value terms at
8% real discount rate
Option 2: This option involves installing a sixth transformer on the KTS B3,4 group, and transferring SU zone substation to BLTS to $216.6 million
th
Install KTS 6 reduce load on the KTS B1,2,5 group by November 2016 involving:
th
and ATS 4 • installing a sixth 150 MVA 220/66 kV transformer at KTS
transformers
• construction of 66 kV lines to transfer existing SU zone substation to BLTS
• installing a fourth 150 MVA 220/66 kV transformer at ATS
• construction of 66kV lines to connect new TNA zone substation to ATS
• construction of 66kV lines to transfer existing BMH and MLN zone substations to ATS
• construction of a second KTS-Sunbury zone substation (SBY) 66 kV line to relieve overloads at KTS and on the
KTS-SBY-SHM-MLN 66 kV loops
Construction of 66kV lines to connect new RBE to KTS by November 2018
Construction of a second KTS-SHM 66 kV line (KTS-SHM No.2) by November 2020
Construction of 66kV lines to connect new TRT to ATS by November 2021
Establishment of new terminal station at Deer Park (DPTS) by November 2023 including:
• four 150 MVA 220/66 kV transformers and eight 66 kV exits at DPTS
• connection to KTS-GTS No2 220 kV line
• construction of 66kV lines to transfer existing zone substations MLN, RBE, SSE, SU, TNA to DPTS
• connection of second 220 kV line (KTS-GTS No.1) to DPTS
• construction of 66 kV lines to split ATS-TRT-BMH loops
Augmentation of KTS-SBY 66 kV line by November 2025
Construction of 66 kV lines to connect new zone substation RBK to DPTS by November 2026
Construction of 66 kV lines to connect new zone substation WVL to ATS and split ATS-TRT-WBE loop by November
2027
Two 100 MVAr capacitor banks at DPTS by November 2029.
The alternative to transferring SU to BLTS is to install a seventh transformer at KTS on the B1, 2, 5 group. This is a
similar cost to transferring load but is not preferred as it concentrates too much load at KTS and exposes customers to
unacceptable reliability and security risks.
It is noted that this option involves additional 66 kV lines from KTS to RBE & SHM before DPTS is required. This requires
new 66 kV line exits at KTS in a westerly direction that are difficult to obtain due environmental constraints and restricted
access corridors hence additional 66 kV underground cable is required.
Page 22Indicative capital cost
Option
Description in present value terms at
8% real discount rate
Option 3: This option involves the installation of a fourth transformer at ATS to supply TNA and MLN by November 2016 and $204.0 million
th
Install ATS 4 involves the following:
Transformer • construction of 66 kV lines to transfer existing SU zone substation to BLTS
• installing a fourth 150 MVA 220/66 kV transformer at ATS
• construction of 66 kV lines to connect new TNA zone substation to ATS
• construction of 66 kV lines to transfer existing BMH and MLN zone substations to ATS
• construction of a second KTS-Sunbury zone substation (SBY) 66 kV line to relieve overloads at KTS and on the
KTS-SBY-SHM-MLN 66 kV loops
Establishment of new terminal station at Deer Park (DPTS) by November 2018 including:
• two 150 MVA 220/66 kV transformers and four 66 kV exits at DPTS
• connection to KTS-GTS No2 220 kV line
• construction of 66 kV lines to connect new zone substation RBE to DPTS
• construction of 66 kV lines to transfer existing zone substation MLN to DPTS
Construction of a second KTS-SHM 66 kV line (KTS-SHM No.2) by November 2021
Construction of 66 kV lines to connect new zone substation TRT to ATS by November 2021
Installation of third transformer at DPTS by November 2024 including:
• 150 MVA 220/66 kV transformer at DPTS
• construction of 66 kV lines to transfer existing zone substations SU and TNA to DPTS
• connection of second 220 kV line (KTS-GTS No1) at DPTS
Installation of fourth transformer at DPTS by November 2025 including:
• 150 MVA 220/66 kV transformer at DPTS
• construction of 66 kV lines to transfer existing zone substation SSE to DPTS
Installation of a sixth transformer at KTS by November 2025 including:
• 150 MVA 220/66 kV transformer at KTS
• augmentation of KTS-SBY 66 kV line
Construction of 66 kV lines to connect new zone substation RBK to DPTS by November 2026
Construction of 66 kV lines to connect new zone substation WVL to ATS by November 2027
Two 100 MVAr capacitor banks at DPTS by November 2029.
Page 233.3 Investment sequence and capital costs of network only options
Capital cost forecasts are based on planning estimates provided by SP AusNet, and
parameters developed by AEMO, Jemena and Powercor, based on internal knowledge and
costs from recent network augmentations. Table 7 below shows the timing and estimated
cost of work under each option, based on the central demand forecasts. Note that only the
works shown in 2016 are those being justified in this Regulatory Test application.
Page 24Table 7: Investment timing and capital costs of network options under central demand
forecasts
Network Options
Cost, $ Cost, $ Cost, $
Year Built Option 1 Option 2 Option 3
million million million
2012
KTS B3,4 group KTS B3,4 group KTS B3,4 group
2013 1x100MVAr capacitor 1x100MVAr capacitor 1x100MVAr capacitor
bank bank bank
2014
2015
th
DPTS with 2 x KTS 6 transformer, th
th ATS 4 transformer;
transformers, 220kV ATS 4 transformer;
BMH, MLN & TNA to
2016 KTS-GTS No2, MLN, 125 KTS-SBY No2; SU to 96.5 97.6
ATS/West, KTS-SBY
SU & TNA; KTS-SBY BLTS; MLN, TNA &
No2, SU to BLTS
No2 BMH to ATS/West
2017
DPTS with 2 x
rd
DPTS 3 transformer & transformers, 220kV
2018 19.9 RBE to KTS West 37.4 77.8
RBE KTS-GTS No2, MLN &
RBE
2019
2020 KTS-SHM2 39.2
ATS 4th transformer;
TRT & BMH to TRT to ATS/West; KTS-
2021 64.5 TRT to ATS/West 16.5 46.1
ATS/West; KTS-SHM SHM No2
No2
2022
DPTS with 4 x
transformers, 220kV
KTS-GTS No2, MLN,
DPTS 220kV KTS-GTS
2023 11.2 RBE, TNA, SU & SSE. 150.5
No1 switching
DPTS 220kV KTS-GTS
No1 switching; ATS-
TRT-BMH loop split
rd
DPTS 3 transformer
DPTS 4th transformer; with TNA & SU; DPTS
2024 33.6 49.2
SSE to DPTS 220kV KTS-GTS No1
switching
KTS 6th transformer;
KTS 6th transformer; KTS-SBY
2025 22.8 KTS-SBY augmentation 5 43.8
KTS-SBY augmentation augmentation; DPTS
4th Tx; SSE to DPTS
2026 RBK to DPTS 14.4 RBK to DPTS 16.4 RBK to DPTS 15.4
WVL to ATS; TRT &
2027 WVL to ATS 51.1 55.4 WVL to ATS 51.1
WBE Loop Split
2028
DPTS 2x100MVAr DPTS 2x100MVAr DPTS 2x100MVAr
2029 11.8 11.8 11.8
capacitor banks capacitor banks capacitor banks
2030
Total Cost 354.3 428.7 392.8
NPV (8%
discount 187.4 216.6 204.0
rate)
Page 25It is noted that whilst all network only options require the installation of a sixth transformer at
KTS, Options 1 and 3 do not require construction of new lines. The cost of Option 2 is
comparatively high because the KTS sixth transformer is required much earlier (2016)
compared with the estimated timing of 2025 under Options 1 and 3. In addition, Option 2
involves the construction of new lines out of KTS.
It is also noted that whilst a sixth transformer has been identified as a long term requirement
at KTS, the cost of this additional capacity could be reduced or eliminated completely if
SP AusNet’s future asset replacement program increases the capacity of the existing B3 &
B4 transformers to 225 MVA. In terms of the investment analysis presented here, Option 2 is
less able to benefit from such a decision because of its earlier planned introduction of the
sixth transformer.
The costs associated with common zone substation works and the proposed 2013 KTS B3
and B4 transformer group 100 MVAr capacitor bank have been excluded from the analysis.
3.4 Non-network alternative options
The NSPs have identified two potential non-network options that could be used in
combination with the network alternatives that may create market benefits similar to those of
the network only options identified. The two potential non-network options identified are
demand management in the form of voluntary load reduction and development of local
generation:
• Option 4: Utilise demand management at KTS to defer DPTS.
• Option 5: Utilise generation on the sub-transmission KTS-SBY-MLN loops at KTS
West (B3 & B4 group) to defer the installation of the 6th transformer and 66kV line
augmentation with all other investment streams maintained as per Option 2.
This section describes the technical characteristics required of a non-network support option
to meet the identified need to invest. It also includes estimated costs to implement and
contract for non-network support services, assuming that such an option is technically
feasible within a similar timeframe as the recommended network augmentation.
The primary market benefits associated with the identified need to invest relate to reducing
the expected amount of involuntary load shedding that would be required to maintain
transmission connection asset and distribution network loading within plant limitations if
alternative action was not taken. To achieve similar levels of market benefits, it is expected
that a non-network option would also need to be able to reduce the amount of involuntary
load shedding required to maintain transmission connection asset and distribution network
loading within plant limitations.
To provide an economic comparison with the network options identified, the NSPs have
prepared cost estimates of implementing and contracting for non-network support services.
The estimates are based on the NSPs’ knowledge, derived from previous non-network
support arrangements, and discussions with non-network service providers.
Non-network support costs have been separated into three components, including:
• Service availability charge, which is generally in the form of a regular payment to the
non-network service provider for having the support services in place, even if those
services are not utilised.
• Support charge, which is generally in the form of a payment to the service provider
when their services are called upon. For a local generator this cost would include
Page 26their short run marginal cost as compensation for the fuel used to operate their
generator. For a demand management option in the form of voluntary load reduction
this support cost would include a compensation payment to the service provider for
reducing their demand when requested.
• Organisational cost, which is the consultancy services to investigate the potential for
demand management, to prepare plans, arrange support contracts and coordinate
network support when required.
Non-network support cost estimates were prepared for the two alternative options identified,
demand management in the form of voluntary load reduction and local generation
development in conjunction with capital investment streams for Option 1 and Option 2
respectively. The estimated non-network support unit costs are presented in Table 8.
Table 8: Capital and operational cost estimates of non-network support services
Service
Support Organisational
Non-network option availability
Charge Cost
charge
Demand management by $4,800/MW/
$1,300/MW/hr $80,000/MW
voluntary load reduction Month
Local generation
$0.1M/MW $300/MWh N/A
development
Table 9 and Table 10 present the expected load reduction, or additional generation, required
by location and the number of hours in each year that would likely be required at Keilor
Terminal Station.
Because the network limitations are based on continuous, short-term and cyclic asset ratings
under system normal and outage conditions, a non-network option would be required to
operate within the fifteen minute response time required operationally.
Page 27You can also read