Electric vehicle market penetration in Switzerland by 2020 - We cannot forecast the future but we can prepare for it
←
→
Page content transcription
If your browser does not render page correctly, please read the page content below

Electric vehicle market penetration
in Switzerland by 2020
We cannot forecast the future but we can prepare for it


Index

 5   1. Alpiq. A new energy leader
 6   2. Switzerland’s energy challenges and objectives
 8   3. Alpiq’s energy strategy
12   4. Alpiq supports electric vehicles
22   5. VISION 2020 for future clean mobility
25   6. Meeting VISION 2020
30   7. Next steps

Atel & EOS join forces to create Alpiq, a new
energy leader for Switzerland and Europe.
We combine power generation, transmission,
sales & trading and energy services into a
comprehensive offering of energy solutions.

1. Alpiq. A new energy leader

As a leading national energy company, Alpiq is ready
to play an important, proactive role in providing
economically feasible solutions for ensuring security
of energy supply and reducing greenhouse gas (GHG)
emissions.

• Present in 30 European countries
• Cumulated turnover of CHF 15.8 billion in 2008
• Workforce of more than 10,000
 employees (in Switzerland > 5,000)

                                                        Power generation
                                                        Energy services
                                                        Sales & trading

                                                                           5
2. Switzerland’s energy challenges
    and objectives

    Chart 1: Primary energy balance sheet                                                   2.1 High dependence on fossil energy
                                                                                            Switzerland is highly dependent on fossil energy imports.
                        219.77                                                              Foreign oil and gas currently account for 56 % of the
                        19 %                           633.92
                                                       56 %
                                                                                            country’s primary energy consumption. Domestic energy
                                                                                            resources are limited to 19 % of national use, of which
                                                                                            hydroelectricity resources are predominant with 11.5 %.

                                                                                            2.2 Latent risk with fossil energy imports
    287.99
                                                                                            After the dramatic surge of crude oil prices in the summer
    25 %
                                                                                            of 2008, the global recession caused oil prices to plunge to
                                                                                            $ 40/bbl. But prices will doubtlessly increase rapidly again
                        Fossil energy       Nuclear fuel        Domestic resources          once the economy recovers. Some experts1 forecast a price

    Source: Swiss energy statistics 2007, SFOE
                                                                                            of $ 200/bbl by 2030.

                                                                                            In the long term, once peak oil is passed there will ensue
    Chart 2: Crude oil prices                                                               an inevitable and irreversible cost increase of petrol-based
                                                                                            fuels. This rise will last several decades before oil finally
                        250
    Brent crude $/bbl

                                                                                            runs out completely.

                        200
                                                                                ?
                        150

                        100

                         50

                              2000   2005     2010     2015      2020    2025        2030

    1
             See IEA World Energy Outlook 2008

6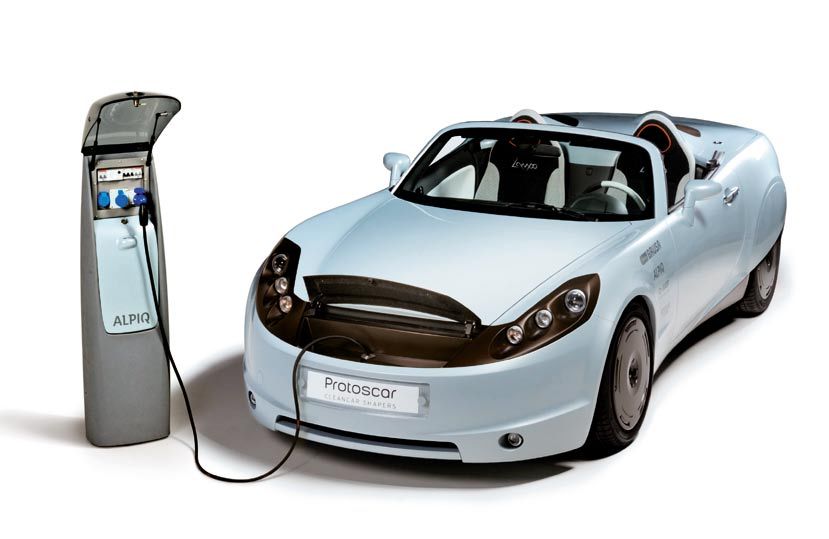
2.3 Switzerland’s energy strategy                               Much will therefore depend on the outcomes of the EU
The energy challenges to be met by Switzerland are twofold:     Climate and Energy package and the 2009 COP 2 post-Kyoto
• Mitigation of the peak oil threat and ensuing drastic        Protocol international discussions in Copenhagen. How-
    price increase by reducing Switzerland’s dependency on      ever, the global climate issue is already well known: the
    oil & gas                                                   prevention of dangerous climate interference requires a
• Meeting the climate challenge by significantly reducing      reduction in worldwide CO2 emissions to around 23 billions
    national GHG emissions                                      tons by 2030 3, equivalent to the level of 2005 emissions.
                                                                This is an enormous challenge for which Switzerland will
The Swiss government accordingly published its energy           have to do its share.
strategy at the beginning of 2007, based on four pillars:
• Increased energy efficiency and control of growth in
    energy demand
• Increased share of renewable energy
• Construction of large electricity generation plants to re-
    place aging nuclear plants and construction of combined
    cycle gas turbine (CCGT) plants as a transitory solution
• Strengthening of international collaboration

The Swiss climate strategy will be addressed by Parliament
in 2009/2010. The two alternative solutions proposed by
the Swiss government consist of 1) an alignment with
EU climate policy for a 20 % reduction in greenhouse gas
(GHG) emissions by 2020, obtained primarily by domestic
measures, and 2) a more ambitious reduction of 50 % by
2020, mainly through concerted measures at the interna-
tional level.

2
    Annual Conference of the Parties to the Kyoto Protocol
3
    Source: International Panel on Climate Change (IPCC)

                                                                                                                             7
3. Alpiq’s energy strategy
3.1 Need for a global approach economic agent is supplied with the energy 5 required,
Since constraining energy demand by limiting consump- when, where, in the form and in the amount needed.
tion is socially undesirable and politically difficult to Reducing Switzerland’s dependence on fossil energy is
implement, effort must be focused on improving energy a challenge of major importance.
efficiency.
Increasing energy efficiency correlates to the lowering
This approach is based on Switzerland’s “global energy of transformation losses from primary energy to useful
engine” where, from primary energy resources 4, every energy.
Chart 3: Switzerland’s global energy system
Coal
Refining
Crude oil Housing
CCF CAD *
Industry
Oil products
Oil products
Services
Natural gas
Transformed energy
power plant
Imports
Transport
Nuclear fuel
Primary energy
Useful energy
Final energy
power plant
Electricity
Hydroenergy
Exports
Other renewable energies
Losses
Losses
Losses
Primary
energy Transformed
energy Final
energy Useful
energy
*
CHP-Long-Distance Heating
4
For example: oil, natural gas, coal, uranium (nuclear), wind, solar, geothermal, hydro
5
For example: dwelling and office heat & light, transportation
83.2 The role of electricity Alpiq’s strategy is aimed at securing Switzerland’s electricity
Electricity can provide a new solution for securing com- supply and maintaining domestic low-carbon electricity
petitive energy in a fossil fuel and carbon-constrained generation in a diversified mix, using all available options:
world, especially in Switzerland where electricity genera- • Increasing the share of renewables (hydro and other
tion is almost free of CO2. sources)
• Replacing aging nuclear power plants
Electricity, which is not a primary energy but a transformed • Using clean fossil fuel Combined Cycle Gas Turbine (CCGT)
energy, can be produced from nearly all primary sources. plants as a transitory solution.
Electricity can therefore integrate the majority of renew-
able energy sources and gradually contribute to the green-
ing of the global energy system. 3.3 Smart grid: potential improvement at hand
The Swiss power network is interconnected to the Euro-
Electrifying the economy in an intelligent manner holds pean grid in a system that, with outstanding efficiency
great potential for energy savings through superior and reliability, is capable of delivering just-in-time energy
efficiency in the transformation of primary energy into whenever and wherever it is needed. This fantastic mecha-
useful energy. nism supplies each household with power 24 hours a day.
Indeed, very substantial progress in terms of energy effi- The integration of clean, renewable sources of energy like
ciency, CO2 emissions and reducing oil and gas dependency solar, wind and geothermal will require the power grid to
can be achieved through the intelligent electrification of develop a more advanced delivery network, with the ability
the Swiss economy, particularly in two areas: to support a two-way flow of information and electricity.
• Heating and cooling through the use of heat pumps in
the residential sector This “smart grid” will incorporate the benefits of dis-
• Pluggable electric cars for private transportation tributed intelligence, computing and communication and
will facilitate the power balance between supply and
The replacement of less efficient electro-technologies demand at the device level. The “smart grid” will also help
(incandescent lightning, direct electric heating, standby increase energy efficiency by reducing final energy
power, etc.) with more efficient electro-technologies (commercial energy) needs and expenses for all econo-
must also be accelerated. mic agents.
94. Alpiq supports electric vehicles
Chart 4: Sources of greenhouse gas (GHG) emissions 4.1 In Switzerland, electricity is part of the solution, not
part of the problem
35
% of total anthropogenic emissions
30.1 % 31.4 % • Sources of greenhouse gas (GHG) emissions in Switzerland
30
25.6 % differ considerably from the world situation (chart 4):
25
• The energy sector is negligible in Switzerland with 2.7 %
20
of GHG emissions, while it is a major component (¼)
15 13.1 %
over the entire world.
10 7.9 %
• The transport sector accounts for ⅓ of GHG emissions in
5 2%
Switzerland compared to slightly over 1/10 worldwide.
Energy production Transportation Residential/
commercial buildings
This clearly illustrates that the Swiss climate policy should
World (IPCC 2004) Switzerland (SFOE 2006) focus on those sectors emitting large amounts of GHG, such
as housing and transportation.
Contrary to the global situation, electricity generation is
not a CO2 issue in Switzerland.
12Chart 5: Swiss CO2 emissions (Energy use) 4.2 The problem of increasing road transport CO2 emissions
In the EU, emissions of CO2, the most important GHG, have
45
Millions of tons per year
been growing quickly in road transportation, whereas
40
the emissions trend remains steady or is even decreasing
35
in the other sectors.
30
25
The situation is similar in Switzerland (chart 5). Since CO2
20
emissions in transportation continue to grow (+14.3 %,
15
1990 – 2007), total Swiss emissions of CO2 from energy use
10
have remained steady at around 39 million t CO2/year
5
despite a significant reduction in the industrial and resi-
1975 1980 1985 1990 1995 2000 2005 2010 dential sectors during the last decade (– 14.6 %, 1990 – 2007,
chart 6).
Total Heat process
Road transport Air transport
Clearly, the focus of the Swiss climate strategy should be
Source: Ecoplan, “CO2-Emissionen 2008 – 2012”, Annual report, set on CO2 emissions in the road transportation sector
SFOE September 2008
(44 % of total Swiss emissions in 2007) and on private cars
in particular, the greatest source (72 %) of CO2 emissions
in the sector (chart 7).
Chart 6: Variation 1990 – 2007
15
Percentage
+14.3 % Chart 7: Road transport CO2 emissions (2007)
10
5
7%
–5 13 % 72 %
–10
–14.6 %
–15
8%
Heat process Road transport
Source: Ecoplan, “CO2-Emissionen 2008 – 2012”, Annual report,
SFOE September 2008
Private cars Vans (delivery) Trucks and busses
Other
Source: Metron Ecoplan “Handelbare Vebrauchsgutschriften für
Neuwagen”, Greenpeace CH, January 2009
134.3 The importance of considering the global energy chain When considering the entire energy chain (Well-to-Wheel),
In order to evaluate and compare the environmental impact the overall energy efficiency depends on the electricity ge-
of a vehicle concept, energy consumption and emission neration mode, i.e. the type of generation plant and source
intensity must be considered from the source of the primary of primary energy used for electricity generation.
energy carrier (well) to the end user (wheel of the vehicle).
To simplify the comparison, assume that electricity is pro-
The Well-to-Wheel (WtW) evaluation is the sum of the duced in a modern power plant (CCGT) with oil as the pri-
Well-to-Tank (energy expended and the associated green- mary energy. In this particular example, a standard internal
house gas (GHG) emitted in the steps required to deliver combustion engine (ICE) and a battery electric vehicle (BEV)
the finished fuel into the onboard tank of the vehicle) and engine will operate from the same primary energy, that is
the Tank-to-Wheel (energy expended and the associated oil. A comparison of the two energy chains shows that the
GHG emitted by the vehicle/fuel combination) values WtW overall electric energy chain is around twice as ef-
(chart 8). ficient as the traditional gasoline chain using a combustion
engine. This results from the fact that an electric power
train is about four times more efficient than a combustion
engine. This results from the fact that an electric power
train is about four times more efficient than a combustion
engine (Tank-to-Wheel, charts 9 a – b).
Chart 8: Global energy chain Well-to-Wheel
WtW – Well-to-Wheel
Primary energy Processing Fuel Car
+ + +
WtT – Well-to-Tank TtW – Tank-to-Wheel
14Chart 9 a
–��
–��� electricity grid
–�� electricity –��
refinery generation battery –��
electric motor
Energy loss –��
CO₂ emissions
powertrain mechanical losses
ENERGY ��� %
����
USEFUL ENERGY ����
ELECTRIC VEHICLE
–�� –���
refinery diesel engine
Energy loss
CO₂ emissions
ENERGY ��� %
–��
powertrain mechanical losses
����
USEFUL ENERGY ��–���
Source: Protoscar DIESEL VEHICLE
Chart 9 b: Efficiency comparison
90
Percentage
80 %
80
70
60
50
40 %
40
30
20 %
20 15 %
10
ICE A category BEV with
diesel CCGT
Tank-to-Wheel Well-to-Wheel
Source: Protoscar
15Chart 10: CO2 emissions for private cars in the EU context 4.4 Carbon intensity of European electricity
The generation fleet of European countries is not only com-
200
g CO2/km
prised of up-to-date, modern power plants with high ef-
ficiency. There are also plants belonging to an older, less
150
efficient generation. The primary energies (coal, gas, hydro,
nuclear) used are also different. The share of renewable
100
energies (hydro, wind, solar, etc.) in the generation mix var-
ies much across the continent. Therefore, the specific CO2
50
emissions from electricity generation (g CO2/kWh) differ
greatly between European countries.
2005 2010 2015 2020 2025 2030
In 2005, the average EU mix had specific CO2 emissions of
EU fleet average (TtW) EV on EU-production mix (WtW)
410 g/kWh. Replacing conventional internal combustion
EU-target 2015 (TtW)
engine vehicles with electric vehicles (EVs) would result in
Source: Eurelectric major reductions in CO2 emissions. With the current car-
bon intensity of the European electricity production mix,
a typical electric car produces CO2 emissions of around
80 g/km. This compares favorably to the current EU market
average of CO2 emissions from passenger cars – about
160 g/km.
However, the European electricity sector will reduce its
carbon intensity over coming years, particularly with
increased use of renewables and carbon capture and stor-
age. EURELECTRIC estimates that the carbon intensity of
EU electricity in 2030 will diminish to 130 g/kWh, resulting
in emissions from electric cars of less than 30 g of CO2 per
km (0.18 kWh/km EV consumption, chart 10).
16Chart 11: Swiss electricity production mix 2005 4.5 Carbon intensity of Swiss electricity
In Switzerland, the generation mix is practically free of
3% 2%
CO2. Only 5 % of electricity generation comes from fossil or
57 %
waste cogeneration plants. 57 % of the Swiss electricity is
produced from hydro, while the remaining 38 % comes from
nuclear plants (chart 11).
38 %
The Swiss generation mix will remain CO2 free since ad-
ditional capacity will come from renewable sources (hydro,
wind, solar, all free of CO2), combined cycle gas turbine
power plants (with an obligatory 100 % compensation of CO2
Hydro Nuclear Fossils emissions), or nuclear plants (free of CO2). Compared to the
Waste cogeneration plants EU mix, Swiss electricity generation is much cleaner.
Source: Swiss energy statistics 2005, SFOE
Taking into account imports and exports, the Swiss elec-
tricity consumption mix is slightly different, since 21 %
comes from EU imports (chart 12).
Chart 12: Swiss generation and consumption mix (2005)
Since the EU generation mix is not CO2 free, the Swiss
Imports EU mix consumption mix has a higher CO2 content than the Swiss
21 %
Nuclear imports 11.9 TWh generation mix. But the Swiss electricity consumption
1.55 TWh
21%/11.9 TWh mix will also benefit from the future decarbonation of the
EU mix as follows.
Consumption
38 %/22 TWh 23.55 TWh
57.3 TWh
Production
57.9 TWh
5.4 %/3.1 TWh 2.5 TWh 2005 2010 2020 2030
56.6 %/32.8 TWh 19.35 TWh Electricity g CO2/kWh g CO2/kWh g CO2/kWh g CO2/kWh
EU production mix 407 351.6 240.8 130
Losses
Swiss production mix1 34.4 34.4 34.4 34.4
Exports Swiss consumption mix 112 100.6 77.6 54.7
13.45 TWh
1
Including fossil and waste cogeneration
Nuclear generation Hydro generation Other
Imports EU mix
Source: SFOE, electricity mix, December 2007
17Chart 13: CO2 emissions of private cars in Switzerland With the current carbon intensity of Swiss electricity,
a typical electric car emits less than 7 g CO2/km from the
200
emissions g CO2/km
generation mix, amounting to 23 g CO2/km from the con-
sumption mix. This typical electric car engenders global
150
CO2 emissions savings (Well-to-Wheel) of around 160 g/km
compared to the national fleet average in Switzerland
100
today. In 2015, the CO2 reduction in Switzerland is projected
to still remain higher than 100 g/km compared to the
50
2015 EU target (chart 13).
2005 2010 2015 2020 2030 Even considering the future technology standards required
by the 2015 EU Target, Swiss EVs retain a tremendous
CH fleet average (TtW) EV on CH generation mix (WtW)
comparative advantage with respect to internal combus-
EV on CH consumption mix (WtW) 2015 EU target (TtW)
tion engine vehicles thanks to the high quality of Swiss
electricity.
Chart 14: Local air pollutant emissions (TtW), average 4.6 Reduced city pollution
European private car Using electricity as an alternative fuel for the transport
sector would result as well in drastic reductions in local air
300
CO2 emissions (g/km)
pollutants (CO2, NOx, small particulates) emitted in cities
(chart 14).
200
100
4.7 A diversified supply
zero
The use of electricity also ensures maintaining a diversi-
emissions 0 0.05 0.1 0.15 0.2 0.25 0.3 fied supply of energy for road transport, since:
NOx emissions (g/km)
• Electricity is not a primary energy
ICE gasoline ICE diesel PHEV EV • Electricity can be generated from different primary
energy sources (renewable, oil and gas, coal, nuclear)
1819
5. Vision 2020 for future clean mobility

     A massive adoption of EVs in the Swiss fleet of private cars   For private cars, it appears that a path towards total
     would significantly help to reach the ambitious goals of       electrification is unavoidable simply because it represents
     Switzerland’s climate and energy policy, whereas a limited     the best solution from a global energy efficiency point of
     EV market penetration has only marginal interest for its       view and because no viable alternatives exist. In the long
     environmental strategy.                                        term (2050?) nearly all new cars will therefore be powered
                                                                    by electricity. Even the hydrogen for fuel cell vehicles may
     A massive switch to EVs will not be sufficient by itself       be produced primarily by electricity, since generating
     however to meet the goals of Switzerland’s climate and         hydrogen by electrolysis is both more efficient and more
     energy policy. Several other measures are necessary            environmentally friendly than reforming natural gas.
     for this purpose, such as improving public transportation
     in cities, upgrading town and country planning, facili-        The penetration of EVs in the Swiss national car fleet
     tating transport mode changes (e. g. parking lots near         should meet the following conditions:
     railway stations), etc.                                        • The business framework is that of a free market with
                                                                     competition as the main driver.
     Biofuels and hydrogen are possible alternatives to fossil      • Within this context, all services and goods are fully paid
     fuels like gasoline, diesel or compressed natural gas           by the beneficiary.
     (CNG), but these substitute energy carriers have not yet       • Internalization of external costs could become govern-
     reached sufficient maturity. Biofuels can substitute            mental policy but should remain neutral from a fiscal
     traditional fuels only in limited quantities because only       point of view.
     secondary vegetal material can be taken into account           • Clean electric cars must be able to offer sufficient per-
     (in order to avoid competition for food production),            formance so as to meet market requirements. This also
     whereas hydrogen has still to overcome the main hurdle,         means that the total cost of ownership (TCO) will have
     the installation of a brand new distribution network.           to be competitive.
     In contrast, a sufficient electric network infrastructure      • Original Equipment Manufacturers (OEMs) must be able
     already exists in all developed countries.                      to supply enough pluggable cars – i. e. battery electric
                                                                     vehicle (BEVs) and plug-in hybrids (PHEVs) – to satisfy the
                                                                     Swiss market.

22
Chart 15 a: New cars according to VISION 2020 5.1 Our vision
(in thousands) By 2020, the Swiss national car fleet will comprise 720,000
electric pluggable cars (PHEVs and BEVs), roughly 15 % of
160
the total. To realize this goal of 15 % EV penetration by 2020,
140
important EV-related promotional measures are necessary
120
on both the supply and demand sides.
100
80
Average market penetration for the 2011 – 2020 period
60
should therefore be around 70,000 clean EVs per year. The
40
buildup should progress incrementally, starting with 2 %
20
in 2011 and attaining 50 % by 2020. Assuming 300,000 new
2010 2011 2012 2013 2014 2015 2016 2017 2018 2019 2020 registrations per year, the yearly share of new EVs should
grow to around 100,000 clean EV cars entering the fleet by
PHEV 10 – 20 PHEV 40 EV city EV full
2020 (charts 15 a – b).
Source: Protoscar
According to research by Protoscar, the supply of all
types of EVs by OEMs would suffice to satisfy the Swiss
Chart 15 b: Cumulative cars according to VISION 2020 market, provided OEMs consider Switzerland to be of
(in thousands) strategic interest.
800
700
600
500
400
300
200
100
2010 2011 2012 2013 2014 2015 2016 2017 2018 2019 2020
PHEV 10 – 20 PHEV 40 EV city EV full
Source: Protoscar
23Chart 16: New EV/PHEV 2010 – 2020 (in thousands) After validating the feasibility of VISION 2020 based on
sales estimates from both a “demand” and an “offer”
300
point of view, the study by Protoscar resulted in the con-
250
clusions seen at left (chart 16).
200
150
100
5.2 Climate and Energy Impact of Vision 2020
50
The realization of a 15 % EV penetration under the Protoscar
2010 2011 2012 2013 2014 2015 2016 2017 2018 2019 2020 scenario by 2020 would result in:
• a significant reduction6 of 1.2 million t CO2/year when
IC PHEV EV
compared to a benchmark mid-size gasoline car, of 1.1 mil-
Source: Protoscar lion t CO2/year when compared to the 2015 target (130 g/
km TTW), and 0.86 million t CO2/year when compared to
Chart 17: Reduction of CO2 emissions the best “non-pluggable” technology (reference: mid-size
10 DICI DPF 7 hybrid, chart 17)
Percentage
• a reduction of 1.2 million t CO2/year corresponds to a 9.7 %
reduction in CO2 emissions by private cars in Switzerland
5 in 2007
• considerable savings in fossil fuels, amounting to 550 mil-
lion liters of gasoline compared to a mid-size gasoline car
and 420 million liters of gasoline compared to the best
Reference: mid-size Reference: 2015 Reference: best 2010
gasoline car EU-target non-pluggable car “non-pluggable” technology (reference: mid-size DICI DPF
hybrid)
Private cars (2007) Road transport (2007)
• correspondingly important savings on gasoline expen-
ditures
• a small increase of 1.2 TWh in electricity consumption,
equal to only 1.8 % of the 2007 Swiss electricity generation
of 65.9 TWh6. This figure would increase to 1.7 TWh (2.6 %)
if every PHEV (a conservative assumption) was driven
100 % of the time on electric power alone
• a required power supply of 1.3 GW during off-peak hours,
assuming conservatively that up to 50 % of the fleet re-
charges simultaneously and that there would be no at-
tenuation due to the new features of the “smart grid”
6
ssumptions: EV consumption TTW=18 kWh/100km, 12,800 km/year average European mileage, PHEV 40 driven 80 % electric while PHEV 10 – 20 only 50 %, Swiss generation mix.
A
7
Direct injection compression ignition diesel particle filter (DICI DPF).
246. Meeting Vision 2020
6.1 Establish Switzerland as a showcase for EVs in pilot projects show that to meet VISION 2020 a strong
the EU strategy must be implemented.
Switzerland could play a pioneering role in the develop-
ment of electric individual mobility. To rely only on the market or to implement a simple strategy
based on creating economic and mobility advantages for
Switzerland has one of the largest numbers of cars per EVs/PHEVs together with establishing a recharging infra-
household in the world and uses more fuel and emits structure is not enough, because:
more CO2 per vehicle than the EU average, at 180 g CO2/km • There are many emotional aspects and psychological
compared to 160 g CO2/km in the EU. barriers to overcome, such as apprehension, skepticism,
feelings of lost freedom (due to the limited range and
Swiss incomes, living standards and willingness to spend the long recharging times for EVs), etc.
on car expenditures are high. At the same time, public • The lack of a public charging infrastructure increases all
environmental sensibility is widespread and plays a major these anxieties.
role in the national political agenda. • EVs/PHEVs are perceived as revolutionary objects in the
very conservative car world (on both demand and supply
As electricity in Switzerland is practically free of CO2 and sides) and will continue to be so perceived in the next
will remain so, the country has maximal leverage for cli- few years at least, thus the conditions to allow their ac-
mate improvement. Since Switzerland has no fossil energy ceptance must be prepared.
resources (coal, oil, or natural gas), there is no national • The commercialization of clean cars has met with little
“preference” for a given fossil primary energy that could success to date: dealers must act more like consultants
induce a political bias. Switzerland represents one of the to promote these vehicles.
best initial test markets for EVs/PHEVs due to: • The EVs/PHEVs for sale should be desired by the public;
• Its “car neutrality” (no national manufacturer, three dis- economic advantages could make them affordable but
tinct cultural areas) people must also wish to have them.
• Its indirect participation in the EU with its car-related rules • There are complicated and diversified cantonal road tax
• Its particular geographic situation in central Europe systems.
• Its relatively high income level • In past years OEMs have created some skepticism about
their will to manufacture clean cars.
6.2 Why a strong strategy is needed These topics show that the strategy to be implemented
Despite Switzerland possessing all the intrinsic character- must necessarily be based on a multidimensional ap-
istics of an ideal pilot country, the analysis of the un- proach that involves not only the vehicle itself but also
successful first generation of EVs and the results of the everything around it.
256.3 A multidimensional approach 6.4 Implementing the strategy
A multidimensional approach means that the strategy In order to implement the strategy, the measures required
should aim for three main goals: for reaching the goals must first be defined.
• to create an EV culture, i.e. present the emotional and The measures for developing an EV culture must focus on:
rational knowledge and experience accumulated so far • education
in order to break down the psychological barriers block- • PR/communication
ing acceptance of EVs/PHEVs due to their “revolutionary” • research
perception: this involves much more than creating a • network building
simple interest;
• to create favorable framework conditions; a vehicle The EV culture should not only be directed at potential cus-
must insert itself within the general road transportation tomers, but at society in general. It is very important for
structure, with its infrastructure, political guidelines car dealers to maintain their specific activities, as without
(taxation) and so on. These external conditions must be their support the EVs/PHEVs cannot be successful.
planned and implemented so as to benefit EVs;
• to have high quality and emotionally appealing vehicles Besides the development of an “EV culture”, encouraging
that people want to own and can afford, i. e. set up eco- academic and private research in EVs/PHEVs will have other
nomic advantages for EVs/PHEVs. beneficial effects, such as new business creation and solu-
tions for building better and more attractive EVs. A network
These goals are strongly interconnected as they mutually must be established amongst all the organizations involved
influence each other and require diversified measures and or potentially interested in EVs/PHEVs so as to create a
increased numbers of stakeholders for implementation. strong EVs/PHEVs community with greater influence on
society’s general strategic choices.
26To create favorable framework conditions, the measures To obtain high quality and emotionally appealing ve-
must focus on: hicles that people want to own and can afford to buy, the
• Implementing a recharging infrastructure; measures must focus on:
• Establishing transport policies that favor EVs/PHEVs; • Establishing economic advantages with respect to upfront
• City transport planning that takes into consideration costs and taxation;
the requirements of EVs/PHEVs regarding space and • Establishing economic advantages with respect to opera-
infrastructure; tional costs;
• Implementing a tax system based on emissions and • Defining technical requirements for building high quality
energy consumption. vehicles;
• Building a specialized, multi-brand dealership network
and providing support for OEMs without a Swiss network;
• Obliging public fleet operators to adopt a determined
quota of EVs/PHEVs.
Education/research
To develop an
PR/communication
EV culture
Networks
Infrastructure
Mobility advantages
Strategy goals To create favorable
framework conditions
Directed planning
Taxation
Technical requirements
Upfront and operating cost
Economical advantages
To build affordable, relia-
Taxation
ble and attractive vehicles
Public fleet requirement
Dealer network
27These measures are aimed in various directions that can The wide range of these measures implies the participation
be summarized as follows: of different stakeholders:
• Legislation and policy • Private partners involved in technical measures;
• Technical • OEMs involved in technical, economic/financial, PR/com-
• Economic/financial munication and education/research measures;
• PR/communication • Electricity concerns involved in technical, economic/
• Education/research financial, PR/communication and education/research
measures;
• Political and public bodies issuing rules and regulations
(the Swiss Confederation, cantons, and municipalities/
cities) involved in legislative measures;
• Academic/training entities involved in education/research
measures.
28Legislation and Technical Business PR and Education and
policy development communication research
Private
companies X X X
OEMs
X X X X
Electric
utilities X X X X
Political and
governing bodies X X
Universities
X X
297. Next steps
7.1 Establish Switzerland as a showcase for EVs in the EU This broad coalition of interest is pre-competitive and non-
and communicate VISION 2020 exclusive in an initial step. Alpiq recognizes however that, in
Communicating and sharing VISION 2020 is of the utmost a second phase, competitive industrial partnerships for the
importance in order to: promotion of EVs will emerge, based on proprietary busi-
• Unify existing EV promoters ness models. If these competitive partnerships are based on
• Rally new supporters homogeneous standards, each will benefit from the busi-
ness implementation of the others with ensuing synergies.
To that end, Alpiq will introduce a web page dedicated
to “green” electric cars and VISION 2020 on its web site,
www.electricitepourdemain.ch and www.immergenug- 7.3 Joining the 2020 Coalition of Interest
strom.ch, in order to receive suggestions, comments and Alpiq is sending out a call to join the 2020 Coalition of In-
working proposals. terest to every interested party who believes that:
• Individual mobility should remain a basic freedom but
its impact in terms of emissions and fossil energy depen-
7.2 Pre-competitive 2020 Coalition of Interest dency must be reduced and the Well-to-Wheel efficiency
There is a great need to standardize the recharging infra- improved.
structure and interface equipment in this field. New • The electrification of vehicle powertrains is an irrevers-
standards must in any case be internationally defined to ible trend.
accommodate the Japanese, American and European mar- • Any discussion regarding energy efficiency and vehicle
kets. These standards must be open and non-proprietary to emissions must be done on a Well-to Wheel basis instead
allow rapid acceptance of EVs, both internationally and of a Tank-to-Wheel basis.
in Switzerland. This normalization must be done at the inter- • It is better to lead the trend instead of being a follower.
national level, as OEMs are global players. Switzerland • Switzerland, being a neutral, multicultural and wealthy
must by all means avoid creating its own indigenous rules. nation, is the right place to begin EV/PHEV promotion.
• Switzerland should be the leader in encouraging and pro-
Building a Swiss pre-competitive coalition of interest with moting this trend by playing a pioneering role in the devel-
all stakeholders involved is therefore essential in this frame- opment of individual electric transportation.
work of multidimensional actors that must be inserted • This long-term project must start now to be effective
into the global picture. in 2020.
• The realization of this vision requires a multidimensional
Alpiq is active in this field and has already agreed to approach. All the different aspects have equal importance
non-exclusive partnerships with several OEMs to create and must be pursued with the same amount of effort.
the foundations of an open, pre-competitive coalition • The multidimensional approach requires the collaboration
of interest. of a variety of stakeholders. Building a Swiss pre-com-
petitive coalition of interest with all parties involved is
therefore essential.
30www.alpiq.ch © Alpiq 2010
You can also read