Our Electricity System, the Emissions Trading Scheme and the Climate Change Commission Proposals - presentation to Our Climate Declaration
←
→
Page content transcription
If your browser does not render page correctly, please read the page content below
Our Electricity System, the Emissions Trading
Scheme and the Climate Change Commission
                   Proposals

      presentation to Our Climate Declaration

                   Geoff Bertram
                  17 February 2021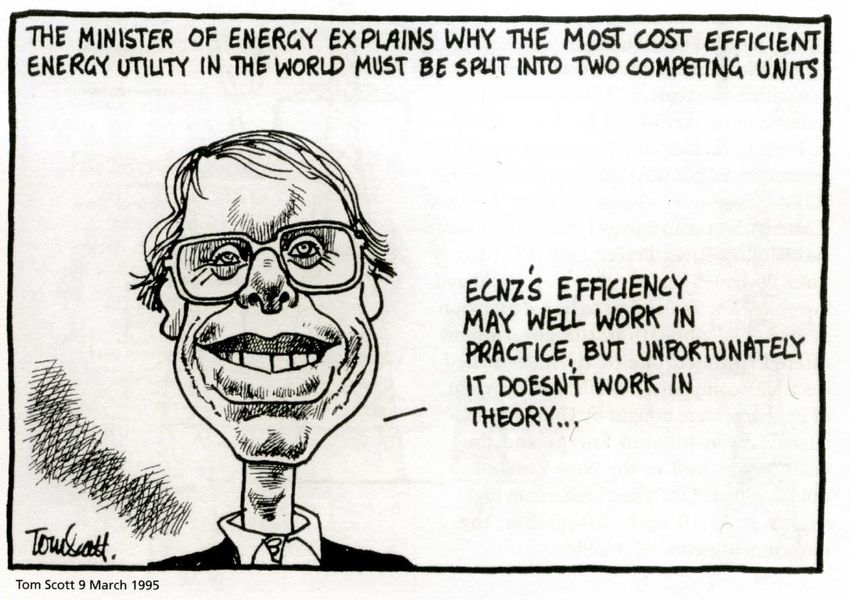
Outline
Electricity sector “reform” – promise versus outcomes
Emissions Trading Scheme as a market-mechanism-based way of pricing
carbon: promise versus outcomes
Interaction of the broken electricity market with the corporate-captured ETS
Some comments on the Climate Change Commission draft report
2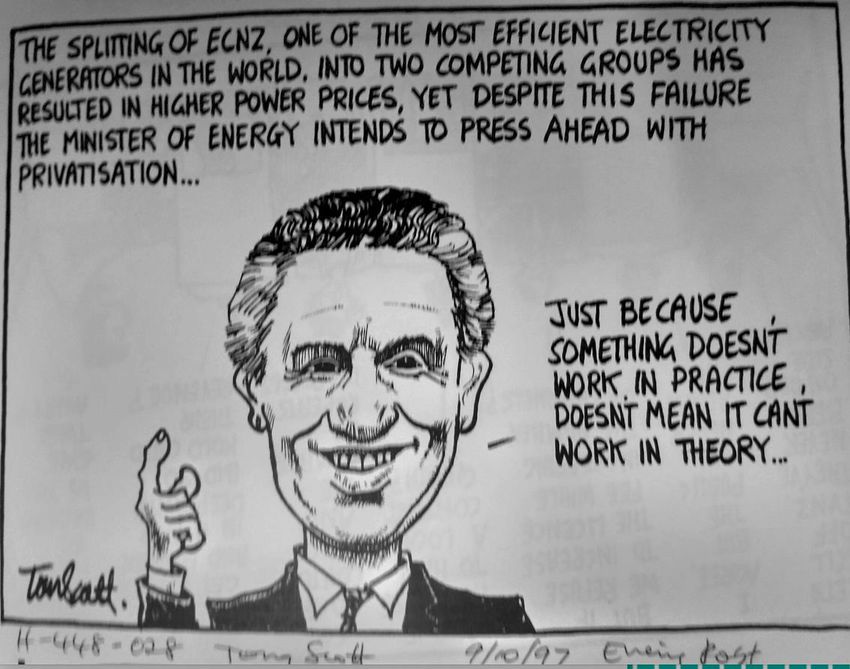
The big promise of electricity reform
Back in the 1980s the proposition was that corporatizing, reorganising, and where
possible privatising electricity, would bring gains for consumers because
Commercial, profit-driven management would (1) raise efficiency and (2) cut costs
Competition (or appropriate regulation) would (3) force efficiency and productivity gains to
be passed through to prices
Consumers would therefore enjoy better service and lower prices, while profits could rise
under an SOE or private model – sharing the gains from more productive use of resources
3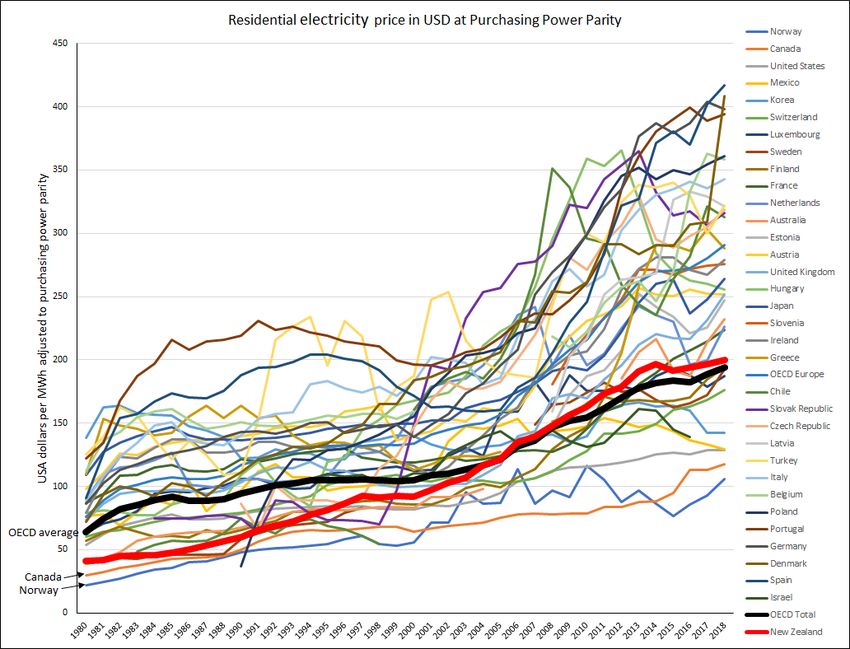
The outcome 1986-2018
A greed-driven uncompetitive oligopoly/cartel has been entrenched in control of our most
strategic sector
Productivity is down 30% over three decades, gross profits are up 80%
Construction of renewable generation has been slowed down and new entrants to
generation are being blocked by anti-competitive practices supported by the “regulators”
(Electricity Authority and Commerce Commission)
Prices for residential consumers have doubled in real terms
Prices for industry are up just a couple of percent while prices for commercial users are
down by a quarter
The industry’s strategic goals are now hostile to equitable climate-change policy
4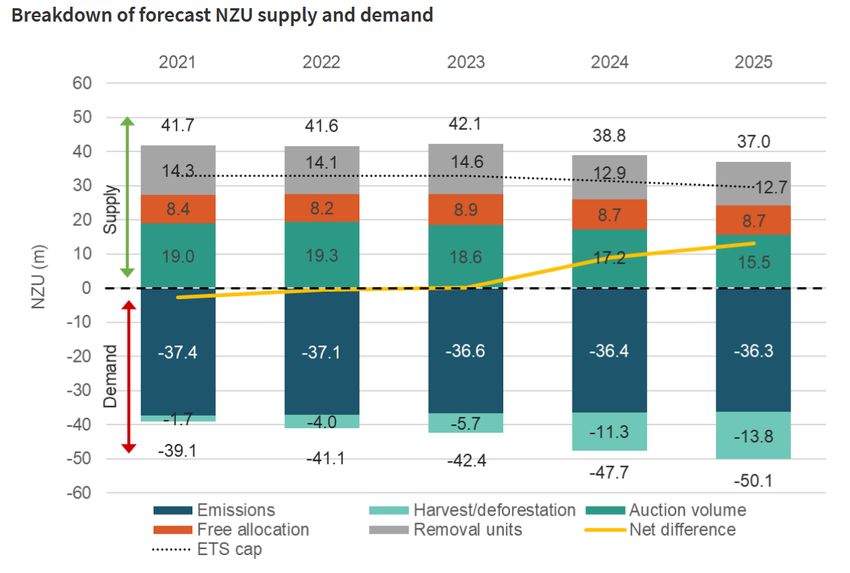
The big promise of the Emissions Trading
Scheme
Market forces would be harnessed to trigger the most cost-effective options
for emission reduction
We would have a “cap and trade” system as a viable alternative to a carbon
tax, given that the tax route was judged politically impossible
All sectors/all gases would be covered by 2013 (including agriculture)
New Zealand/Aotearoa would have a credible record to hold up for scrutiny at
international gatherings
5The outcome 2008-2021
The Emissions Trading Scheme to date was from the start a massive scam designed primarily
to enrich corporate insiders – including the electricity gentailer cartel
There was no cap placed on emissions so it was never “cap-and-trade”
The door was left wide open for using “offsets” – both forests and often-dodgy overseas
carbon credits - as a substitute for mitigation effort
It could have worked only if the Kyoto Protocol had been a success in establishing global
carbon prices and markets, but the Protocol never flew
Either price certainty or quantity certainty is required to incentivise behavioural changes.
The ETS provided neither
The 2020 ETS “reforms” have left the scam intact and the uncertainty unchecked
6My interpretation of these outcomes
High profits in electricity have come not from efficiency gains but from price-gouging residential
consumers, under cover of entrenched market power, while the countervailing power of big business
has protected industrial and commercial users.
Meantime, our electricity sector has become a major roadblock to dealing with climate change
imperatives
The Emissions Trading Scheme is a scam that tarnishes NZ internationally and blocks genuine progress
on decarbonisation
We would do better with a carbon tax, supplementary regulatory measures, and border adjustments
In a nutshell, the big promises were hollow.
7Outline of my discussion of electricity
1. Quick history
2. Some macro numbers: productivity, prices, and profits
3. Where do generators’ excess profits arise under the current industry structure?
4. How does a carbon price affect the wholesale electricity market?
8Before 1984 Since 1984
An “essential service” collectively provided A commodity allegedly like any other
supplied by corporates
Priced to recover the full cost of the
Priced as cheaply as possible to households: marginal generator plus the monopoly price
wellbeing the goal for each lines-network operator plus a fat
margin for dominant retailers
Run by civil engineers committed to optimal Run by corporate managers and financial
planned outcomes engineers maximising profit and
“shareholder value”
Multiple players in a complicated
Integrated monopoly with non-profit
institutional landscape of some [allegedly]
objectives
“competitive” and some [allegedly]
“regulated” markets
91987 Corporatisation => profit-driven SOE (ECNZ)
1988 Transpower grid separated from generation stations (finally divested 1994)
1989 Taskforce recommends privatisation, “light handed regulation”
1994 Local electricity supply authorities expropriated, corporatised, and stripped of their retail
franchise monopolies
1996 Wholesale “energy-only” spot market set up, Contact Energy spun off from ECNZ
1999 ECNZ broken up => SOEs Meridian, Genesis, Mighty River and private Trustpower and Todd
1999 Local lines/energy split enforced and generators allowed to buy up retail businesses
2008 Commerce Commission begins “regulating” lines companies
2013-14 Part-privatisation of the SOE gentailers
101995: Contact Energy split off from ECNZ
111997-99 ECNZ broken up as a prelude to privatisation
Tom Scott 9 October 1997
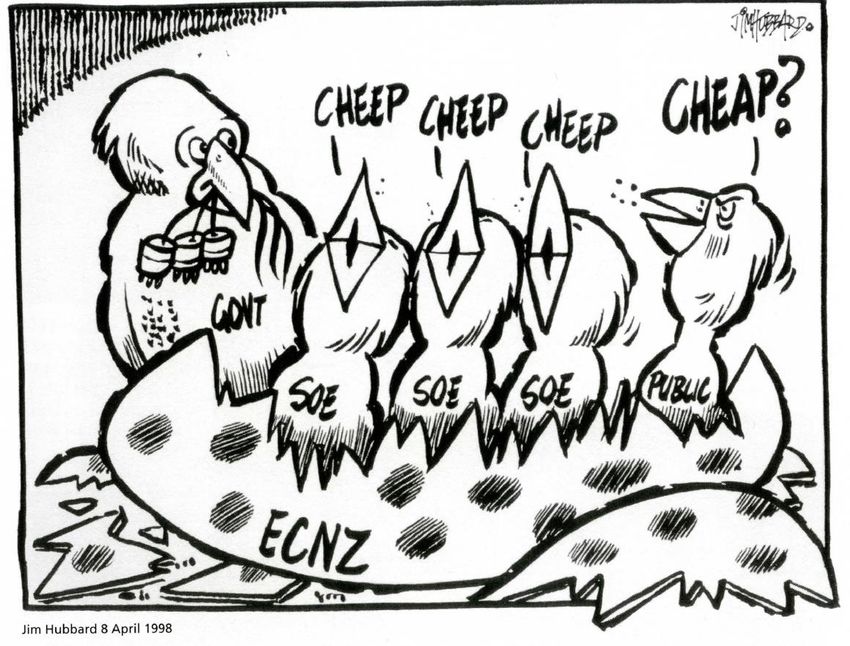
122012: the cartel securely entrenched
Tom Scott March 30 2012
Tom Scott 30 May 2012
132012-2014 Part-privatization of generation
14Raise efficiency?
15Raise efficiency?
1617
Source: Statistics NZ
Infoshare table PRD014AA   18
19
Bottom line: over the past two decades this
sector has been loaded up with labour and
capital engaged in unproductive activities
Pursuit of profit combined with complicated “competition” games
and financial engineering has meant that increasing amounts of
labour and capital have been allocated to high-paid sales,
marketing, financial management and administrative work that
adds nothing to the volume or quality of the electricity reaching
consumers
Corporatisation and privatisation have culminated in a gigantic
exercise in rent-seeking waste
20Turn now to price
First the average across all users
Then the specific changes by sector
21Calculated from MBIE ‘Data tables for electricity” and “energy price tables” at https://www.mbie.govt.nz/build ing-and-energy/energy-and- natural-resources/energy- statistics-and-modelling/energy- statistics/electricity-statistics/ and https://www.mbie.govt.nz/asset s/Data-Files/Energy/energy- quarterly-statistics/q1-march- 2019/f0208a8a33/Prices.xlsx accessed June 2019. 22
Restructuring
                                    begins

                                                         Source: MBIE data from
                                                         https://www.mbie.govt.nz/
                                                         assets/Data-
                                                         Files/Energy/energy-
                                                         quarterly-
                                                         statistics/a0285022ed/price
                                                         s-statistics.xlsx downloaded
                                                         20 May 2019, deflated to
                                                         2018 values using CPI for
                                                         residential and PPI Inputs
                                                         for commercial and
                                                         industrial.

Geoff Bertram, Otago University seminar 4 October 2019                       23
Geoff Bertram, Otago University seminar 4 October 2019 24
and comparing with other OECD countries

                                   25
Source: International Energy
Agency (2019), "End-use
prices: Indices of energy prices
by sector", IEA Energy Prices
and Taxes Statistics (database),
https://doi.org/10.1787/data-
00444-en (accessed on 20 May
2019). Series rebased by author
to 1986=100.
2627
Moving on from index numbers, compare
   different countries’ residential prices

OECD data show residential prices in US dollars per MWh at
purchasing power parity

This is of interest because industry spokespeople and MBIE
talk proudly about “11th lowest residential prices in the
OECD”.

                                                             28
New Zealand used
to be the third
lowest, at 64% of
the OECD average
price.
In 2018 NZ was
eleventh lowest, at
103% of the OECD
average.
Source: International NZ
Energy Agency database
accessed 3 October
29
2019.Cut costs and pass the gains through to prices?
Lines networks, real values in 2018 cents per kWh
Cost reductions
not sustained - 30
but profit
margins stayed31 Electricity Price Review/Hikohiko te Uira, First Report August 2018 p.23.
Finally, profits

Source: Statistics NZ https://www.stats.govt.nz/assets/Uploads/National-accounts-industry-production-and-investment/National-
accounts-industry-production-and-investment-Year-ended-March-2017/Download-data/national-accounts-industry-production-          32
investment-year-ended-march-2017.xlsx downloaded 20 May 2019.
Summary
Multifactor productivity has gone down 30% (and capital productivity down 42%)
since 1986
Residential prices have gone up 90% since 1986 (while industrial prices hardly
changed, and commercial prices fell 25%)
Operating surplus has gone up 81% in real dollars since 1986 (compared with a 12%
real increase in labour income)
Redistribution of wealth from residential consumers to electricity asset owners
and commercial users has been massive => increasing inequality and poverty (both
child poverty and energy poverty in general)
Residential consumers have gone from having no choice in a low-priced market to
having lots of so-called “choice” [but no voice] in a high-priced market
33Economics of the wholesale market
34Supply and demand in an unregulated market
Price
Total revenue Supply
PE
Demand
35
QE VolumeRevenue has two components
Price
Supply
Producer surplus
PE
Operating costs
Demand
36
QE VolumeThe Tiwai Point smelter can take 14% of the electricity at a cheap
contract price while leaving the supply/demand balance unchanged
Price
Producer surplus
minus the chunk
of profit Supply
surrendered to
the smelter
PE
Tiwai
Operating costs
Demand
37
QE VolumeActually the NZ wholesale electricity market looks more like this
Price
PE Supply
Tiwai
Demand
38
QE VolumeSo here’s the supply/demand diagram for an increasing-cost
industry with low-cost and high-cost producers:
• The total cost of supplying quantity QE is
(A + B)
• The total revenue from selling this
Price
quantity at the marginal-cost price PMC is
(A + B + C)
• Area C is pure rent collected by the
owners of the low cost plant (some
transferred to Tiwai Point’s owners)
• So which is the “true cost” - (A+B) or
(A+B+C)?
PMC Supply
B. High-cost producers’ costs
C . Low-cost
producers’ Average-cost
market rent Marginal-
pricing
(profit) cost pricing
(NZED)
(Treasury)
PL
A. Low-cost producers’ costs Demand
39 Happier
Less happy
QE consumers
Volume consumersThe other pricing option (casting our minds back twenty-nine years….)
Source: Geoff Bertram, Ian Dempster, Stephen Gale and Simon Terry, Hydro New Zealand: Providing for Progressive Pricing of Electricity, 1992, p.51.
40Vulnerability of price and rents to a demand shift in
an energy-only market (e.g. Tiwai Point closes):
• Those big profits C rely entirely on having
high-cost supply at the margin
Price
• Shift the demand curve left (e.g. close the
Tiwai Point smelter) and the price drops
radically to PL – and so do profits
PMC Supply
B. High-cost producers’ costs
C . Low-cost
producers’
market rent
(profit)
PL
A. Low-cost producers’ costs Demand
41
QE VolumeHow about entry of new low-operating cost renewables?
(Rooftop solar e.g.)
• Start with the high-price high-rent equilibrium
• Add more low-cost supply, pushing the high-
Price
cost suppliers out (off the margin) and the
Demand price drops radically – and so do profits
• So core strategy for Contact, Meridian,
Mercury and Genesis is:
Keep demand Keep supply
PMC Supply up (keep the constrained (don’t
Tiwai Point build too many
smelter windfarms, and
open!) block rooftop solar
if possible
PL
42
QE VolumeNow, another wrinkle: carbon rents if a price on carbon applies
Price
PMC Supply
B. High-cost producers’ costs
C . Low-cost
producers’
market rent
(profit)
PL
A. Low-cost producers’ costs Demand
43
QE VolumeNow, another wrinkle: carbon rents if a price on carbon applies
Price
Pwith tax Supply plus the carbon tax on fossil-fuelled generation
Windfall carbon rents to hydro Carbon
and geothermal owners tax
PMC Supply
B. High-cost producers’ costs
C . Low-cost
producers’
market rent
(profit)
PL
A. Low-cost producers’ costs Demand
44
QE
VolumeThere are two key problems preventing a
well-being-focused policy response
1. The electricity industry structure is firmly entrenched by legislation passed by
our Parliament over the three decades:
Commerce Act 1986
SOE Act 1986
Energy Companies Act 1992
Energy Industry Reform Act 1998
Commerce Amendment Act 2008
Electricity Act 2010
2. The Government’s fiscal surplus depends heavily on a continued flow of profits
and taxes from the electricity industry
45What is to be done? Part 1
Reclaim electricity as an essential service and a “commanding height” of the economy, to be controlled by the
people for the people and given a central role in driving the economy to zero carbon
Scrap the profit-driven market model, re-nationalise the big assets, re-integrate the generation and transmission
sectors under efficient planning, return local networks to local control and take the shackles off their ability to
build and operate distributed generation, drop the charade of “what’s my number” retail “competition”
Establish a mechanism to install reserve generating capacity on the market margin without requiring all prices to
rise to long-run marginal cost. E.g. contract for reserve capacity as such, or build (or buy up) reserve capacity
owned by the state to backstop predominantly low-priced renewable supply
Instantly get rid of the perverse flow-through from carbon price to renewable price and rents
At retail level, rebalance prices so that household prices come back down from their current heights, as
1. rents and excess profits are stripped out of the supply chain;
2. industrial and commercial users pick up a bigger share of whatever supply-cost burden remains
Either regulate household prices down, or have a state-owned retailer competing with the other retailers and providing
a low-priced option, or go back to community-owned local not-for-profit retailers alongside independents, all with
access to bulk contracted supplies of cheap hydro
Make net metering mandatory to allow small independent suppliers of distributed renewable electricity such as
rooftop solar a share of the market and a role as disruptor of incumbents’ market power
But can you un-scramble an egg?
46What is to be done? Part 2
Break up the gentailers by forcing divestment of their retail operations
Abolish the lines/energy split at distribution level to allow local community-focused energy
operations to emerge with secure access to distribution networks and retail customers
Augment or abolish the limits on local lines operators’ investment in generation
Amend the ETS to allow renewables to bring down the electricity price
Massively overhaul the Commerce Commission’s approach to lines company regulation by
switching it from a floor price to a ceiling price, and with a ruthlessly sinking ceiling
Amend Part 4 of the Commerce Act to prescribe elimination, not just token “limitation”, of
excess profits
Give the Electricity Authority explicit instructions to genuinely advance the interests of
consumers and make sure it gets cracking
Install a single buyer or similar mechanism in the wholesale market and compel generators to
offer arms-length hedge contracts
Open the way for local electricity pooling (e.g. rooftop solar with battery backup on a
community scale) with a workable boundary interface with grid supply including net metering
….. and plenty more…….
47Outline for discussion of emissions trading
1. Economics of carbon tax and cap-and-trade
2. ‘Cap-and-trade’ without a cap
3. Interaction with electricity market and the Electricity Adjustment Factor
4. The “Cost Containment Reserve” is economic nonsense
5. Conclusion: policy options?
48Economics of emissions reduction
49CARBON TAX Tax High
imposed Price
price
=price certainty of
weeds
carbon
out
driven
less
Limited quota up
efficient
CAP AND TRADE rights polluters
=quantity certainty allocated
Emissions
Central fall
Production
authority
restricted
COMMAND AND CONTROL imposes
to meet
=quantity certainty enforceable
commands
limits on all Emissions
emitters fall only if
world price
is above
Emitters required to Price of units MAC.
EMISSIONS TRADING cover all emissions with settles at the Otherwise
= uncertainty carbon credits including world price no change
offshore-issued unitsThe “carbon market”
$ per tonne of CO2-e
Demand for emissions = Marginal Product
of Emissions = Marginal Abatement Cost
Emissions, Mt
OWith emissions unpriced, the economy emits ON
$ per tonne of CO2-e
Demand for emissions = Marginal Product
of Emissions = Marginal Abatement Cost
Unregulated emissions
Emissions, Mt
O NIf the price of emissions rises to Pe then the quantity falls to OM and the
emissions reduction (“abatement” or “mitigation”) is MN
$ per tonne of CO2-e
Demand for emissions = Marginal Abatement Cost
Regulated emissions quantity OM
Pe Unregulated emissions
Emissions, Mt
O M NOne way of doing it: a carbon tax of Pe would lead to MN of abatement
$ per tonne of CO2-e
Think of this as the cost of
emitting – I.e. the price of
exercising the right to emit
carbon
Pe CARBON TAX
Revenue to Government
Emissions, Mt
O M NOr the Government could impose a cap at M, issue permits, allow
trading, and the carbon price would be bid up to Pe
$ per tonne of CO2-e
Think of this as the
CAP [fixed] supply of rights to
emit carbon
Pe
Revenue to Government
if permits are auctioned;
windfalls to recipients
if permits are given away
Emissions, Mt
O M NWith international emissions trading there is neither a cap nor a
locally-set price
$ per tonne of CO2-e
Domestic cap
is irrelevant
Pe
Supply of
Pw
offshore credits
Emitters must acquire OK of carbon units
at price Pw for surrender to Government
Emissions, Mt
O M K NThe ETS: If open to imported units, the NZU price can’t
go above the world price of credits
From Geoff Bertram and Simon Terry The Carbon Challenge, 2010, p.122.But the carbon price could go lower if enough NZUs are issued:
like any paper currency, the NZU is subject to
inflation/devaluation if over-issued
with over-issue
NZUs on
issue
PL
CUnder the NZETS
NZUs are issued free to corporate insiders (a) to prevent carbon leakage and
(b) to compensate for any effect the ETS may have on the electricity price
NZUs can be earned by forestry operations if the forest owner opts in, and
these units can be sold into the market if the owner chooses not to bank them
Banked NZUs can be used to cover current emissions (there is currently a big
overhang of banked units)
Offshore carbon credits can be imported and used to cover local emissions if
and when the Minister authorises this (by getting an Order in Council)
The quantity of NZUs released for auction by Government is at the whim of
politicians subject to corporate capture
59The Electricity Allocation Factor (EAF)
The EAF is an estimate of the future impact of the New Zealand Emissions Trading
Scheme (NZ ETS) on wholesale electricity prices passed through to consumers. Its
expression is tonnes of carbon dioxide equivalent per megawatt hour (tCO2e/MWh). It
is part of the rates of allocation prescribed to industries considered ‘emissions intensive
and trade exposed’.
Initial setting 0.52 tCO2e/MWh.
The 2011 review of the EAF resulted in an EAF value of 0.537 tCO2e/MWh applied from
2013.
2019 MfE review suggested 0.1-0.48 tCO2e/MWh would be closer
(https://www.mfe.govt.nz/sites/default/files/media/Climate%20Change/modelling-eaf-
issues-paper.pdf )
2020 modelling produced estimates of -0.1 to 1.9 tCO2e/MWh
(https://www.mfe.govt.nz/sites/default/files/media/Energy/electricity-allocation-factor-
methodology-options.pdf )
But the beneficiaries are still getting 0.537 while discussion, consultation, modelling etc
roll on….
60The crucial missing ingredient is certainty
Section 30GB of the Climate Change Response Act covers the making of regulations about the
quantity of NZUs on issue and the price at which they can trade
Until you know the regulations you won’t know how many NZUs and offshore units will be
circulating, so the market price will be uncertain
Until regulations about imported units are known, the total allowed emissions quantity is
unknown
The regulations are to set a price ceiling (“trigger price”) at which a “cost control reserve”
amount of NZUs will be dumped into the market – but the present $50 ceiling lacks credibility
There is no enforcement mechanism for the trigger price apart from flooding the market with
extra units, which means the NZU issue volume is uncertain
From my submission a year ago: “The amended ETS legislation “leaves uncertain the extent to which
domestic emission targets can be overridden at any stage by allowing the importing of emission credits.
It fails to clarify whether the carbon price in the local market is to be (i) the marginal cost of domestic
abatement [at the emission budget], or (ii) determined by some external carbon price in a process of
arbitrage via cross-border trading, or (iii) just some politically determined “trigger” price. …
“The mere existence of the “cost containment reserve” provisions in the Bill destroys at one stroke the
credibility of both notional emission targets and expectations of linkage between local and overseas
carbon prices. The only “certainty” that is conferred by clause 30GB of the Bill is the certainty for large
and powerful vested interests that the NZETS will continue to be subject to political manipulation, and
hence to capture by those same rent-seeking large corporate interests, which have hitherto held the
scheme captive to their interests.”
61And some more from last year’s submission:
“The NZU is basically a voucher that entitles its holder to cover, by surrender to
the Government, whatever the implicit per-unit emission tax turns out to be in
each period. By issuing large numbers of these vouchers free of charge to
politically-influential insiders, the New Zealand Government in effect pays them
to pollute. By allowing the vouchers to be carried over to future periods in an
environment of price uncertainty, the Government makes them objects of
financial speculation and market manipulation for capital gain. Having allowed
NZU vouchers to be accumulated while emissions were covered by imported junk
units, the Government is now faced with a large stock of ‘banked’ NZUs
overhanging the market for the next few years.”
62Ineffectual attempts to create certainty
The ‘trigger price’ reflects Government’s terror of a high carbon price – but
may not be sustainable in the face of market developments (cf current
discussion of the housing market)
Promises to not allow too much importing of units can be broken at any time –
e.g. after a change of government
Leaving agriculture out is of uncertain credibility
Forestry decisions and hence claims to earn NZUs are inherently hard to
predict
The future world price and availability of offshore credits is unknowable
The Climate Change Commission recommends a budget which theoretically
could be the quantity limit, but
It’s advisory only
Non-ETA policy measures can cut across the market mechanism
63The Climate Change Commission draft report
Says (politely)(pp.131-134) that the ETS as it stands is not fit for
purpose and that (p.133) under the present governance arrangements
“some [market] risks are potentially catastrophic for the scheme’s
effectiveness.”
On the price issue:
“The Commission’s recommended emissions budgets differ from the provisional emissions budget that
was used to inform NZ ETS unit supply and price control settings for 2021-2025. In 2021, these settings
must be updated to cover the 2022-2026 period. They include the volume of units to be auctioned in
the NZ ETS as well as the auction reserve and cost containment reserve trigger prices, which start at
$20 and $50 respectively in 2021.
The Commission’s modelling indicates that meeting the 2050 target will involve marginal abatement
costs higher than these NZ ETS auction price control settings, at around $140 in 2030. In addition to
this indicative upper value, our evidence suggests that in process heat, a sector where an emissions
price can be expected to play an important role in driving decarbonisation, significant opportunities
exist at costs from around $50 upwards.”
64 On limiting the cost-containment reserve mechanism:
“The NZ ETS cost containment reserve trigger price should be set well above expected market
prices. An initial step up in value, to mitigate risks that it will be triggered and add to the NZU
stockpile, should be followed by annual increases to give a trajectory that allows for prices of at
least $140 in 2030.”
On forestry:
“The current framework for incentivising forests through the NZ ETS also does not align with
our recommended focus on driving gross emissions reductions and a change in the balance of
exotic versus native afforestation.”
On the scam record to date:
“The Government has recognised that the regulatory framework governing conduct in the NZ
ETS market is patchy and incomplete. It has established a work programme to address the lack
of good governance and associated risks, which include insider trading, market manipulation,
false or misleading advice to participants, potential lack of transparency and oversight of trades
in the secondary market, money laundering, credit and counter-party risks and conflicts of
interest.”
65 On free industry allocation, Commission recommends
“Undertaking a first principles review of industrial allocation policy, considering the
fundamental design of the current policy as well as overallocation risks, eligibility rules, updates
to the Electricity Allocation Factor and allocative baselines.
Continuing to phase out industrial allocation.
Exploring alternative policy instruments that could address the risk of emissions leakage, such
as product standards, consumption taxes and border carbon adjustments. “
On the political non-credibility at present:
“it would be useful for the Government to clarify how it intends to manage NZ ETS unit volumes
in light of the split-gas 2050 target and the planned inclusion of biogenic agricultural emissions
in a separate pricing mechanism. One option the Government could consider would be to
outline its approach to making adjustments over time in a published document or policy. “
66Beyond this the Commission foreshadows
masses of non-market interventions
Accelerated EV uptake and banning new ICE vehicles (pp.107-109)
Banning new gas connections to buildings from 2025 (p.117)
Tighten emnission-control regulations (p.110)
Actively push strategic shirt in transport off road and onto rail and shipping
(p.110)
Ban new coal-fired boilers (p.115)
Mandatory energy performance standards for buildings (p.17)
Mandatory reporting of climate-related risks (p.128)
Payments to industry to retire emission-intensive plant (p.129)
67A final word about electrification and
decarbonisation
68The electricity industry corporates want just to transform the energy
inputs to a relatively untransformed economy and society
So their call is for Government to force the pace on electricity demand by incentivizing EV
uptake and process heat retrofitting
And of course they want “certainty” and RMA reform to encourage profitable generation
construction on a large scale
Also, of course, they suggest no change to the current electricity market set-up, where their
profits improve with
increased demand
reduced costs of consenting and construction
preservation of enough fossil fuels at the margin to keep the price up way above the near-zero
operating cost of renewable generation
an ETS written by and for rent-seekers
69To its credit, the Commission does hope for more independent
entry into generation, including lots of solar, and
it pushes biomass as well as electricity for process heat
it notes that energy efficiency is a substitute for increased electricity supply: “electricity is part of a
broader energy transition. Alternative options for reducing emissions should be considered, as other
actions may have a larger impact for the same cost.” (p.112)
it argues explicitly for “more independent generation and distributed generation, especially for
remote rural and Māori communities, and ensure access to capital for this purpose
BUT it never ever suggests any transformation of
the electricity market’s institutional set-up
70The electricity industry’s central strategic goal: maximize
electricity demand while blocking the path to 100% renewables
So long as fossil fuels stay in the mix, they are at the wholesale market margin and so set the
spot price way above the supply cost of hydro, geothermal and wind
So long as fossil fuels are on the margin, every increase in the carbon price - whether via the
ETS or otherwise - pushes up the price of all electricity, including renewables
The viability of small-scale distributed generation such as rooftop solar is very sensitive to the
price structure facing households: removing the low-fixed-charge regulation is a quick way to
kill rooftop solar for a decade. As Chapter 12 of the book says (p.135) “only about half to two-
thirds of the number of households that would currently be able to pay off a retrofit in under 10
years would be able pay it off in that timeframe under the CFC regimen.”
The big threat to industry profit is the huge wind resource, but the gentailer cartel has locked
up and “banked” the best sites (plus several hydro options)
71The Commission’s proposed “path to 2035”
72
Source: constructed from dataset at https://ccc-production-media.s3.ap-southeast-
2.amazonaws.com/public/2021-Draft-Advice-Report-charts-and-data-v3.xlsxhttps://www.mfe.govt.nz/ets/mar
ket-info-portal
73https://www.mfe.govt.nz/ets/mar
ket-info-portal
74Removal units
Free allocation
Auction volume
Liable emissions
Deforestation
75
https://www.mfe.govt.nz/ets/market-info-portalYou can also read