Deep Learning Methods for Modeling Bitcoin Price
←
→
Page content transcription
If your browser does not render page correctly, please read the page content below
mathematics
Article
Deep Learning Methods for Modeling Bitcoin Price
Prosper Lamothe-Fernández 1 , David Alaminos 2, * , Prosper Lamothe-López 3
and Manuel A. Fernández-Gámez 4
 1   Department of Financing and Commercial Research, UDI of Financing, Calle Francisco Tomás y Valiente, 5,
     Universidad Autónoma de Madrid, 28049 Madrid, Spain; prosper.lamothe@uam.es
 2   Department of Economic Theory and Economic History, Campus El Ejido s/n, University of Malaga,
     29071 Malaga, Spain; mangel@uma.es
 3   Rho Finanzas Partner, Calle de Zorrilla, 21, 28014 Madrid, Spain; pll@rhofinanzas.com
 4   Department of Finance and Accounting, Campus El Ejido s/n, University of Malaga, 29071 Malaga, Spain
 *   Correspondence: alaminos@uma.es

 Received: 25 June 2020; Accepted: 28 July 2020; Published: 30 July 2020

 Abstract: A precise prediction of Bitcoin price is an important aspect of digital financial markets
 because it improves the valuation of an asset belonging to a decentralized control market. Numerous
 studies have studied the accuracy of models from a set of factors. Hence, previous literature shows
 how models for the prediction of Bitcoin suffer from poor performance capacity and, therefore,
 more progress is needed on predictive models, and they do not select the most significant variables.
 This paper presents a comparison of deep learning methodologies for forecasting Bitcoin price and,
 therefore, a new prediction model with the ability to estimate accurately. A sample of 29 initial factors
 was used, which has made possible the application of explanatory factors of different aspects related
 to the formation of the price of Bitcoin. To the sample under study, different methods have been
 applied to achieve a robust model, namely, deep recurrent convolutional neural networks, which have
 shown the importance of transaction costs and difficulty in Bitcoin price, among others. Our results
 have a great potential impact on the adequacy of asset pricing against the uncertainties derived
 from digital currencies, providing tools that help to achieve stability in cryptocurrency markets.
 Our models offer high and stable success results for a future prediction horizon, something useful for
 asset valuation of cryptocurrencies like Bitcoin.

 Keywords: bitcoin; deep learning; deep recurrent convolutional neural networks; forecasting;
 asset pricing

1. Introduction
     Bitcoin is a cryptocurrency built by free software based on peer-to-peer networks as an irreversible
private payment platform. Bitcoin lacks a physical form, is not backed by any public body,
and therefore any intervention by a government agency or other agent is not necessary to transact [1].
These transactions are made from the blockchain system. Blockchain is an open accounting book,
which records transactions between two parties efficiently, leaving such a mark permanently and
impossible to erase, making this tool a decentralized validation protocol that is difficult to manipulate,
and with low risk of fraud. The blockchain system is not subject to any individual entity [2].
     For Bitcoin, the concept originated from the concept of cryptocurrency, or virtual currency [3].
Cryptocurrencies are a monetary medium that is not affected by public regulation, nor is it subject to a
regulatory body. It only affects the activity and rules developed by the developers. Cryptocurrencies
are virtual currencies that can be created and stored only electronically [4]. The cryptocurrency is
designed to serve as a medium of exchange and for this, it uses cryptography systems to secure the
transaction and control the subsequent creation of the cryptocurrency. Cryptocurrency is a subset of a

Mathematics 2020, 8, 1245; doi:10.3390/math8081245                         www.mdpi.com/journal/mathematics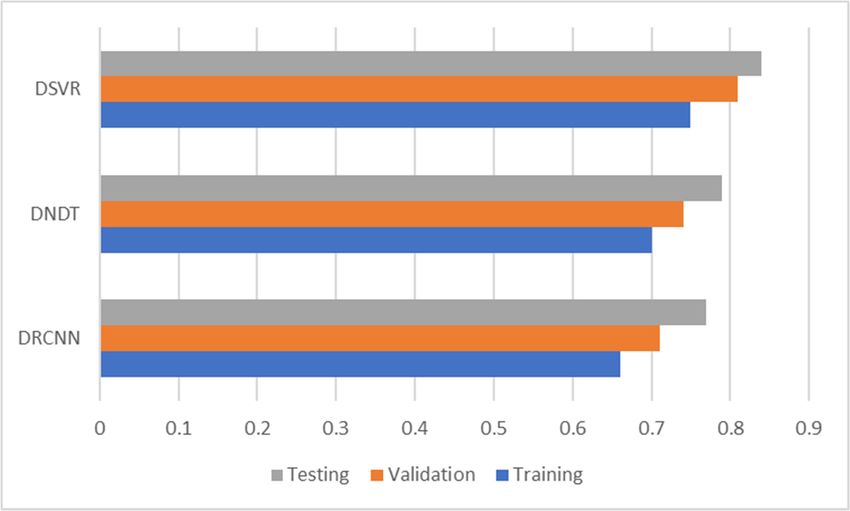
Mathematics 2020, 8, 1245                                                                         2 of 13

digital currency designed to function as a medium of exchange and cryptography is used to secure the
transaction and control the future creation of the cryptocurrency.
     Forecasting Bitcoin price is vitally important for both asset managers and independent investors.
Although Bitcoin is a currency, it cannot be studied as another traditional currency where economic
theories about uncovered interest rate parity, future cash-flows model, and purchasing power parity
matter, since different standard factors of the relationship between supply and demand cannot
be applied in the digital currency market like Bitcoin [5]. On the one hand, Bitcoin has different
characteristics that make it useful for those agents who invest in Bitcoin, such as transaction speed,
dissemination, decentrality, and the large virtual community of people interested in talking and
providing relevant information about digital currencies, mainly Bitcoin [6].
     Velankar and colleagues [7] attempted to predict the daily price change sign as accurately as
possible using Bayesian regression and generalized linear model. To do this, they considered the daily
trends of the Bitcoin market and focused on the characteristics of Bitcoin transactions, reaching an
accuracy of 51% with the generalized linear model. McNally and co-workers [8] studied the precision
with which the direction of the Bitcoin price in United States Dollar (USD) can be predicted. They used
a recurrent neural network (RNN), a long short-term memory (LSTM) network, and the autoregressive
integrated moving average (ARIMA) method. The LSTM network obtains the highest classification
accuracy of 52% and a root mean square error (RMSE) of 8%. As expected, non-linear deep learning
methods exceeded the ARIMA method’s prognosis. For their part, Yogeshwaran and co-workers [9]
applied convolutional and recurrent neural networks to predict the price of Bitcoin using data from
a time interval of 5 min to 2 h, with convolutional neural networks showing a lower level of error,
at around 5%. Demir and colleagues [10] predicted the price of Bitcoin using methods such as long
short-term memory networks, naïve Bayes, and the nearest neighbor algorithm. These methods
achieved accuracy rates between 97.2% and 81.2%. Rizwan, Narejo, and Javed [11] continued with the
application of deep learning methods with the techniques of RNN and LSTM. Their results showed an
accuracy of 52% and an 8% RMSE by the LSTM. Linardatos and Kotsiantis [12] had the same results,
after using eXtreme Gradient Boosting (XGBoost) and LSTM; they concluded that this last technique
yielded a lower RMSE of 0.999. Despite the superiority of computational techniques, Felizardo and
colleagues [13] showed that ARIMA had a lower error rate than methods, such as random forest (RF),
support vector machine (SVM), LSTM, and WaveNets, to predict the future price of Bitcoin. Finally,
other works showed new deep learning methods, such as Dutta, Kumar, and Basu [14], who applied
both LSTM and the gated recurring unit (GRU) model; the latter showed the best error result, with an
RMSE of 0.019. Ji and co-workers [15] predicted the price of Bitcoin with different methodologies such
as deep neural network (DNN), the LSTM model, and convolutional neural network. They obtained a
precision of 60%, leaving the improvement of precision with deep learning techniques and a greater
definition of significant variables as a future line of research. These authors show the need for stable
prediction models, not only with data in and out of the sample, but also in forecasts of future results.
     To contribute to the robustness of the Bitcoin price prediction models, in the present study a
comparison of deep learning methodologies to predict and model the Bitcoin price is developed and,
as a consequence, a new model that generates better forecasts of the Bitcoin price and its behavior in
the future. This model can predict achieving accuracy levels above 95%. This model was constructed
from a sample of 29 variables. Different methods were applied in the construction of the Bitcoin price
prediction model to build a reliable model, which is contrasted with various methodologies used in
previous works to check with which technique a high predictive capacity is achieved; specifically,
the methods of deep recurrent neural networks, deep neural decision trees, and deep support vector
machines, were used. Furthermore, this work attempts to obtain high accuracy, but it is also robust
and stable in the future horizon to predict new observations, something that has not yet been reported
by previous works [7–15], but which some authors demand for the development of these models and
their real contribution [9,12].
Mathematics 2020, 8, 1245                                                                             3 of 13

     We make two main contributions to the literature. First, we consider new explanatory variables for
modeling the Bitcoin price, testing the importance of these variables which have not been considered
so far. It has important implications for investors, who will know which indicators provide reliable,
accurate, and potential forecasts of the Bitcoin price. Second, we improve the prediction accuracy
concerning that obtained in previous studies with innovative methodologies.
     This study is structured as follows: Section 2 explains the theory of methods applied. Section 3
offers details of the data and the variables used in this study. Section 4 develops the results obtained.
Section 5 provides conclusions of the study and the purposes of the models obtained.

2. Deep Learning Methods
     As previously stated, different deep learning methods have been applied for the development of
Bitcoin price prediction models. We use this type of methodology thanks to its high predictive capacity
obtained in the previous literature on asset pricing to meet one of the objectives of this study, which is
to achieve a robust model. Specifically, deep recurrent convolution neural network, deep neural
decision trees, and deep learning linear support vector machines have been used. The characteristics
of each classification technique used are detailed below. In addition, the method of analysis of the
sensitivity of variables used in the present study, in particular, the method of Sobol [16], which is
necessary to determine the level of significance of the variables used in the prediction of Bitcoin price is
recorded, fulfilling the need presented by the previous literature in the realization of the task of feature
selection [15].

2.1. Deep Recurrent Convolution Neural Network (DRCNN)
     Recurrent neural networks (RNN) have been applied in different fields for prediction due to its
huge prediction performance. The previous calculations made are those that form the result within the
structure of the RNN [17]. Having an input sequence vector x, the hidden nodes of a layer s, and the
output of a hidden layer y, can be estimated as explained in Equations (1) and (2).

                                        st = σ(Wxs xt + Wss st−1 + bs )                                  (1)

                                             yt = o(Wso st + by )                                        (2)

where Wxs , Wss , and Wso define the weights from the input layer x to the hidden layer s, by the biases
of the hidden layer and output layer. Equation (3) points out σ and o as the activation functions.
                                                            Z   +∞
                            STFT{z(t)}(τ, ω) ≡ T (τ, ω) =            z(t)ω(t − τ)e− jωt dt               (3)
                                                                −∞

where z(t) is the vibration signals, and ω(t) is the Gaussian window function focused around 0. T(τ, ω)
is the function that expresses the vibration signals. To calculate the hidden layers with the convolutional
operation, Equations (4) and (5) are applied.

                                      St = σ(WTS ∗ Tt + Wss ∗ St−1 + Bs )                                (4)

                                            Yt = o(WYS ∗ St + By )                                       (5)

where W indicates the convolution kernels.
     Recurrent convolutional neural network (RCNN) can be heaped to establish a deep architecture,
called the deep recurrent convolutional neural network (DRCNN) [18,19]. To use the DRCNN method
in the predictive task, Equation (6) determines how the last phase of the model serves as a supervised
learning layer.
                                          r̂ = σ(Wh ∗ h + bh )                                      (6)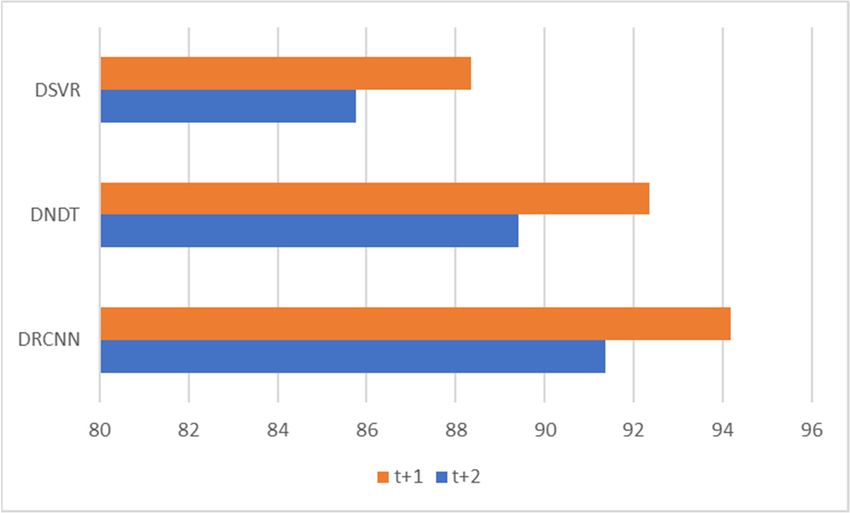
Mathematics 2020, 8, 1245                                                                             4 of 13

where Wh is the weight and bh is the bias. The model calculates the residuals caused by the difference
between the predicted and the actual observations in the training stage [20]. Stochastic gradient descent
is applied for optimization to learn the parameters. Considering that the data at time t is r, the loss
function is determined as shown in Equation (7).

                                                ^        1      ^
                                            L(r, r ) =     kr − rk22                                     (7)
                                                         2

2.2. Deep Neural Decision Trees (DNDT)
     Deep neural decision trees are decision tree (DT) models performed by deep learning neural
networks, where a weight division corresponding to the DNDT belongs to a specific decision tree and,
therefore, it is possible to interpret its information [21]. Stochastic gradient descent (SGD) is used to
optimize the parameters at the same time; this partitions the learning processing in mini-batches and
can be attached to a larger standard neural network (NN) model for end-to-end learning with backward
propagation. In addition, standard DTs gain experience through a greedy and recursive factor division.
This can make a selection of functions more efficient [22]. The method starts by performing a soft
binning function to compute the residual rate for each node, making it possible to make decisions
divided into DNDTs [23]. The input of a binning function is a real scalar x which makes an index of the
containers to which x belongs.
     The activation function of the DNDT algorithm is carried out based on the NN represented in
Equation (8).
                                    π = fw,b,τ (x) = softmax((wx + b)/τ)                              (8)

where w is a constant with value w = [1, 2, ..., n + 1], τ > 0 is a temperature factor, and b is defined in
Equation (9).
                          b = [0, −β1, −β1, −β2, ..., −β1 − β2 − · · · − βn]                            (9)

     The coding of the binning function x is given by the NN according the expression of Equation (9) [24].
The key idea is to build the DT with the applied Kronecker product from the binning function defined
above. Connecting every feature xd with its NN fd (xd ), we can determine all the final nodes of the DT
as appears in Equation (10).
                                   z = f1(x1) ⊗ f2(x2) ⊗ · · · ⊗fD(xD)                                (10)

where z expresses the leaf node index obtained by instance x in vector form. The complexity parameter
of the model is determined by the number of cut points of each node. There may be inactive points
since the values of the cut points are usually not limited.

2.3. Deep Learning Linear Support Vector Machines (DSVR)
    Support vector machines (SVMs) were created for binary classification. Training data are
denoted by its labels (xn , yn ), n = 1, . . . , N, xn ∈ RD , tn ∈ {−1, +1}; SVMs are optimized according to
Equation (11).
                                            min 12 W T W + C N    n = 1 ξn
                                                                P
                                         wξn
                                        s.t. W T xn tn ≥ 1 − ξn > ∀n                                   (11)
                                                  ξn ≥ 0 ∀n
where ξn are features that punish observations that do not meet the margin requirements [25].
The optimization problem is defined as appears in Equation (12).

                                  1          XN
                               min W T W + C      max(1 − W T xn tn , 0)                               (12)
                                w 2           n=1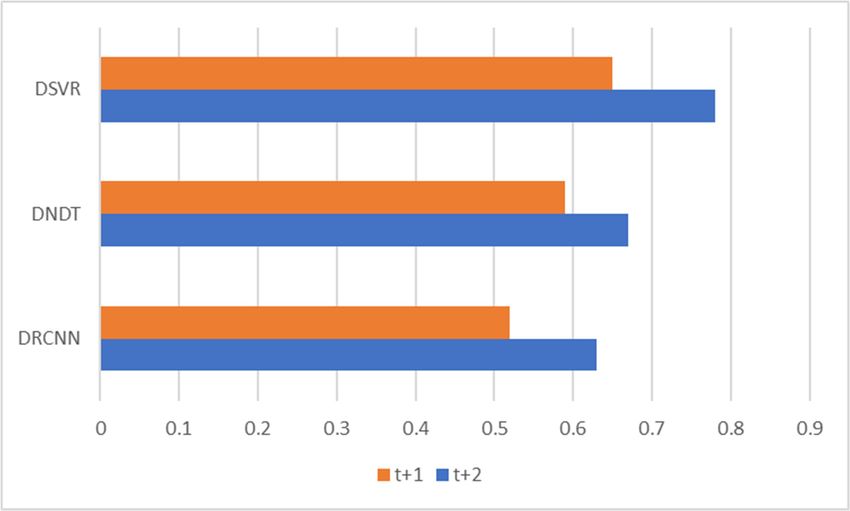
Mathematics 2020, 8, 1245                                                                             5 of 13

     Usually the Softmax or 1-of-K encoding method is applied in the classification task of deep
learning algorithms. In the case of working with 10 classes, the Softmax layer is composed of 10 nodes
and expressed by pi , where i = 1, ..., 10; pi specifies a discrete probability distribution, 10
                                                                                             P
                                                                                              i pi = 1.
     Equation (13) is defined by h as the activation of the penultimate layer nodes, W as the weight
linked by the penultimate layer to the Softmax layer, and the total input into a Softmax layer. The next
expression is the result.                            X
                                                ai =      hk Wki                                        (13)
                                                               k

                                                       exp(ai )
                                                 pi = P10                                              (14)
                                                       j exp(a j )

      The predicted class î would be as follows in Equation (15).

                                        î = argmaxpi = argmaxai                                        (15)
                                                       i                     i

     Since linear-SVM is not differentiable, a popular variation is known as the DSVR, which minimizes
the squared hinge loss as indicated in Equation (16).

                                  1          XN                          2
                               min W T W + C      max(1 − W T xn tn , 0)                               (16)
                                w 2           n=1

     The target of the DSVR is to train deep neural networks for prediction [24,25]. Equation (17)
expresses the differentiation of the activation concerning the penultimate layer, where l (w) is said
differentiation, changing the input x for the activation h.

                                     ∂l(w)
                                           = −Ctn w(I{1 > wT ht tn })                                  (17)
                                      ∂hn

where I{·} is the indicator function. Likewise, for the DSVR, we have Equation (18).

                                  ∂l(w)
                                        = −2Ctn w(max(1 − W T hn tn , 0))                              (18)
                                   ∂hn

2.4. Sensitivity Analysis
     Data mining methods have the virtue of offering a great amount of explanation to the authors’
studied problem. To know what the degree is, sensitivity analysis is performed. This analysis tries to
quantify the relative importance of the independent variables concerning the dependent variable [26,27].
To do this, the search for the reduction of the set of initial variables continues, leaving only the most
significant ones. The variance limit follows, where one variable is significant if its variance increases
concerning the rest of the variables as a whole. The Sobol method [16] is applied to decompose the
variance of the total output V (Y) offered by the set of equations expressed in Equation (19).
                                        X              X X
                             V (Y ) =           Vi +                     Vij + . . . + V1,2,...k       (19)
                                            i              i       j>1

where Vi = VE(Y Xi ) and Vij = VE(Y Xi , X j )) − Vi − V j .
    Si = Vi/V and Sij = Vij /V define the sensitivity indexes, with Sij being the effect of interaction
between two variables. The Sobol decomposition allows the estimation of a total sensitivity index, STi,
which measures the sum of all the sensitivity effects involved in the independent variables.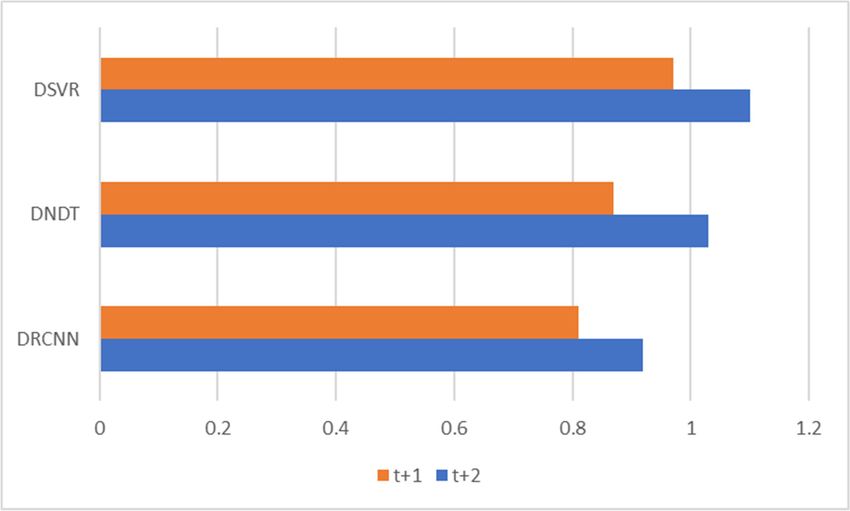
Mathematics 2020, 8, 1245                                                                           6 of 13

3. Data and Variables
     The sample period selected is from 2011 to 2019, with a quarterly frequency of data. To obtain the
information of the independent variables, data from the IMF’s International Financial Statistics (IFS),
the World Bank, FRED Sant Louis, Google Trends, Quandl, and Blockchain.info were used.
     The dependent variable used in this study is the Bitcoin price and is defined as the value of Bitcoin
in USD. In addition, we used 29 independent variables, classified into demand and supply variables,
attractiveness, and macroeconomic and financial variables, as possible predictors of the Bitcoin future
price (Table 1). These variables were used throughout the previous literature [1,3,4,14].

                                      Table 1. Independent variables.

           Variables                          Description
           (a) Demand and Supply
           Transaction value                  Value of daily transactions
                                              Number of mined Bitcoins currently circulating on
           Number of Bitcoins
                                              the network
           Bitcoins addresses                 Number of unique Bitcoin addresses used per day
           Transaction volume                 Number of transactions per day
           Unspent transactions               Number of valid unspent transactions
           Blockchain transactions            Number of transactions on blockchain
           Blockchain addresses               Number of unique addresses used in blockchain
           Block size                         Average block size expressed in megabytes
           Miners reward                      Block rewards paid to miners
           Mining commissions                 Average transaction fees (in USD)
                                              Miners’ income divided by the number of
           Cost per transaction
                                              transactions
           Difficulty                         Difficulty mining a new blockchain block
           Hash                               Times a hash function can be calculated per second
           Halving                            Process of reducing the emission rate of new units
           (b) Attractive
           Forum posts                        Number of new members in online Bitcoin forums
           Forum members                      New posts in online Bitcoin forums
           (c) Macroeconomic and Financial
           Texas oil                          Oil Price (West Texas)
           Brent oil                          Oil Price (Brent, London)
           Dollar exchange rate               Exchange rate between the US dollar and the euro
           Dow Jones                          Dow Jones Index of the New York Stock Exchange
           Gold                               Gold price in US dollars per troy ounce

     The sample is fragmented into three mutually exclusive parts, one for training (70% of the data),
one for validation (10% of the data), and the third group for testing (20% of the data). The training data
are used to build the intended models, while the validation data attempt to assess whether there is
overtraining of those models. As for the test data, they serve to evaluate the built model and measure
the predictive capacity. The percentage of correctly classified cases is the precision results and RMSE
measures the level of errors made. Furthermore, for the distribution of the sample data in these three
phases, cross-validation 10 times with 500 iterations was used [28,29].

4. Results

4.1. Descriptive Statistics
    Table 2 shows a statistical summary of the independent variables for predicting Bitcoin price. It is
observed that all the variables obtain a standard deviation not higher than each value of the mean.
Therefore, the data show initial stability. On the other hand, there is a greater difference between
the minimum and maximum values. Variables like mining commissions and cost per transaction
show a small minimum value compared to their mean value. The same fact happens with the hash
Mathematics 2020, 8, 1245 7 of 13
variable. Despite these extremes, they do not affect the values of the standard deviations of the
respective variables.
Table 2. Summary statistics.
Variables Obs Mean SD Min Max
Transaction value 112 342,460,106,866,711.0000 143,084,554,727,531.0000 59,238,547,391,199.6000 735,905,260,141,564.0000
Number of bitcoins 112 13,634,297.4824 3,709,010.0736 5,235,454.5455 18,311,982.5000
Bitcoins addresses 112 285,034.2515 219,406.3874 1576.8333 849,668.1000
Transaction volume 112 154,548.8041 117,104.3686 1105.5000 373,845.6000
Unspent transactions 112 28,581,914.9054 22,987,595.3012 78,469.7273 66,688,779.9000
Blockchain transactions 112 156,444,312.9120 161,252,448.1997 237,174.8889 520,792,976.5000
Blockchain addresses 112 4,812,692.05 13,735,245.35 −14,437,299.03 117,863,226.2
Block size 112 0.4956 0.3638 0.0022 0.9875
Miners reward 112 420,160,582,581,028.0000 174,396,895,338,462.0000 101,244,436,734,897.0000 796,533,076,376,536.0000
Mining commissions 112 9,581,973,325,205.4400 42,699,799,790,392.8000 0.2591 315,387,506,596,395.0000
Cost per transaction 112 155,354,364,458,705.0000 156,696,788,525,225.0000 0.1179 757,049,771,708,905.0000
Difficulty 112 187,513,499,336,866.0000 195,421,886,528,251.0000 212,295,141,771.2000 836,728,509,520,663.0000
Hash 112 110,434,372.2765 154,717,725.3881 0.5705 516,395,703.4338
Halving 112 279,853,454,485,387.0000 162,806,469,642,875.0000 6,473,142,955,255.1700 804,437,327,302,638.0000
Forum posts 112 9279.8844 8585.0583 455.0000 53132.0000
Forum members 112 2432.2545 3394.4635 30.6364 14,833.3409
Texas Oil 112 72.4878 23.7311 21.1230 135.6700
Brent Oil 112 78.4964 26.5819 19.1900 139.3800
Dollar exchange rate 112 1.3767 0.9604 1.0494 8.7912
Dow Jones 112 15,926.7161 3324.8875 11,602.5212 22,044.8627
Gold 112 1329.400847 244.4099259 739.15 1846.75
4.2. Empirical Results
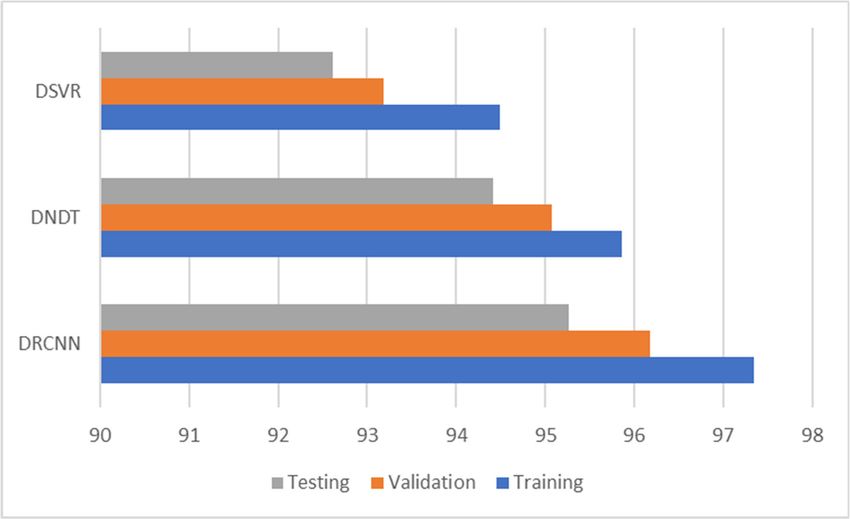
Table 3 and Figures 1–3 show the level of accuracy, the root mean square error (RMSE), and the
mean absolute percentage error (MAPE). In all models, the level of accuracy always exceeds 92.61%
for testing data. For its part, the RMSE and MAPE levels are adequate. The model with the highest
accuracy is that of deep recurrent convolution neural network (DRCNN) with 97.34%, followed by the
model of deep neural decision trees (DNDT) method with 96.94% on average by regions. Taken together,
these results provide a level of accuracy far superior to that of previous studies. Thus, in the work of Ji
and co-workers [15], an accuracy of around 60% is revealed; in the case of McNally and co-workers [8],
it is close to 52%; and in the study of Rizwan, Narejo, and Javed [11], it approaches 52%. Finally,
Table 4 shows the most significative variables by methods after applying the Sobol method for the
sensitivity analysis.
Table 3. Results of accuracy evaluation: classification (%).
DRCNN DNDT DSVR
Sample
Acc. (%) RMSE MAPE Acc. (%) RMSE MAPE Acc. (%) RMSE MAPE
Training 97.34 0.66 0.29 95.86 0.70 0.33 94.49 0.75 0.38
Validation 96.18 0.71 0.34 95.07 0.74 0.37 93.18 0.81 0.43
Testing 95.27 0.77 0.40 94.42 0.79 0.42 92.61 0.84 0.47
DRCNN: deep recurrent convolution neural network; DNDT: deep neural decision trees; DSVR: deep learning linear
support vector machines; Acc: accuracy; RMSE: root mean square error; MAPE: mean absolute percentage error.Mathematics
Mathematics 2020,
2020, 8,
8, xx FOR
FOR PEER
PEER REVIEW
REVIEW 88 of
of 14
14
Mathematics 2020, 8, 1245 8 of 13
Table
Table 3.
3. Results
Results of
of accuracy
accuracy evaluation:
evaluation: classification
classification (%).
(%).
Table 4. Results of accuracy evaluation: greater sensitivity variables.
DRCNN
DRCNN DNDT
DNDT DSVR
DSVR
Sample DRCNN DNDT DSVR
Sample Acc.
Acc.
Acc.
Acc. (%)
(%) RMSE
RMSEvalueMAPE
Transaction Acc.
Acc. (%)
MAPE Transaction RMSE
(%) volume
RMSE MAPE
MAPE
Transaction value RMSE
RMSE MAPE
MAPE
(%)
(%)
Transaction volume Block size Block size
Training
Training 97.34
97.34 0.66
0.66 0.29 95.86
0.29 Blockchain 0.70
95.86transactions
0.70 0.33
0.33 94.49
94.49 0.75
0.75 0.38
0.38
Block size Blockchain transactions
Validatio
Validatio Cost per transaction Cost per transaction Cost per transaction
96.18
96.18 0.71
0.71 0.34
0.34 95.07
95.07 0.74
0.74 0.37
0.37 93.18
93.18 0.81
0.81 0.43
0.43
nn Difficulty Difficulty Difficulty
Testing
Testing 95.27
95.27 0.77
Dollar exchange
0.77 rate0.40
0.40 94.42
94.42 posts 0.79
Forum 0.79 0.42
0.42Forum 92.61
posts
92.61 0.84
0.84 0.47
0.47
DRCNN: Dow Jones Dow Jones Dollar exchange rate
DRCNN: deep
deep recurrent
recurrent convolution
convolution neural
neural network;
network; DNDT:
DNDT: deep
deep neural
neural decision
decision trees;
trees; DSVR:
DSVR: deep
deep learning
learning
Gold Gold Dow Jones
linear
linear support
support vector
vector machines;
machines; Acc:
Acc: accuracy;
accuracy; RMSE:
RMSE: rootroot mean
mean square
square error;
error; MAPE:
MAPE: mean absolute percentage
Gold mean absolute percentage
error.
error.
Figure
Figure 1.
Figure 1. Results
1. Results of
of accuracy
accuracy evaluation:
evaluation: classification
classification (%).
(%).
Figure
Figure 2.
2. Results
Results of accuracy evaluation:
evaluation: RMSE.
Figure 2. Results of
of accuracy
accuracy evaluation: RMSE.
RMSE.Mathematics 2020, 8, 1245 9 of 13
Mathematics 2020, 8, x FOR PEER REVIEW 9 of 14
Figure 3.
Figure 3. Results
Results of
of accuracy
accuracy evaluation: MAPE.
evaluation: MAPE.
Table 4 shows additional information
Table 4. Results on evaluation:
of accuracy the significant variables.
greater Block
sensitivity size, cost per transaction,
variables.
and difficulty were significant in the three models for each method applied. This demonstrates the
DRCNN DNDT DSVR
importance of the cost to carry out the Bitcoin transaction, of the block of Bitcoins to buy, as well as the
difficulty of the Transaction
miners to value
find new Bitcoins,Transaction
as thevolume
main factors in Transaction value
the task of determining the price
Transaction volume Block size Block
of Bitcoin. This contrasts with the results shown in previous studies, where these variables are not size
significant or are not Blockusedsizeby the initialBlockchain transactions
set of variables Blockchain
[5,7,8]. The best resultstransactions
were obtained by the
DRCNN method, Cost where
per transaction
in addition to the Cost per transactionvariables,
aforementioned Cost
theper transaction
transaction value, transaction
volume, block size,Difficulty
dollar exchange rate, Dow Difficulty
Jones, and gold were alsoDifficulty
significant. This shows that
the demand and Dollar exchange
supply rate of the Bitcoin
variables Forum postsare essential to predict
market Forum its posts
price, something that
has been shown by Dowsome Jones
previous works [1,30]. DowYetJones Dollar exchange
significant macroeconomic and rate
financial variables
have not been observed Gold as important factors by Gold
other recent works [30,31], DowsinceJonesthey were shown as
variables that did not influence Bitcoin price fluctuations. In our results, the Gold
macroeconomic variables
of Dow Jones and gold have been significant in all methods.
Table 4 shows additional information on the significant variables. Block size, cost per
On the other
transaction, hand, thewere
and difficulty models built byin
significant thetheDNDT
threeand DSVR
models formethods
each methodshow high levels
applied. of
This
precision,
demonstratesalthough lower than of
the importance those
the obtained by the
cost to carry outDRCNN. Furthermore,
the Bitcoin transaction, these methods
of the block show some
of Bitcoins
different
to buy, assignificant
well as thevariables.
difficultySuch of theis miners
the casetooffind
the new
variables of forum
Bitcoins, as theposts,
main afactors
variable popularly
in the task of
used as a proxy
determining thefor the of
price level of future
Bitcoin. Thisdemand
contrasts that Bitcoin
with could have,
the results shown although with studies,
in previous divergences
wherein
previous works regarding its significance to predict the price of Bitcoin, where some
these variables are not significant or are not used by the initial set of variables [5,7,8]. The best results works show that
this
werevariable
obtained is not
by significant
the DRCNN [11,14]. Finally,
method, these
where inmethods
additionshowto the another macroeconomic
aforementioned variable
variables, the
that is morevalue,
transaction significant, in the volume,
transaction case of the dollar
block exchange
size, rate. Thisrate,
dollar exchange represents
Dow Jones, the importance
and gold werethat
changes in the price
also significant. This of the USD
shows that with Bitcoin and
the demand can be decisive
supply in estimating
variables the possible
of the Bitcoin marketdemand and,
are essential
therefore,
to predict aitschange
price, in price. This
something variable,
that has been likeshown
the restbyofsome
the macroeconomic
previous worksvariables,
[1,30]. Yethas not been
significant
shown as a significant
macroeconomic variablevariables
and financial [5,31]. have not been observed as important factors by other recent
works This set ofsince
[30,31], variables
they observed
were shown as significant
as variablesrepresents
that did anot
group of novel
influence factors
Bitcoin thatfluctuations.
price determine theIn
price of Bitcoin
our results, and therefore, isvariables
the macroeconomic different offromDowthat shown
Jones andin the have
gold previous
beenliterature.
significant in all methods.
On the other hand, the models built by the DNDT and DSVR methods show high levels of
4.3. Post-Estimations
precision, although lower than those obtained by the DRCNN. Furthermore, these methods show
someIndifferent significant
this section, variables.
we try to Such is the of
perform estimations case of the
models variablesforecasts
to generate of foruminposts, a variable
a future horizon.
popularly
For this, weused
usedas thea framework
proxy for the level of future
of multiple-step demand
ahead that Bitcoin
prediction, applyingcould have, although
the iterative strategywith
and
divergences
models built in
to previous
predict one works
step regarding
forward areitstrained
significance
[32]. Atto time
predict
t, a the price ofisBitcoin,
prediction made for where
momentsomet
+works
1, andshow that this isvariable
this prediction used to is not significant
predict t + 2 and
for moment[11,14]. Finally,
so on. these methods
This means thatshow another
the predicted
data for t + 1 arevariable
macroeconomic thatreal
considered is more significant,
data and are addedin to
thethecase
endof of the dollar exchange
the available rate.
data [33]. This
Table 5
represents the importance that changes in the price of the USD with Bitcoin can be decisive in4.3. Post-Estimations
In this section, we try to perform estimations of models to generate forecasts in a future horizon.
For this, we used the framework of multiple-step ahead prediction, applying the iterative strategy
Mathematics
and models 2020, 8, 1245
built to predict one step forward are trained [32]. At time t, a prediction is made 10 offor
13
moment t + 1, and this prediction is used to predict for moment t + 2 and so on. This means that the
predicted
and Figures data
4–6for t + 1the
show areaccuracy
consideredandreal data
error and are
results for added
t + 1 andto the
t + 2end of the available
forecasting data
horizons. [33].
For t+
Table 5 and Figures 4–6 show the accuracy and error results for t + 1 and t + 2 forecasting
1, the range of precision for the three methods is 88.34–94.19% on average, where the percentage of horizons.
For t + 1,isthe
accuracy range
higher of precision
in the for the three
DRCNN (94.19%). For t methods is 88.34–94.19%
+ 2, this range of precisionon average, where
is 85.76–91.37%, the
where
percentage of accuracy is higher in the DRCNN (94.19%). For t + 2, this range of
the percentage of accuracy is once again higher in the DRCNN (91.37%). These results show the high precision is 85.76–
91.37%,
precisionwhere the percentage
and great robustnessofofaccuracy is once again higher in the DRCNN (91.37%). These results
the models.
show the high precision and great robustness of the models.
Table 5. Multiple-step ahead forecasts in forecast horizon = t + 1 and t + 2.
Table 5. Multiple-step ahead forecasts in forecast horizon = t + 1 and t + 2.
DRCNN DNDT DSVR
Horizon DRCNN DNDT DSVR
Horizon Acc. (%) RMSE MAPE Acc. (%) RMSE MAPE Acc. (%) RMSE MAPE
Acc. (%) RMSE MAPE Acc. (%) RMSE MAPE Acc. (%) RMSE MAPE
t+1 94.19 0.81 0.52 92.35 0.87 0.59 88.34 0.97 0.65
t + 1 t + 2 94.19 91.37 0.81 0.92 0.520.63 92.35
89.41 0.87
1.03 0.59
0.67 88.34
85.76 0.97
1.10 0.78 0.65
t+2 91.37 0.92 0.63 89.41 1.03
Acc: accuracy.
0.67 85.76 1.10 0.78
Acc: accuracy.
Figure
PEER4.
Figure
Mathematics 2020, 8, x FOR Multiple-step
Multiple-step ahead
4.REVIEW ahead forecasts
forecasts in
in forecast
forecast horizon:
horizon: accuracy.
accuracy. 11 of 14
Figure
Figure 5.
5. Multiple-step
Multiple-step ahead
ahead forecasts
forecasts in
in forecast
forecast horizon:
horizon: RMSE.
RMSE.Mathematics 2020, 8, 1245 11 of 13
Figure 5. Multiple-step ahead forecasts in forecast horizon: RMSE.
Figure 6.
Figure 6. Multiple-step
Multiple-step ahead
ahead forecasts in forecast
forecasts in forecast horizon:
horizon: MAPE.
MAPE.
5. Conclusions
This study developed
developed aa comparison
comparisonof ofmethodologies
methodologiestotopredict
predictBitcoin
Bitcoinprice
priceand,
and,therefore,
therefore,a
anew
newmodel
modelwaswascreated
createdtotoforecast
forecastthis
thisprice.
price.The
Theperiod
periodselected
selectedwaswas from
from 2011
2011 to
to 2019. We
We applied
different deep
deep learning
learning methods in the construction of the Bitcoin Bitcoin price prediction model to achieve
a robust model,
model,such
suchasasdeep
deeprecurrent
recurrent convolutional
convolutional neural
neural network,
network, deepdeep neural
neural decision
decision treestrees
and
and deep support vector machines. The DRCNN model obtained the
deep support vector machines. The DRCNN model obtained the highest levels of precision. We highest levels of precision.
We propose
propose to increase
to increase thethe level
level of of performance
performance ofofthe
themodels
modelstotopredict
predictthetheprice
priceofof Bitcoin
Bitcoin compared
to previous
previousliterature.
literature.This
Thisresearch
research hashas
shown significantly
shown higher
significantly precision
higher resultsresults
precision than those
thanshown
those
in previous works, achieving a precision hit range of 92.61–95.27%. Likewise, it was
shown in previous works, achieving a precision hit range of 92.61–95.27%. Likewise, it was possible possible to identify
atonew set ofasignificant
identify new set ofvariables
significant forvariables
the prediction
for theof prediction
the price ofofBitcoin, offering
the price great stability
of Bitcoin, offering in the
great
models developed predicting in the future horizons of one and two years.
stability in the models developed predicting in the future horizons of one and two years.
This research
research allows
allows us to increase the results and conclusions on the price of Bitcoin concerning
previous works, both in mattersmatters of of precision
precision and
and error,
error, but
but also
also onon significant
significant variables.
variables. A set of
significant variables for each methodology applied has been selected analyzing our results, but some
of these variables are recurrent
recurrent in in the three
three methods.
methods. This supposes an important addition to the field
of cryptocurrency pricing. The conclusions are relevant to central bankers, investors, asset managers,
private forecasters, and business professionals for the cryptocurrencies market, who are generally
interested in knowing which indicators provide reliable, accurate, and potential forecasts of price
changes. Our study suggests new and significant explanatory variables to allow these agents to predict
the Bitcoin price phenomenon. These results have provided a new Bitcoin price forecasting model
developed using three methods, with the DCRNN model as the most accurate, thus contributing to
existing knowledge in the field of machine learning, and especially, deep learning. This new model
can be used as a reference for setting asset pricing and improved investment decision-making.
In summary, this study provides a significant opportunity to contribute to the field of finance,
since the results obtained have significant implications for the future decisions of asset managers,
making it possible to avoid big change events of the price and the potential associated costs. It also
helps these agents send warning signals to financial markets and avoid massive losses derived from an
increase of volatility in the price.
Opportunities for further research in this field include developing predictive models considering
volatility correlation of the other new alternative assets and also safe-haven assets such as gold or
stable currencies, that evaluate the different scenarios of portfolio choice and optimization.Mathematics 2020, 8, 1245 12 of 13
Author Contributions: Conceptualization, P.L.-F., D.A., P.L.-L. and M.A.F.-G.; Data curation, D.A. and M.A.F.-G.;
Formal analysis, P.L.-F., D.A. and P.L.-L.; Funding acquisition, P.L.-F., P.L.-L. and M.A.F.-G.; Investigation, D.A.
and M.A.F.-G.; Methodology, D.A.; Project administration, P.L.-F. and M.A.F.-G.; Resources, P.L.-F. and M.A.F.-G.;
Software, D.A.; Supervision, D.A.; Validation, D.A. and P.L.-L.; Visualization, P.L.-F. and D.A.; Writing—original
draft, P.L.-F. and D.A.; Writing—review & editing, P.L.-F., D.A., P.L.-L. and M.A.F.-G. All authors have read and
agreed to the published version of the manuscript.
Funding: This research was funded by Cátedra de Economía y Finanzas Sostenibles, University of Malaga, Spain.
Conflicts of Interest: The authors declare no conflict of interest.
References
1. Kristoufek, L. What Are the Main Drivers of the Bitcoin Price? Evidence from Wavelet Coherence Analysis.
PLoS ONE 2015, 10, e0123923. [CrossRef]
2. Wamba, S.F.; Kamdjoug, J.R.K.; Bawack, R.E.; Keogh, J.G. Bitcoin, Blockchain and Fintech: A systematic
review and case studies in the supply chain. Prod. Plan. Control Manag. Oper. 2019, 31, 115–142. [CrossRef]
3. Chen, W.; Zheng, Z.; Ma, M.; Wu, J.; Zhou, Y.; Yao, J. Dependence structure between bitcoin price and its
influence factors. Int. J. Comput. Sci. Eng. 2020, 21, 334–345. [CrossRef]
4. Balcilar, M.; Bouri, E.; Gupta, R.; Roubaud, D. Can volume predict bitcoin returns and volatility?
A quantiles-based approach. Econ. Model. 2017, 64, 74–81. [CrossRef]
5. Ciaian, P.; Rajcaniova, M.; Artis Kancs, D. The economics of BitCoin price formation. Appl. Econ. 2016,
48, 1799–1815. [CrossRef]
6. Schmidt, R.; Möhring, M.; Glück, D.; Haerting, R.; Keller, B.; Reichstein, C. Benefits from Using Bitcoin:
Empirical Evidence from a European Country. Int. J. Serv. Sci. Manag. Eng. Technol. 2016, 7, 48–62. [CrossRef]
7. Velankar, S.; Valecha, S.; Maji, S. Bitcoin Price Prediction using Machine Learning. In Proceedings of the
20th International Conference on Advanced Communications Technology (ICACT), Chuncheon-si, Korea,
11–14 February 2018.
8. McNally, S.; Roche, J.; Caton, S. Predicting the Price of Bitcoin Using Machine Learning. In Proceedings
of the 26th Euromicro International Conference on Parallel, Distributed, and Network-Based Processing,
Cambridge, UK, 21–23 March 2018.
9. Yogeshwaran, S.; Kaur, M.J.; Maheshwari, P. Project Based Learning: Predicting Bitcoin Prices using Deep
Learning. In Proceedings of the 2019 IEEE Global Engineering Education Conference (EDUCON), Dubai,
UAE, 9–11 April 2019.
10. Demir, A.; Akılotu, B.N.; Kadiroğlu, Z.; Şengür, A. Bitcoin Price Prediction Using Machine Learning Methods.
In Proceedings of the 2019 1st International Informatics and Software Engineering Conference (UBMYK),
Ankara, Turkey, 6–7 November 2019.
11. Rizwan, M.; Narejo, S.; Javed, M. Bitcoin price prediction using Deep Learning Algorithm. In Proceedings
of the 13th International Conference on Mathematics, Actuarial Science, Computer Science and Statistics
(MACS), Karachi, Pakistan, 14–15 December 2019.
12. Linardatos, P.; Kotsiantis, S. Bitcoin Price Prediction Combining Data and Text Mining. In Advances in
Integrations of Intelligent Methods. Smart Innovation, Systems and Technologies; Hatzilygeroudis, I., Perikos, I.,
Grivokostopoulou, F., Eds.; Springer: Singapore, 2020.
13. Felizardo, L.; Oliveira, R.; Del-Moral-Hernández, E.; Cozman, F. Comparative study of Bitcoin price prediction
using WaveNets, Recurrent Neural Networks and other Machine Learning Methods. In Proceedings of the
6th International Conference on Behavioral, Economic and Socio-Cultural Computing (BESC), Beijing, China,
28–30 October 2019.
14. Dutta, A.; Kumar, S.; Basu, M. A Gated Recurrent Unit Approach to Bitcoin Price Prediction. J. Risk
Financ. Manag. 2020, 13, 23. [CrossRef]
15. Ji, S.; Kim, J.; Im, H. A Comparative Study of Bitcoin Price Prediction Using Deep Learning. Mathematics
2019, 7, 898. [CrossRef]
16. Saltelli, A. Making best use of model evaluations to compute sensitivity indices. Comput. Phys. Commun.
2002, 145, 280–297. [CrossRef]
17. Wang, S.; Chen, X.; Tong, C.; Zhao, Z. Matching Synchrosqueezing Wavelet Transform and Application to
Aeroengine Vibration Monitoring. IEEE Trans. Instrum. Meas. 2017, 66, 360–372. [CrossRef]Mathematics 2020, 8, 1245 13 of 13
18. Huang, C.-W.; Narayanan, S.S. Deep convolutional recurrent neural network with attention mechanism for
robust speech emotion recognition. In Proceedings of the 2017 IEEE International Conference on Multimedia
and Expo, Hong Kong, China, 10–14 July 2017; pp. 583–588.
19. Ran, X.; Xue, L.; Zhang, Y.; Liu, Z.; Sang, X.; Xe, J. Rock Classification from Field Image Patches Analyzed
Using a Deep Convolutional Neural Network. Mathematics 2019, 7, 755. [CrossRef]
20. Ma, M.; Mao, Z. Deep Recurrent Convolutional Neural Network for Remaining Useful Life Prediction.
In Proceedings of the 2019 IEEE International Conference on Prognostics and Health Management (ICPHM),
San Francisco, CA, USA, 17–20 June 2019; pp. 1–4.
21. Yang, Y.; Garcia-Morillo, I.; Hospedales, T.M. Deep Neural Decision Trees. In Proceedings of the 2018 ICML
Workshop on Human Interpretability in Machine Learning (WHI 2018), Stockholm, Sweden, 14 July 2018.
22. Norouzi, M.; Collins, M.D.; Johnson, M.; Fleet, D.J.; Kohli, P. Efficient non-greedy optimization of decision
trees. In Proceedings of the 28th International Conference on Neural Information Processing Systems,
Montreal, QC, Canada, 8–13 December 2015; pp. 1729–1737.
23. Dougherty, J.; Kohavi, R.; Sahami, M. Supervised and unsupervised discretization of continuous features.
In Proceedings of the 12th International Conference on Machine Learning (ICML), Tahoe City, CA, USA,
9–12 July 1995.
24. Jang, E.; Gu, S.; Poole, B. Categorical reparameterization with Gumbel-Softmax. arXiv 2017, arXiv:1611.01144.
25. Tang, Y. Categorical reparameterization with Gumbel-Softmax. arXiv 2013, arXiv:1306.0239.
26. Delen, D.; Kuzey, C.; Uyar, A. Measuring firm performance using financial ratios: A decision tree approach.
Expert Syst. Appl. 2013, 40, 3970–3983. [CrossRef]
27. Efimov, D.; Sulieman, H. Sobol Sensitivity: A Strategy for Feature Selection. In Mathematics Across
Contemporary Sciences. AUS-ICMS 2015; Springer Proceedings in Mathematics & Statistics: Cham, Switzerland,
2017; Volume 190.
28. Alaminos, D.; Fernández, S.M.; García, F.; Fernández, M.A. Data Mining for Municipal Financial Distress
Prediction, Advances in Data Mining, Applications and Theoretical Aspects. Lect. Notes Comput. Sci. 2018,
10933, 296–308.
29. Zhang, G.P.; Qi, M. Neural network forecasting for seasonal and trend time series. Eur. J. Oper. Res. 2005,
160, 501–514. [CrossRef]
30. Polasik, M.; Piotrowska, A.I.; Wisniewski, T.P.; Kotkowski, R.; Lightfoot, G. Price fluctuations and the use of
Bitcoin: An empirical inquiry. Int. J. Electron. Commer. 2015, 20, 9–49. [CrossRef]
31. Al-Khazali, O.; Bouri, E.; Roubaud, D. The impact of positive and negative macroeconomic news surprises:
Gold versus Bitcoin. Econ. Bull. 2018, 38, 373–382.
32. Koprinska, I.; Rana, M.; Rahman, A. Dynamic ensemble using previous and predicted future performance for
Multi-step-ahead solar power forecasting. In Proceedings of the ICANN 2019: Artificial Neural Networks
and Machine Learning, Munich, Germany, 17–19 September 2019; pp. 436–449.
33. Makridakis, S.; Spiliotis, E.; Assimakopoulos, V. Statistical and Machine Learning forecasting methods:
Concerns and ways forward. PLoS ONE 2018, 13, e0194889. [CrossRef] [PubMed]
© 2020 by the authors. Licensee MDPI, Basel, Switzerland. This article is an open access
article distributed under the terms and conditions of the Creative Commons Attribution
(CC BY) license (http://creativecommons.org/licenses/by/4.0/).You can also read