In-flight sensing of pollen grains via laser scattering and deep learning - IOPscience
←
→
Page content transcription
If your browser does not render page correctly, please read the page content below
Engineering Research Express

PAPER • OPEN ACCESS

In-flight sensing of pollen grains via laser scattering and deep learning
To cite this article: James A Grant-Jacob et al 2021 Eng. Res. Express 3 025021

View the article online for updates and enhancements.

                              This content was downloaded from IP address 46.4.80.155 on 11/08/2021 at 14:41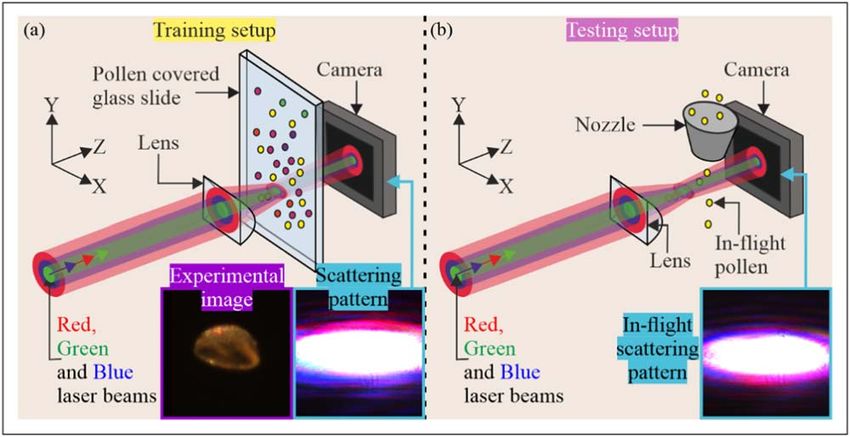
Eng. Res. Express 3 (2021) 025021 https://doi.org/10.1088/2631-8695/abfdf8
PAPER
In-flight sensing of pollen grains via laser scattering and deep
OPEN ACCESS
learning
RECEIVED
22 January 2021
James A Grant-Jacob , Matthew Praeger , Robert W Eason and Ben Mills
REVISED
29 April 2021
Optoelectronics Research Centre, University of Southampton, Southampton, SO17 1BJ, United Kingdom
ACCEPTED FOR PUBLICATION
E-mail: J.A.Grant-Jacob@soton.ac.uk
4 May 2021
Keywords: Deep learning, Imaging, Sensing, Optics, Pollen, Hay fever
PUBLISHED
12 May 2021
Original content from this Abstract
work may be used under The identification and imaging of pollen grains in-flight was performed via illumination of the pollen
the terms of the Creative
Commons Attribution 4.0 grains with three collinear laser beams that had central wavelengths of 450 nm, 520 nm and 635 nm.
licence.
Two neural networks are reported here; the first neural network was able to categorise pollen grain
Any further distribution of
this work must maintain species from their scattering patterns with∼86% accuracy, while the second neural network generated
attribution to the
author(s) and the title of images of the pollen grains from their scattering patterns. This work demonstrates the potential
the work, journal citation
and DOI.
application of laser scattering and deep learning for real-world in-flight pollen identification.
Introduction
In the UK, more than 10 million people suffer from hay fever [1], with the susceptibility of sufferers varying
depending on the types of pollen, such as weed or grass pollen [2, 3]. Hay fever symptoms include sinusitis, nasal
polyposis, conjunctivitis, otitis media with effusion, upper respiratory infections and sleep disorders [4–6]. Since
some people may be more susceptible to specific types of pollen, it is therefore important to determine the type
and number of individual species in a person’s vicinity, as this may provide diagnostic information for their
allergy. In addition, monitoring of pollen grains could provide greater information regarding pollen distribution
for tracking of seasonal levels [7–9], regional and worldwide levels [10–13], and linking these to health effects
[14]. Furthermore, this information could benefit studies on transport of pollen, such as from one country to
another [15], insect migrations [16], as well as forecasting for crop production [17]. Current routine techniques
for determining airborne particulate matter involve large filter gathering systems, such as Burkard traps [18–20],
which can then enable microscopy and chemical identification in a specialised laboratory.
Recently explored methods for faster identification of individual pollen grains include an automated
microscope to identify pollen grains [21] and deep learning methods for the classification of pollen grain species
from their visible light microscope images [22–27]. The need for increased temporal and spatial resolution of
pollen distribution has led to research into real-time monitoring of aerosols, and specifically pollen [28], that
include using robotic systems with [29] and without deep learning for pollen classification [30, 31], as well as
optical particle counters that use the scattering of light to detect pollen [32–34]. Imaging of non-flowing
microplastics and diatoms has been performed using holography with fibre-coupled solid state lasers [35]. Real-
time in-flight monitoring has been demonstrated using extensive and complex laboratory-based optical
apparatus such as fluorescence spectroscopy [36], while in-flight imaging of pollen grains has been carried out
using holography with fluorescence spectroscopy [37], as well as using holography and an unmanned aerial
vehicle (UAV) [38]. The ability to image and identify single pollen grains outdoors and in-flight using a small,
simple device (e.g. Raspberry Pi microcomputer-size [39]) involving as few optics as possible would be
invaluable for use in large-scale air-quality monitoring networks [40].
The spatial intensity distribution of the light scattered from a particulate varies depending on its chemical
composition [41], and encodes information regarding the particulate’s size, shape, structure and refractive index
[42–45]. Identification of pollen grains directly from their scattering patterns has the potential to reduce the
number of optics in a system, as an imaging lens would not be needed. Owing to the complexity of scattering
patterns they typically cannot be categorised analytically, however, deep learning convolutional neural networks
© 2021 The Author(s). Published by IOP Publishing Ltd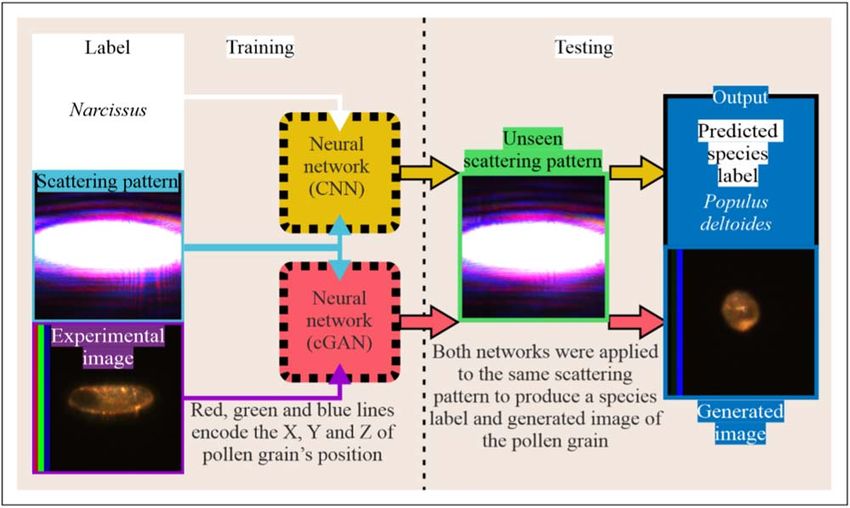
Eng. Res. Express 3 (2021) 025021 James A. Grant-Jacob et al
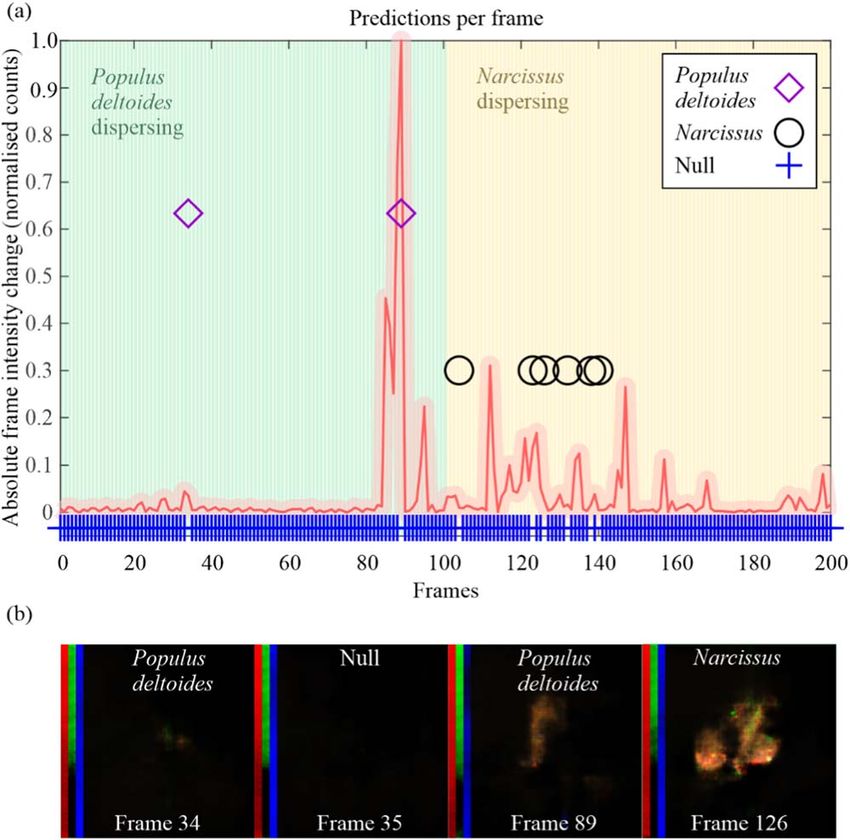
Figure 1. Schematics of the experimental setup used for (a) training and (b) testing the neural networks, showing the illumination of
pollen grains using three different lasers and the subsequent recording of the scattering pattern by a camera. For testing, the glass slide
was removed and pollen grains were dispersed through the beam via the use of a funnel to allow the pollen grains to fall through the
laser beam waist. Left inset: experimentally recorded image and corresponding scattering pattern of Narcissus pollen grain captured in
the experimental setup. Right inset: in-flight scattering pattern during Narcissus pollen grain dispersing.
[46–48] (such as those used to classify objects from images [49–52]) have been successfully employed to classify
particulates such as pollen grains from their scattering patterns [53, 54]. Whilst previous work has also shown
the ability to generate an image from the scattering pattern using deep learning [55], the particulates were
mounted on a glass slide in one position in space, and were therefore stationary and not able to migrate in the
manner typical for airborne pollen grains. Classification of airborne particulates is significantly more
challenging because of the movement of the particulates (which necessitates shorter camera integration times)
and also the fact that each particulate may not flow directly through the focus (and hence the neural network
must have the capability to identify particulates at all positions throughout the focus). In this work, we
simultaneously classify in-flight pollen grains from their scattering patterns, and generate images of those pollen
grains directly from their scattering patterns.
Experimental methods
Sample fabrication
Pollen grains obtained from Sigma Aldrich, and the University of Southampton grounds, included Populous
deltoides and Narcissus. All the pollen grains were deposited onto separate regions of a glass slide (borosilicate,
75 mm×25 mm×1 mm) to aid in the correct labelling and collection of scattering patterns.
Experimental setup
The experimental setup used to obtain scattering patterns for training and then testing the neural networks is
shown in figure 1. Three collinear laser beams at central wavelengths of 450 nm, 520 nm and 635 nm, were
focussed using a cylindrical lens (focal length of 15 cm) onto the surface of a glass slide. The resultant beam had a
size at the focus of∼100 μm×5 mm, with a confocal length of∼10 mm. The pollen-covered glass slides were
mounted on a motorized 3-axis stage (Zaber) that was automated using Python. The coordinate positions of the
pollen grains on the slide were determined by imaging them using a camera (Thorlabs DCC1645C HQ,
1280×1024 pixels and a 50×Olympus objective NA=0.4)). A white light source was employed to aid in the
imaging and correct alignment of pollen grains. Subsequently, the imaging objective and white light source were
removed and the camera sensor was placed 3 mm from the beam waist, along the laser axis, in order to collect
scattering patterns from the pollen grains as they were translated in 3-dimensions (3D) through the beam.
Afterwards, the pollen covered glass slide was removed and a 1 mm diameter nozzle was placed 5 mm above the
beam, so that pollen grains could be dispersed under gravity through the beam and the scattering patterns of in-
flight pollen grains recorded as a video sequence. The same camera settings (5 ms integration time) were used for
recording the still images and the video recording.
2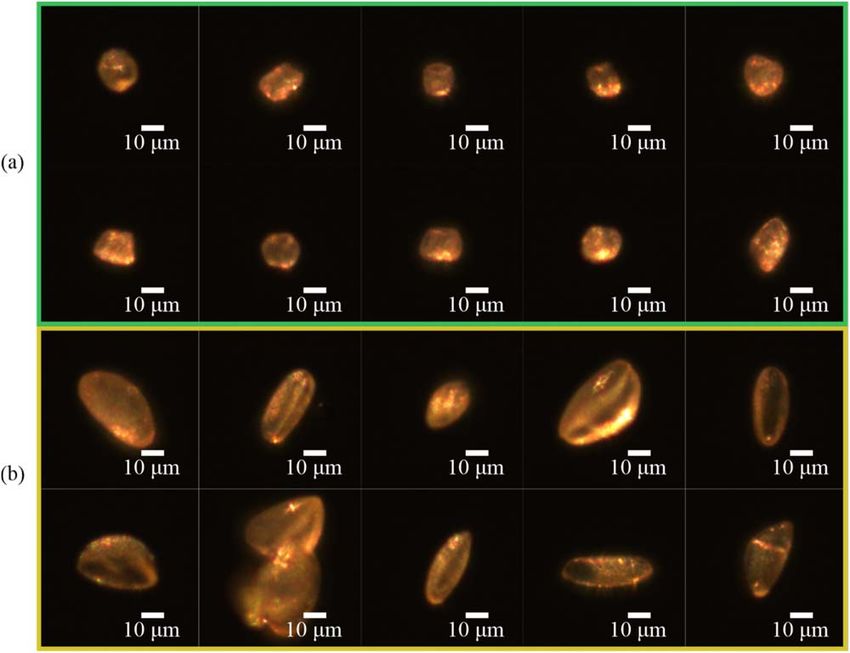
Eng. Res. Express 3 (2021) 025021 James A. Grant-Jacob et al
Data collection
For each pollen grain (10 grains for each species), 1331 scattering pattern images were obtained, giving a total of
39930 scattering patterns for training the neural networks, which included images collected with the glass-slide
removed, hence corresponding to a null category. For testing the neural networks on laser scattering patterns
from in-flight pollen grains, Populus deltoides and then Narcissus pollen grains were dispersed through the nozzle
and a video of the laser scatter was recorded. The scattering patterns and images of the pollen grains were
cropped to 256×256 pixels, before being used as inputs for the neural networks.
Neural networks
Two neural networks were used in this work. Firstly, a convolutional neural network (CNN) based on Inception
v3 [56] was used to categorise two different pollen grain species, as well as a null category, from their scattering
patterns. Secondly, a conditional generative adversarial network (cGAN) [57] based on the network described in
[58], was used to generate images of the pollen grains from their scattering patterns. The scattering pattern from
an object depends on the intensity and phase of the electric field at that position. As the intensity and phase vary
throughout a laser focus, the scattering pattern from an object is therefore dependent on the position of the
object with respect to the laser focus. This poses a challenge when retrieving an image from a scattering pattern,
as a single object may be associated with many scattering patterns. Here, we solve this challenge by training the
neural network with additional positional data, namely the XYZ position of the object. The neural network is
therefore trained to understand that differences in scattering patterns may correspond to the position of the
object in addition to the size, shape and refractive index of the object. For convenience, we include this XYZ
positional information as a red, green and blue (RGB) barcode in the pollen grain images, with different intensity
levels corresponding to different positions in the 3D sensing volume. The generated images also included a
‘barcode’, which corresponded to the X, Y, and Z positions of the pollen grain(s), with respect to the laser focus,
hence extending previous work achieved using pollen at a single position in space. As shown in figure 3, the
barcode consisted of 3 lines of colour (RGB for XYZ in which the position was normalised to the range 0-255)
inserted at the left of the target images for cGAN training, to be used as a 3D-space identifier. The motivation
here was that the experimental scattering patterns would be dependent on the exact position of the pollen grain,
particularly for the position through the focus along the axis of the laser path, and hence providing the pollen
grain position during training would encourage the neural networks to understand the nature of the variation in
scattering patterns. Note that the XYZ barcode was not needed for testing the neural network, and rather the
neural network was trained to actually produce the barcode directly from each scattering pattern, i.e. to identify
the XYZ position of the pollen grain from the scattering pattern. The neural networks were trained and tested on
a computer using an NVIDIA RTX 2080 graphics processing unit (GPU). The time for training the image
generation of the CCN was∼10 min, while the training for the cGAN was∼10 h. The processing time for
generating each test image was∼6 milliseconds for the CNN and 130 milliseconds for the cGAN (including
writing the generated image file to disc). Augmentation was used in the CNN training (random X and Y
translation in the image of −5 and +5 pixels, with data in empty shifted regions set to zero, and using image
scaling of 1 to 1.7×). The data was partitioned for training, validation and testing in the proportions 75:20:5,
respectively. However, in the case of the species categorisation CNN, only 10% of the total data (10% of data
from each grain, including equivalent amount for null category) were used, to reduce training times and allow
faster iteration over the hyper-parameters. For the image reconstruction cGAN, 100% of the static training data
was used, barring the same 201 scattering patterns that were also used for testing the CNN. Subsequently,
100 frames of video for each pollen species were used for testing the neural networks for in-flight predictions.
Results and discussion
The predictions of three different categories at different points within the 3D space of the laser beam waist are
displayed as the confusion matrix shown in figure 3(a). The matrix shows the neural network correctly predicted
99% of the categories. Figures 3(b)–(d) show examples of experimental scattering patterns, experimental
microscopy images, and images generated by the cGAN, for the case of (b) Populus deltoides, (c) Narcissus and (d)
the null category.
To assist in understanding the capability of the CNN, figure 5(a) shows a cropped scattering pattern (for ease
of highlighting regions) from the beam with no pollen present (null category), figure 5(b) displays a cropped
version of the Narcissus scattering pattern from figure 4(c), and figure 5(c) shows the corresponding activation
map (gradient-weighted class activation mapping technique [59]) of (b). The map shows the regions of the
scattering pattern that were activated by the neural network during the classification decision (red strongest, blue
weakest). This result indicates that the CNN was more strongly activated by the region of the beam where the
3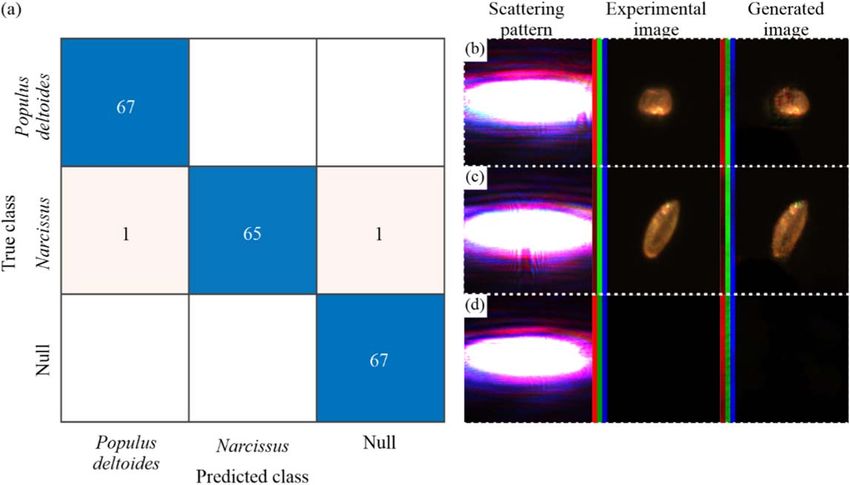
Eng. Res. Express 3 (2021) 025021 James A. Grant-Jacob et al
Figure 2. Images of (a) 10 Populus deltoides and (b) 10 Narcissus pollen grains from which laser light was scattered for training of the
neural networks.
strongest scattering effects from the pollen grain were present. Both the activation and the accuracy of prediction
by CNN gave confidence that the network could be used for sensing pollen grains in-flight.
Figure 6(a) shows classification results for 200 frames of video that were recorded during testing with
airborne particles. Throughout the video, Populus deltoides (frames 1-100) and Narcissus (frames 101–200, via a
funnel, into the laser beam focus) pollen grains, were dispersed through the laser beam. In addition, the frame-
to-frame absolute change in the summed intensity of the image (normalised to 1) is also shown in the graph.
Significant changes in intensity greater than the noise (~ 0.01 counts) are likely to indicate the presence of pollen
and therefore allow us to identify frames where the null category was incorrectly assigned. For 100 frames of
recording for Populus deltoides testing, 2 frames were identified as having pollen scattering patterns, while for
100 frames of recording for Narcissus testing, 6 frames were identified as having pollen grain scattering patterns.
In total, out of the 200 frames, 37 had a significant change in intensity, with 8 of those having been detected by
the neural network, while all the others were categorised as being null, meaning that∼86% of the frame
predictions were correct.
Figure 6(b) shows predictions of the pollen grain appearance that were generated by the cGAN, from
scattering patterns that were correctly classified by the CNN. The appearance of the pollen in the generated
image of frame 126 shows similarity with the pollen grain type, namely Narcissus, albeit an image of a cluster of
3 pollen grains has been generated. An image generated from one of the correctly predicted null scattering
patterns is also shown, as well as two images generated from correctly predicted Populus deltoides scattering
patterns, although the pollen in frame 34 is very faint. The ability to reconstruct an image correctly is based on
the input data used, hence features of the generated images are similar to those used in training. Moreover, errors
in the predictions, both for pollen identification and imaging, could occur due to the possibility that although
the species of pollen dispersed over the beam waist was known, these particulates could contain clusters of pollen
grains in varying amounts. This could lead to incorrect categorisation of the pollen grains, as well as inability to
reconstruct an image of the pollen (including the barcode) properly, since there was only one occurrence of a
pollen grain cluster in the training data (see figure 2(b)).
In addition, the accuracy of prediction for airborne pollen was lower than in the case of the static (glass slide
mounted) pollen, perhaps due to the potential effect of motion blur in the scattering patterns captured. It is
estimated that the pollen could be travelling at 1 mms−1 at the laser focus due to gravity, meaning during an
integration time of 5 ms, the pollen grain could have travelled 5 μm, which is approximately 1/20th of the beam
waist). It may be possible to reduce the probability of incorrect categorisation of scattering patterns via the use of
a more sensitive and faster camera sensor, as well as data augmentation, for example, training using
4Eng. Res. Express 3 (2021) 025021 James A. Grant-Jacob et al
Figure 3. Concept of determining a pollen species and generating images of pollen grains from their scattering pattern using neural
networks. The CNN was trained to transform a scattering pattern into a species label. The cGAN was trained to transform a scattering
pattern into a reconstructed image of the pollen grain, along with identification of its XYZ positions.
Figure 4. (a) Confusion matrix demonstrating the ability of a neural network to predict the pollen species from previously unseen
scattering patterns of Populus deltoides pollen grains, Narcissus pollen grains and the null category. Scattering pattern with the neural
network, experimental microscope image, and image generated by the cGAN for (b) Populus deltoides and (c) Narcissus pollen grains
and (d) the null category. The colour bars and their RGB value at the left of the experimental and generated images relate to the XYZ
position of the pollen grain in 3D space, respectively.
superposition of scattering patterns could help the neural network to identify species from clusters without
significantly increasing training time [60]. Similarly, a larger amount of training data, via inclusion of more
pollen grain clusters, could improve the neural network accuracy and image reconstruction (including the
barcode specifying the pollen’s XYZ position in space). With additional training data, one could identify many
more species of pollen, via neural networks such as Inception v3, which is capable of categorising 1000s of
different types of objects [56].
The mean wind speed in certain regions of the UK can be∼3 ms−1 [61], which is around 3 orders of
magnitude greater than the particulate speeds used in this proof-of-principle demonstration. To adapt this
5Eng. Res. Express 3 (2021) 025021 James A. Grant-Jacob et al
Figure 5. (a) Cropped scattering pattern with no pollen grain present (null category), (b) cropped scattering pattern from a Narcissus
pollen grain and (c) corresponding activation map from the cropped scattering pattern in (b).
Figure 6. Capability of the trained neural network to identify pollen grains in-flight for the Populus deltoides, Narcissus and null pollen
grains, showing the prediction for each of the 200 frames (scattering pattern images) in which Populus deltoides (1–100 frames) and
Narcissus (101–200 frames) pollen grains were dispersed over the laser beam focus. Included is the absolute change in summed frame
intensity (normalised to 1), indicating the likely presence of pollen grain(s) within the beam. (b) Generated images from in-flight
captured scattering patterns, showing Populus deltoides, Narcissus and null pollen.
sensing technique for a typical outdoors environment where particulates may have higher speeds, one could use
a sensor with a higher frame rate and gain, coupled with an increased laser power. In addition, air flow into the
sensing volume near the camera sensor could be regulated using ducting, baffles and small fans as required
[62, 63]. Finally, a 3D imaging setup could be created to allow real-time capture of the airborne particulates,
allowing confirmation of the shape predictions generated by the cGAN, whilst simultaneously offering a rich
source of additional training data.
Conclusion
To conclude, we have demonstrated the identification of pollen grains from their scattering patterns at different
points in static 3D space (99% accuracy) and in-flight (~ 86% accuracy). We have also shown pollen grain image
6Eng. Res. Express 3 (2021) 025021 James A. Grant-Jacob et al
generation in static 3D space and in-flight. Future work should consist of additional real-world measurements
for a larger number of pollen species, which could include a category for unknown, since in the real-world there
will likely be many scattering patterns recorded from untrained pollen grains and airborne particulates.
Acknowledgments
BM was supported by an EPSRC Early Career Fellowship (EP/N03368X/1) and EPSRC grant (EP/T026197/1).
Data availability statement
The data that support the findings of this study are openly available at the following URL/DOI:https://doi.org/
10.5258/SOTON/D1667.
Conflicts of interest
The authors declare no conflict of interest.
ORCID iDs
James A Grant-Jacob https://orcid.org/0000-0002-4270-4247
Matthew Praeger https://orcid.org/0000-0002-5814-6155
Robert W Eason https://orcid.org/0000-0001-9704-2204
Ben Mills https://orcid.org/0000-0002-1784-1012
References
[1] McInnes R N, Hemming D, Burgess P, Lyndsay D, Osborne N J, Skjøth C A, Thomas S and Vardoulakis S 2017 Mapping allergenic
pollen vegetation in UK to study environmental exposure and human health Sci. Total Environ. 599–600 483–99
[2] Rodinkova V V 2015 Airborne pollen spectrum and hay fever type prevalence in Vinnitsa, central Ukraine Acta Agrobot. 68 383–9
[3] Gruzieva O, Pershagen G, Wickman M, Melén E, Hallberg J, Bellander T and Lõhmus M 2015 Exposure to grass pollen—but not birch
pollen—affects lung function in Swedish children Allergy 70 1181–3
[4] Pawankar R, Canonica G W, Holgate S T, Lockey R F and Blaiss M S 2013 WAO white book on allergy: update 2013 World Allergy
Organ. 11–9
[5] Karatzas K, Katsifarakis N, Riga M, Werchan B, Werchan M, Berger U, Pfaar O and Bergmann K-C 2018 New European Academy of
Allergy and Clinical Immunology definition on pollen season mirrors symptom load for grass and birch pollen-induced allergic rhinitis
Allergy 73 1851–9
[6] Taketomi E A, Sopelete M C, de Sousa Moreira P F and de Assis Machado Vieira F 2006 Pollen allergic disease: pollens and its major
allergens Braz. J. Otorhinolaryngol. 72 562–7
[7] Simoleit A, Wachter R, Gauger U, Werchan M, Werchan B, Zuberbier T and Bergmann K-C 2016 Pollen season of European beech
(Fagus sylvatica L.) and temperature trends at two German monitoring sites over a more than 30-year period Aerobiologia (Bologna). 32
489–97
[8] Caillaud D, Martin S, Segala C, Besancenot J-P, Clot B and Thibaudon M 2014 Effects of airborne birch pollen levels on clinical
symptoms of seasonal allergic rhinoconjunctivitis Int. Arch. Allergy Immunol. 163 43–50
[9] Newnham R M, Sparks T H, Skjøth C A, Head K, Adams-Groom B and Smith M 2013 Pollen season and climate: Is the timing of birch
pollen release in the UK approaching its limit? Int. J. Biometeorol. 57 391–400
[10] Buters J T M, Antunes C, Galveias A, Bergmann K C, Thibaudon M, Galán C, Schmidt-Weber C and Oteros J 2018 Pollen and spore
monitoring in the world Clin. Transl. Allergy 8 1–5
[11] Corden J, Millington W, Bailey J, Brookes M, Caulton E, Emberlin J, Mullins J, Simpson C and Wood A 2000 UK Regional Variations in
Betula Pollen (1993-1997) Aerobiologia (Bologna). 16 227–32
[12] Galán C, Emberlin J, Domínguez E, Bryant R H and Villamandos F 1995 A Comparative analysis of daily variations in the gramineae
pollen counts at Córdoba, Spain and London, UK Grana 34 189–98
[13] Emberlin J, Smith M, Rebecca C, Adams-Groom B and Beverly A G 2007 Changes in the pollen seasons of the early flowering trees
Alnus spp. and Corylus spp. International Journal of Biometerology 51 181
[14] Skypala I J, Calderon M A, Leeds A R, Emery P, Till S J and Durham S R 2011 Development and validation of a structured questionnaire
for the diagnosis of oral allergy syndrome in subjects with seasonal allergic rhinitis during the UK birch pollen season Clin. Exp. Allergy
41 1001–11
[15] de Weger L A, Pashley C H, Šikoparija B, Skjøth C A, Kasprzyk I, Grewling Ł, Thibaudon M, Magyar D and Smith M 2016 The long
distance transport of airborne Ambrosia pollen to the UK and the Netherlands from Central and south Europe Int. J. Biometeorol. 60
1829–39
[16] Suchan T, Talavera G, Sáez L, Ronikier M and Vila R 2019 Pollen metabarcoding as a tool for tracking long-distance insect migrations
Mol. Ecol. Resour. 19 149–62
[17] Fernandez-Mensaque P C, Minero F J G, Morales J and Tomas C 1998 Forecasting olive (Olea europaea) crop production by
monitoring airborne pollen Aerobiologia (Bologna). 14 185–90
[18] Levetin E, Rogers C A and Hall S A 2000 Comparison of pollen sampling with a Burkard Spore Trap and a Tauber Trap in a warm
temperate climate Grana 39 294–302
7Eng. Res. Express 3 (2021) 025021 James A. Grant-Jacob et al
[19] Mari Bhat M and Rajasab A H 1989 Efficiency of vertical cylinder spore trap and seven day volumetric burkard spore trap in monitoring
airbone pollen and fungal spores Grana 28 147–153
[20] Giesecke T, Fontana S L, Knaap W O, van der, Pardoe H S and Pidek I A 2010 From early pollen trapping experiments to the Pollen
Monitoring Programme Veg. Hist. Archaeobot. 19 247–58
[21] Lagerstrom R, Holt K, Arzhaeva Y, Bischof L, Haberle S, Hopf F and Lovell D 2015 Pollen image classification using the Classifynder
system: algorithm comparison and a case study on New Zealand honey Adv. Exp. Med. Biol. 823 207–26
[22] de Geus A R, Celia A Z B, Batista M A and da Silva S F 2019 Large-scale Pollen Recognition with Deep Learning 2019 27th European Signal
Processing Conference (EUSIPCO) 1–5
[23] Gallardo-Caballero R, García-Orellana C J, García-Manso A, González-Velasco H M, Tormo-Molina R and Macías-Macías M 2019
Precise pollen grain detection in bright field microscopy using deep learning techniques Sensors 19 3583
[24] Sevillano V and Aznarte J 2018 Improving classification of pollen grain images of the POLEN23E dataset through three different
applications of deep learning convolutional neural networks PLoS ONE 13 e0201807
[25] Sevillano V, Holt K and Aznarte J L 2020 Precise automatic classification of 46 different pollen types with convolutional neural
networks PLoS One 15 e0229751
[26] Gonçalves A B et al 2016 Feature Extraction and Machine Learning for the Classification of Brazilian Savannah Pollen Grains PLoS
ONE 11 1–20
[27] Battiato S, Ortis A, Trenta F, Ascari L, Politi M and Siniscalco C 2020 POLLEN13K: A Large Scale Microscope Pollen Grain Image Dataset
2020 IEEE International Conference on Image Processing (ICIP) 2456–60
[28] Huffman J A et al 2020 Real-time sensing of bioaerosols: Review and current perspectives Aerosol Sci. Technol. 54 465–95
[29] Schiele J, Rabe F, Schmitt M, Glaser M, Haring F, Brunner J O, Bauer B, Schuller B, Traidl-Hoffmann C and Damialis A 2019
Automated classification of airborne pollen using neural networks 2019 41st Annual Int. Conf. of the IEEE Engineering in Medicine and
Biology Society (EMBC) 2019 4474–8
[30] Oteros J, Pusch G, Weichenmeier I, Heimann U, Möller R, Röseler S, Traidl-Hoffmann C, Schmidt-Weber C and Buters J T M 2015
Automatic and online pollen monitoring Int. Arch. Allergy Immunol. 167 158–66
[31] Oteros J, Weber A, Kutzora S, Rojo J, Heinze S, Herr C, Gebauer R, Schmidt-Weber C B and Buters J T M 2020 An operational robotic
pollen monitoring network based on automatic image recognition Environ. Res. 191 110031
[32] Kawashima S, Thibaudon M, Matsuda S, Fujita T, Lemonis N, Clot B and Oliver G 2017 Automated pollen monitoring system using
laser optics for observing seasonal changes in the concentration of total airborne pollen Aerobiologia (Bologna). 33 351–62
[33] Matsuda S and Kawashima S 2018 Relationship between laser light scattering and physical properties of airborne pollen J. Aerosol Sci.
124 122–32
[34] Mitsumoto K, Yabusaki K, Kobayashi K and Aoyagi H 2010 Development of a novel real-time pollen-sorting counter using species-
specific pollen autofluorescence Aerobiologia (Bologna). 26 99–111
[35] Bianco V, Memmolo P, Carcagnì P, Merola F, Paturzo M, Distante C and Ferraro P 2020 Microplastic identification via holographic
imaging and machine learning Adv. Intell. Syst. 2 1900153
[36] Šaulienė I et al 2019 Automatic pollen recognition with the Rapid-E particle counter: the first-level procedure, experience and next
steps Atmos. Meas. Tech. 12 3435–52
[37] Sauvageat E, Zeder Y, Auderset K, Calpini B, Clot B, Crouzy B, Konzelmann T, Lieberherr G, Tummon F and Vasilatou K 2020 Real-
time pollen monitoring using digital holography Atmos. Meas. Tech. 13 1539–50
[38] Kemppinen O, Laning J C, Mersmann R D, Videen G and Berg M J 2020 Imaging atmospheric aerosol particles from a UAV with digital
holography Sci. Rep. 10 16085
[39] Grant-Jacob J A, Xie Y, Mackay B S, Praeger M, McDonnell M D T, Heath D J, Loxham M, Eason R W and Mills B 2019 Particle and
salinity sensing for the marine environment via deep learning using a Raspberry Pi Environ. Res. Commun. 1 035001
[40] Oteros J et al 2019 Building an automatic pollen monitoring network (ePIN): Selection of optimal sites by clustering pollen stations Sci.
Total Environ. 688 1263–74
[41] Horvath H 1993 Atmospheric light absorption—A review Atmos. Environ. Part A. Gen. Top. 27 293–317
[42] Agrawal Y C, Whitmire A, Mikkelsen O A and Pottsmith H C 2008 Light scattering by random shaped particles and consequences on
measuring suspended sediments by laser diffraction J. Geophys. Res. Ocean. 113
[43] Gibbs R J 1978 Light scattering from particles of different shapes J. Geophys. Res. Ocean. 83 501–2
[44] Bohren C F and Huffman D R 2008 Absorption and Scattering of Light by Small Particles (New York: Wiley)
[45] Mills B et al 2008 Direct measurement of the complex refractive index in the extreme ultraviolet spectral region using diffraction from a
nanosphere array Appl. Phys. Lett. 93 231103
[46] Szegedy C, Liu W, Jia Y, Sermanet P, Reed S, Anguelov D, Erhan D, Vanhoucke V and Rabinovich A 2015 Going deeper with
convolutions Proceedings of the IEEE conference on computer vision and pattern recognition 1–9
[47] LeCun Y, Bengio Y and Hinton G 2015 Deep learning Nature 521 436
[48] Serre T, Wolf L, Bileschi S, Riesenhuber M and Poggio T 2007 Robust object recognition with cortex-like mechanisms IEEE Trans.
Pattern Anal. Mach. Intell. 411–26
[49] Krizhevsky A, Sutskever I and Hinton G E 2012 Imagenet classification with deep convolutional neural networks Advances in Neural
Information Processing Systems 60 1097–105
[50] Simonyan K and Zisserman A 2014 Very deep convolutional networks for large-scale image recognition arXiv Prepr. arXiv1 409 1556
[51] Mollahosseini A, Chan D and Mahoor M H 2016 Going deeper in facial expression recognition using deep neural networks 2016 IEEE
winter conference on applications of computer vision (WACV) 1–10
[52] Ranjan R, Sankaranarayanan S, Bansal A, Bodla N, Chen J-C, Patel V M, Castillo C D and Chellappa R 2018 Deep learning for
understanding faces: Machines may be just as good, or better, than humans IEEE Signal Process Mag. 35 66–83
[53] Grant-Jacob J A, Mackay B S, Baker J A G, Heath D J, Xie Y, Loxham M, Eason R W and Mills B 2018 Real-time particle pollution
sensing using machine learning Opt. Express 26 27237–46
[54] Wu Y, Calis A, Luo Y, Chen C, Lutton M, Rivenson Y, Lin X, Koydemir H C, Zhang Y, Wang H et al 2019 Label-free Bio-aerosol Sensing
Using On-Chip Holographic Microscopy and Deep Learning CLEO Applications and Technology AM2K–AM23
[55] Grant-Jacob J A, Praeger M, Loxham M, Eason R and Mills B 2020 Lensless imaging of pollen grains at three-wavelengths using deep
learning Environ. Res. Commun. (https://doi.org/10.1088/2515-7620/aba6d1)
[56] Szegedy C, Vanhoucke V, Ioffe S, Shlens J and Wojna Z 2016 Rethinking the inception architecture for computer vision Proceedings of
the IEEE Conference on Computer Vision and Pattern Recognition 2818–26
[57] Isola P, Zhu J-Y, Zhou T and Efros A A 2017 Image-to-image translation with conditional adversarial networks arXiv Prepr. 5967–76
8Eng. Res. Express 3 (2021) 025021 James A. Grant-Jacob et al
[58] Grant-Jacob J A, Mackay B S, Baker J A G, Xie Y, Heath D J, Loxham M, Eason R W and Mills B 2019 A neural lens for super-resolution
biological imaging J. Phys. Commun. (https://doi.org/10.1088/2399-6528/ab267d)
[59] Selvaraju R R, Cogswell M, Das A, Vedantam R, Parikh D and Batra D 2020 Grad-CAM: visual explanations from deep networks via
gradient-based localization Int. J. Comput. Vis. 128 336–59
[60] Perez L and Wang J 2017 The effectiveness of data augmentation in image classification using deep learning arXiv Prepr. arXiv1712.
04621
[61] Acosta J L and Djokić S Ž 2010 Assessment of renewable wind resources in UK urban areas MELECON 2010-2010 15th IEEE
Mediterranean Electrotechnical Conference 1439–44
[62] Wang Y, Li J, Jing H, Zhang Q, Jiang J and Biswas P 2015 Laboratory evaluation and calibration of three low-cost particle sensors for
particulate matter measurement Aerosol Sci. Technol. 49 1063–77
[63] Alfano B, Barretta L, Del Giudice A, De Vito S, Di Francia G, Esposito E, Formisano F, Massera E, Miglietta M L and Polichetti T 2020 A
review of low-cost particulate matter sensors from the developers’ perspectives Sensors 20 6819
9You can also read