Countrywide Origin-Destination Matrix Prediction and Its Application for COVID-19
←
→
Page content transcription
If your browser does not render page correctly, please read the page content below
Countrywide Origin-Destination Matrix
    Prediction and Its Application for COVID-19

 Renhe Jiang†1,4 , Zhaonan Wang†1 , Zekun Cai1 , Chuang Yang1 , Zipei Fan1,4 ,
Tianqi Xia2 , Go Matsubara2 , Hiroto Mizuseki3 , Xuan Song?4,1 , and Ryosuke
                                  Shibasaki1
                        1
                         The University of Tokyo, Tokyo, Japan
                          2
                             LocationMind Inc., Tokyo, Japan
                           3
                             BlogWatcher Inc., Tokyo, Japan
          4
              Southern University of Science and Technology, Shenzhen, China
                   {jiangrh,znwang,songxuan}@csis.u-tokyo.ac.jp

        Abstract. Modeling and predicting human mobility are of great signifi-
        cance to various application scenarios such as intelligent transportation
        system, crowd management, and disaster response. In particular, in a
        severe pandemic situation like COVID-19, human movements among
        different regions are taken as the most important point for understanding
        and forecasting the epidemic spread in a country. Thus, in this study, we
        collect big human GPS trajectory data covering the total 47 prefectures
        of Japan and model the daily human movements between each pair of
        prefectures with time-series Origin-Destination (OD) matrix. Then, given
        the historical observations from past days, we predict the countrywide
        OD matrices for the future one or more weeks by proposing a novel
        deep learning model called Origin-Destination Convolutional Recurrent
        Network (ODCRN). It integrates the recurrent and 2-dimensional graph
        convolutional components to deal with the highly complex spatiotem-
        poral dependencies in sequential OD matrices. Experiment results over
        the entire COVID-19 period demonstrate the superiority of our pro-
        posed methodology over existing OD prediction models. Last, we apply
        the predicted countrywide OD matrices to the SEIR model, one of the
        most classic and widely used epidemic simulation model, to forecast the
        COVID-19 infection numbers for the entire Japan. The simulation results
        also demonstrate the high reliability and applicability of our countrywide
        OD prediction model for a pandemic scenario like COVID-19.

        Keywords: Human mobility · Origin-destination · OD matrix · Graph
        convolutional network · Deep learning · COVID-19

1     Introduction
Nowadays big human mobility data are being collected from various sources
such as smart phone apps, car navigation systems, WiFi access points, and
†
    Equal contribution.
?
    Corresponding author.
2       R. Jiang and Z. Wang et al.

Fig. 1: Illustration of the total 47 prefectures of Japan (left) and the OD matrix among
                         the 47 prefectures on 2020/01/01 (right).

laser sensors, with which modeling and predicting crowd flow[16, 39, 20, 40] and
taxi/bike demand[31, 35, 13, 25] become possible and essential for smart-city
application scenarios. On the other hand, the coronavirus disease 2019 (COVID-
19) outbreak has swept more than 180 countries and territories since late January
2020, which has caused significant losses to public health as well as the economy
at a worldwide scale. Against this background, human mobility data are also
utilized to understand and forecast the epidemic spread situation in city, country,
or all over the world, as human movements are taken as the most important
factor for highly contagious diseases with human-to-human transmission. In this
study, to model and predict the COVID-19 spread over the entire Japan, we
collect big human GPS trajectory data covering the total 47 prefectures of Japan
and model the daily human movements between each pair of prefectures with
time-series Origin-Destination (OD) matrix. With the daily OD matrix, we can
easily know how many people move from one prefecture to another, and further
apply the SEIR model, one of the most fundamental compartmental models in
epidemiology, to simulate the COVID-19 infection number for each prefecture of
Japan by taking the effects of human movements among prefectures into account.
    To this end, we aim to predict the countrywide OD matrices of Japan as
illustrated in Fig.1. However, it is a non-trivial and quite unique task in the
following aspects. (1) Each prefecture is in an irregular polygon shape, which
forms together as a non-euclidean space. Normal convolution neural network
(CNN)[22] is difficult to be directly applied to capture the spatial dependencies
among the prefectures. Therefore, some grid-based state-of-the-arts for OD
matrix prediction including GEML[32] and CSTN[26] can’t perform well on
our prefecture-level OD matrix prediction task, neither for some CNN-based
deep models for crowd flow prediction tasks [39, 35, 42, 25, 40, 20]. (2) The spatial
dependencies simultaneously exist along both Origin axis and Destination axis
in OD matrix. Taking the capital city Tokyo as an example, people from other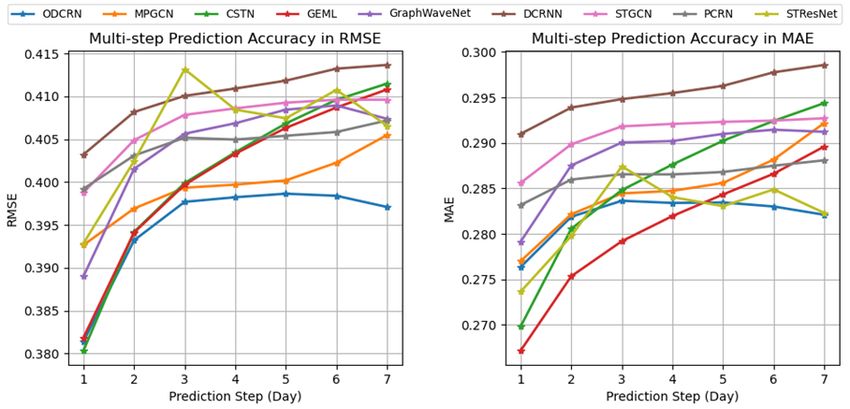
Countrywide OD Matrix Prediction for COVID-19           3

prefectures transit to Tokyo, meanwhile Tokyo people leave Tokyo for other
prefectures. (3) It is necessary to predict multiple days of OD matrix like one
week or more for COVID-19 application scenario, so that experts and officials
can correspondingly make and publish the intervention policies for the following
period of time. However, previous OD matrix models (i.e., GEML[32], CSTN[26],
and MPGCN[29]) are only able to do next-one-step forecast, where each step is
merely half an hour or one hour.
    To tackle these challenges, we present Origin-Destination Convolutional Re-
current Network (ODCRN) for multi-step Origin-Destination matrix prediction.
Specifically, ODCRN consists of two types of graph convolution units: one takes
in a pre-defined static graph (e.g. adjacency matrix) as auxiliary input, while
the other utilizes Dynamic Graph Constructor (DGC) to dynamically gener-
ate an OD graph pair based on the current observation. Each unit recurrently
performs OD convolution (OD-Conv) to simultaneously capture the two-sided
spatial dependency in Origin-Destination matrix and the temporal dependency
in observational sequence. In addition, ODCRN has an encoder-decoder structure
to firstly encode a sequence of OD matrices into hidden tensors, then stepwise
decode them to make a sequence of predictions. In summary, our work has the
following contributions:
 – We collect big human GPS trajectory data for the total 47 prefectures of
   Japan that cover the entire COVID-19 period from 2020/01/01 to 2021/02/28.
 – We propose a novel deep model for countrywide OD matrix prediction that
   utilizes the graph convolution network and the recurrent neural network to
   capture the complex spatial and temporal dependencies in the countrywide
   OD matrix sequence.
 – We implement a classic epidemic simulation model (SEIR model) to forecast
   the COVID-19 infection number for the entire Japan by taking the human
   movements among prefectures into account.
 – We further collect the reported COVID-19 infection number of each prefecture
   in Japan. With the ground-truth infection data and the epidemic simulation
   model, we validate the applicability of our predicted OD matrices for long-
   term countrywide COVID-19 infection forecast.
    The remainder of this paper is organized as follows. In Section 2, we introduce
the related works about the crowd/traffic flow prediction and mobility-based
COVID-19 prediction. In Section 3, we describe our problem definition. In Section
4, we propose a deep learning model for countrywide OD matrix prediction. In
Section 5, we implement an OD matrix-based epidemic simulation model. In
Section 6, we present the evaluation results about OD matrix prediction and
COVID-19 prediction. In Section 7, we give our conclusion.

2     Related Work
2.1   Crowd and Traffic Flow Prediction
Trajectory-based deep learning models [27, 10, 19, 18, 11] have been proposed to
predict each individual’s movement by utilizing the recurrent neural networks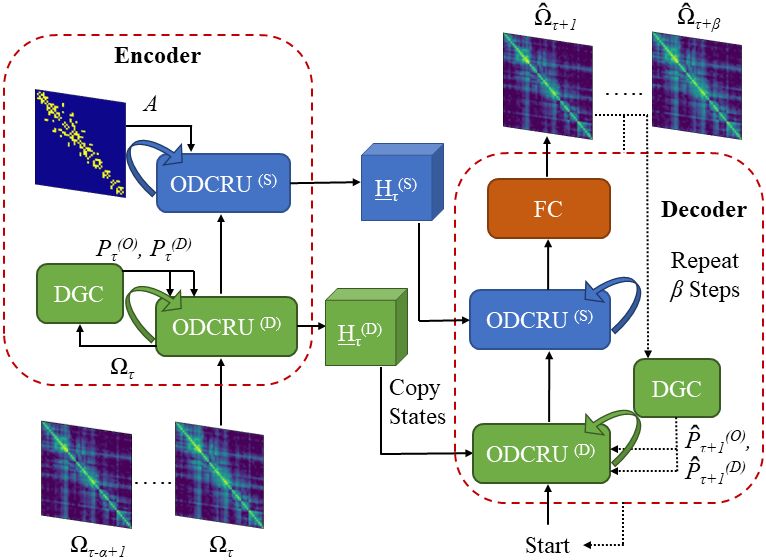
4       R. Jiang and Z. Wang et al.

(RNNs). However, due to the limitation of scalability, it is difficult to apply
the trajectory-based models to a country-level prediction task as there are just
too many trajectories to learn. On the other hand, by meshing a city map into
several grid-regions and aggregating the trajectories for each grid-region, crowd
and traffic flow information can be obtained [16]. Following this strategy, a
series of spatiotemporal models [39, 31, 35, 42, 25, 36] were proposed to predict
the demand, inflow and outflow of taxi/bike/crowd for each grid-region. Thanks
to the euclidean property of the grid space, these approaches can employ normal
convolution neural networks (CNNs) to capture the spatial dependency in an
analogous way with the image/video prediction task. In parallel with the grid-
based modeling strategy, graph is used as a more general solution for modeling
the crowd/traffic demand or flow among irregular regions with arbitrary polygon
shapes [13, 3, 30]. Also, some graph-based models like STGCN[37], ASTGCN[14],
DCRNN[24], and GraphWaveNet[33] are proposed to predict the traffic volume
recorded by the roadway sensors. To learn the spatial correlations among nodes,
all of these models employ graph convolution network (GCN) that can work in a
non-euclidean space.
    However, no matter based on grid or graph, the inflow and outflow models
can only indicate how many people will flow into or out from a region over a
period of time. They can’t answer how many of these people or cars come from
or transit to which regions. To address this, [40, 20] are proposed to model the
grid-based crowd transition which depicts how a crowd of people transit among
the entire mesh-grids. In particular, GEML[32], CSTN[26], and MPGCN[29] are
specially designed for OD matrix prediction task. But still they are not ideal
or well-validated solutions for our COVID-19 application scenario due to the
following reasons. (1) [32, 26, 29] are tailored for single-step OD prediction, while
our task requires a multi-step prediction. Because forecasting the COVID-19
infection numbers for the next one or more weeks rather than only one day is
more meaningful and useful for experts and policy makers. Correspondingly,
the OD matrices must be predicted for multiple days. (2) [32, 26] are based on
mesh-grids, while our OD matrix is based on prefectures that have irregular
shapes. (3) The OD prediction of [32, 26, 29] is conducted at a citywide and
level in short term (1 hour), while our task needs to do the OD prediction at a
countrywide level with relatively longer term (one or more weeks).

2.2   Mobility-Based COVID-19 Simulation
Since the outbreak of COVID-19, mobility data has been widely used to model the
disease’s spatial propagation and shown great potential [1, 4, 6–8, 12, 21, 23]. For
example, [7] utilizes the Baidu Migration Data [1] and the airline transportation
data to simulate the spread of COVID-19 on both national and international
levels, [23] infers the undocumented infection rate of COVID-19 and its substantial
impact in conjunction with mobility data.
    Accurately capture the inter-regional mobility patterns is essential for model-
ing and predicting disease spread. The mobility patterns used in current studies
mainly derived from three aspects: (a) Official Trip Census Data [4, 8, 12]. (b)
Countrywide OD Matrix Prediction for COVID-19 5
Mobilephone Location Data [6, 7, 23]. (c) Transportation Flux Data (e.g., Airline,
Railway) [7, 8]. Based on data sources’ spatial scale, propagation simulations
with different spatial resolutions have been proposed, e.g., [4] models the spread
of COVID-19 in Italy at the province level with the offical published commuter
data among cities. Besides, some works predicted the future propagations to
validate the model’s efficiency [6, 21], e.g., [6] did out-of-sample prediction of
daily confirmed cases for the Chicago metro area. However, none of these works
consider possible mobility changes in the future. Instead, they used historical
mobility directly when predicting, which is our work trying to address.
3 Problem Definition
Given big human GPS trajectory data, Origin-Destination (OD) matrix prediction
can be performed through the following definitions.
Definition 1 (Trajectory and Trip Segmentation): Typically, a user’s trajectory
is a sequence of timestamp-location pairs denoted as [(t1 , l1 ), (t2 , l2 ), ..., (tn , ln )],
where each location l is represented by a longitude-latitude coordinate. Then
we do trip segmentation for each user’s trajectory and obtain the origin and
destination of each trip as follows:
segmentation
[(t1 , l1 ), (t2 , l2 ), ..., (tn , ln )] −−−−−−−−−→ [(o1 , d1 ), (o2 , d2 ), ..., (om , dm )], (1)
where the original trajectory is segmented into m trips, i.e. m OD pairs, o.l and
d.l are the origin and destination location, o.t is the departure time leaving from
origin o, and d.t is the arrival time for destination. The origin and destination
locations are essentially a series of stay points among any consecutive two of which
people move from one to another by different means of transportation such as
TRAIN, BUS, WALK, BIKE, and etc. We let T denote all of the trip-segmented
trajectories.
Definition 2 (Origin-Destination Matrix): Given a spatial area divided into N
non-overlapping regions {r1 ,r2 ,...,rN } and a temporal range equally divided into
T consecutive and non-overlapping timeslots {τ1 ,τ2 ,...,τT }, Origin-Destination
(OD) matrix Ω ∈ RN ×N can be aggregated from the trip-segmented trajectories
T . OD transition number Ωτij between each two regions ri ,rj with respect to
timeslot τ is defined as follows:
Ωτij = |{(o, d) ∈ T | o.l ∈ ri ∧ d.l ∈ rj ∧ o.t ∈ τ ∧ d.t ∈ τ }|, (2)
where | · | denotes the cardinality of a set. In our study, we take the entire Japan
as the spatial area, total 47 prefectures as the non-overlapping 47 regions, and
set each timeslot τ as one day. Since the main application scenario of our study is
COVID-19, we collect the GPS trajectory data from the beginning of COVID-19
pandemic to the very latest, i.e., 2020/01/01∼2021/02/28, 425 days in total.
Definition 3 (Origin-Destination Matrix Prediction): Given historical a steps
of OD matrices Xτ ∈ Rα×N ×N = [Ωτ −α+1 , ..., Ωτ −1 , Ωτ ] from timeslot τ -(α-1)6 R. Jiang and Z. Wang et al.
to to τ , predicting the next β steps of OD matrices Yτ ∈ Rβ×N ×N = [Ωτ +1 ,
Ωτ +2 , ..., Ωτ +β ] from timeslot τ to τ +β is to build a model f as follows:
f (·)
Xτ = [Ωτ −α+1 , ..., Ωτ −1 , Ωτ ] −−−−−−→ Yτ = [Ωτ +1 , Ωτ +2 , ..., Ωτ +β ] (3)
θ
4 OD Matrix Prediction Model
4.1 Overview
We present Origin-Destination Convolutional Recurrent Network (ODCRN),
demonstrated in Figure 2, for multi-step Origin-Destination matrix prediction.
To be specific, ODCRN consists of two types of computational units: one type
of Origin-Destination Convolutional Recurrent Unit (ODCRU) takes in a pre-
defined static graph (e.g. adjacency matrix) as auxiliary input, while the other
ODCRU utilizes Dynamic Graph Constructor (DGC) to dynamically generate an
OD graph pair based on the current observation. Each ODCRU cell recurrently
performs OD convolution (OD-Conv) to simultaneously capture the two-sided
spatial dependency (i.e., along Origin axis and Destination axis) in OD matrix
and the temporal dependency in observational sequence. In addition, ODCRN
has an encoder-decoder structure to firstly encode a sequence of OD matrices
into hidden tensors, then stepwise decode them to make a sequence of predictions.
4.2 Origin-Destination Convolution (OD-Conv)
In Origin-Destination matrix, one can observe both local and global spatial
correlations which entangle and exist on both sides of the origin and destination.
In reality, this two-sided dependency does not necessarily hold equivalent on the
origin side and destination side. It is quite straightforward that the correlation
between prefectures being origins depends on the similarity of their residential
functionality, while the correlation between prefectures being destinations is
mostly decided by the similarity of their commercial or entertaining functionality.
To capture this special two-sided dependency, one intuitive solution is to treat an
OD matrix as an image (of one channel) and filter it with regular convolutional
kernel. However, this approach is in fact inappropriate as it not only loses the
global view but regards submatrices in an OD matrix as equivalent, in which
most OD transitions actually happen close to the diagonal. Keeping the big
picture in mind, we adopt MGCNN [28], which is an extended bidimensional
form of GCN based on the two-dimensional discrete Fourier transform (2D-DFT),
and propose an Origin-Destination Convolution (OD-Conv) to solve the problem,
which is formulated as:
K
X
ko kd
H = σ(Θ ?(P(O) ,P(D) ) Ω) = σ( Ω ×1 P̃(O) ×2 P̃(D) ×3 Wko ,kd ) (4)
ko ,kd =0Countrywide OD Matrix Prediction for COVID-19 7
Fig. 2: Proposed Origin-Destination Convolutional Recurrent Network (ODCRN) for
Multi-step OD Matrix Prediction. ODCRN Consists of Two Types of Computational
Units (ODCRU): One Takes in Pre-defined Static Graph as Auxiliary Input, the Other
Dynamically Generates OD Graph Pair Based on the Current Observation.
In the equation, Ω ∈ RN ×N ×ν and H ∈ RN ×N ×µ are the input and hidden
state of an OD-Conv operation, which is denoted by Θ?(P(O) ,P(D) ) , where Θ or W
stands for learnable parameters given an OD graph pair (P(O) , P(D) ) representing
the correlations of prefectures being origins and being destinations, respectively.
It is noteworthy that MPGCN [29] also employs Equation 4 to handle the two-
sided dependency in OD matrices and further utilizes LSTM and pre-defines a
rule for deriving momentary correlation graphs to model temporal dynamics in
OD matrices. However, we find these two additions are in fact suboptimal and
propose ODCRU with DGC for finer temporal dynamic modelling.
4.3 Origin-Destination Convolutional Recurrent Unit (ODCRU)
Convolutional Recurrent Unit (CRU) is a class of computational methods that
utilizes convolution to replace matrix multiplication as the basic operation in
a recurrent cell (e.g. GRU to ConvGRU). Such substitution equips the unit
with extra capability to capture localized spatial dependency, with the natural
advantage of handling sequential dependency by the recurrent structure. As
a result, CRU has been widely adopted in not only video tasks [34], but also
general spatio-temporal prediction problems [20, 26, 38, 42]. Moreover, the recent8 R. Jiang and Z. Wang et al.
advances in Graph Convolution Networks (GCN) [5, 15, 28] prompt attempts to
generalize CRU to Graph Convolutional Recurrent Unit (GCRU) [24, 17] so that
the global, non-Euclidean spatial dependency could be further captured.
In a similar fashion, we extend CRU to ODCRU by utilizing Origin-Destination
Convolution (OD-Conv) in each recurrent cell to simultaneously capture the
two-sided spatial dependency and temporal dependency in a sequence of OD
matrices. Taking the form of GRU, we define ODCRU as:
(l)
(l)
uτ = sigmoid(Θu ?(P(O) ,P(D) ) [Ω τ , H τ −1 ] + bu )
(l)
r = sigmoid(Θ ? (l)
r (P(O) ,P(D) ) [Ω τ , H τ −1 ] + br )
τ
(l)
(5)
(l)
C τ = tanh(ΘC ?(P(O) ,P(D) ) [Ω τ , (rτ H τ −1 )] + bC
(l)
(l)
H τ = uτ H τ −1 + (1 − uτ ) C τ
where Ω τ ∈ RN ×N ×ν and H τ ∈ RN ×N ×µ denote the input and hidden state
at timeslot τ ; uτ , rτ and C τ represent update gate, reset gate and candidate
state, respectively; and Θu , Θr , ΘC are learnable parameters in corresponding
OD-Convs. As the basic building block of ODCRN framework, ODCRU requires
auxiliary inputs of an OD graph pair (P(O) , P(D) ) to account for the two-sided
dependency. Based on the observation that most OD transitions concentrated
around the diagonal of an OD matrix, one can easily infer that the spatial
closeness plays an important role in OD matrix prediction. In practice, we adopt
the definition of adjacency matrix to represent this spatial locality, formally:
(
1 , if prefecture i and j are geographically adjacent
Ai,j = (6)
0 , otherwise
Then, letting (P(O) , P(D) ) = (A, A| ) gives the most straightforward assign-
ment for the input OD graph pair. However, solely relying on this definition is
not enough for three reasons: (1) global view is absent; (2) two-sided dependency
is not really handled because adjacency matrix is symmetric; (3) dynamic spatial
correlation is overlooked since A is time-invariant. The dynamicity of spatial
correlation manifests itself in the cases where people commute across-prefecture
for work in workdays and go out on weekends.
4.4 Dynamic Graph Constructor (DGC)
To solve the aforementioned three problems, we propose a Dynamic Graph
Constructor (DGC) to dynamically generate an observation-dependent OD graph
pair at each timeslot. This idea is rooted in the field of graph signal processing
where an important task is to learn a reasonable graph structure based on
observational data [9, 14, 41]. In our case, we aim to learn a pair of time-variant
graphs to represent the dynamic two-sided dependency in prefectures. Specifically,
we propose the learning schema below to satisfy our needs:
(
Pτ(O) = sof tmax(relu(Ωτ WO Ωτ| ))
(7)
Pτ(D) = sof tmax(relu(Ωτ| WD Ωτ ))Countrywide OD Matrix Prediction for COVID-19 9
where Ωτ ∈ RN ×N is the input of OD matrix observation at timeslot τ ; WO ∈
RN ×N and WD ∈ RN ×N are two learnable parameter matrices, used for discov-
ering hidden patterns under destinations and origins, respectively; relu rectifies
the core term to be non-negative and sof tmax normalizes each row. The learnt
(O) (D)
OD graph pair (Pτ , Pτ ) has good properties to represent the time-variant,
two-sided, entangled local and global dependencies on a scale of 0 to 1.
5 OD Matrix Based Epidemic Simulation Model
SIR is seen as one of the most fundamental compartmental models in epidemiology,
widely used for modeling and predicting the spread of infectious diseases such
as measles, mumps and rubella[2]. SEIR, as a variant of SIR, consists of four
compartments: S for the number of susceptible, E for the number of exposed,
which means the individuals in an incubation period but not yet infectious, I
for the number of infectious, and R for the number of recovered or deceased
(or immune) individuals. To represent the number of susceptible, infected and
recovered individuals varying over time, SEIR model is formally expressed by
the following set of ordinary differential equations:
dS I
= µN − βS − µS
dt N
dE I
= βS − εE − µE
dt N (8)
dI
= εE − γI − µI
dt
dR
= γI − µR
dt
where N = S + E + I + R, β is the effective contact rate of infected individual5 ,
ε is the progression rate to infectious state, γ and µ are the rates of recovery and
mortality, respectively. In our implementation, we ignore µ and only use β, ε, γ
to construct the model.
However, the classic SIR and SEIR model can only simulate the infection
number varying over time for single region. Thus, in this study, we extend it to
a multi-region SEIR model that can simultaneously simulate the time-varying
infection numbers for multiple regions and take the OD transitions among regions
into account. To this end, we introduce an SEIR matrix Ψ ∈ RN ×4 to denote the
S,E,I,R numbers of N regions. Note that according to the population density and
the intervention policy, the effective contact rate β varies from region to region
also from time to time, so we introduce a vector Bt ∈ RN to denote the different
β values for N regions at time t. Meanwhile, ε and γ prove to be decided by the
intrinsic property of specific infectious disease, therefore, regions share the same
time-constant value under COVID-19 scenario.
Eq.(8) (i) (i) (i) (i)
Ψti,: = [St , Et , It , Rt ] −−−−−→ Ψt0i,: = [St0
(i) (i) (i) (i)
, Et0 , It0 , Rt0 ], ∀i ∈ N (9)
(i)
Bt ,ε,γ
5
β here different with Definition 3 is a widely used notation for epidemic parameter.10 R. Jiang and Z. Wang et al.
+∆Ψt = [Ωt ]T · Ψt (10)
−∆Ψt = [Ωt ]Σ Ψt (11)
Ψt+1 = Ψt0 + σ(+∆Ψt − ∆Ψt ) (12)
Then the OD matrix-based SEIR algorithm is proposed as follows: (1) Initialize
the SEIR matrix Ψ with the population data and infection data of each prefecture;
(i)
(2) Given Bt and ε, γ, the S,E,I,R numbers for each region ri can be updated
as Eq.(9); (3) Normalize the OD transition matrix by row to get the transition
probability from origin-region ri to destination-region rj , and further set the
diagonal value to zero to eliminate the self-transition value; (4) We denote the
normalized OD matrix with zero diagonal value as Ω. Using Ω, the inflow of S,
E, I, R coming from other regions (i.e., +∆Ψ ) can be calculated with Eq.(10),
where [ ]T denotes matrix transpose and · denotes matrix multiplication; (5) To
derive the outflow of S, E, I, R (leaving SEIR) of each region (i.e., −∆Ψ ), we
sum Ω by row to get the total outside transition probability of each origin-region,
and let S, E, I, R people in each origin-region share the same transition value.
These two operations are together denoted as [ ]Σ . As shown by Eq.(11), −∆Ψ
can be calculated through element-wise product between [Ω]Σ ∈ RN ×4 and
Ψ ∈ RN ×4 ; (6) Ψ can be updated from t to t+1 by adding up the three parts,
namely intra-region SEIR, inflow SEIR, and outflow SEIR as Eq.(12). σ is a new
introduced parameter that denotes the actual inter-region transition rate under
epidemic control policies such as self-quarantine and work-from-home.
In our study, ε, γ, and σ are empirically tuned and set to 0.2, 0.1, 0.1,
respectively. By using the daily OD matrices [Ω1 , Ω2 , ..., ΩT ] and reported
COVID-19 infection number of each prefecture [I11:N , I21:N , ..., IT1:N ], we employ
Particle Swarm Optimization (PSO) algorithm to estimate the time-varying and
region-varying B through Eq.(9)∼(12). Finally, using the optimized B and the
predicted OD matrices [Ω̂T +1 , Ω̂T +2 , ..., Ω̂T +7 ], we can forecast the COVID-19
infection numbers [IˆT1:N ˆ1:N ˆ1:N
+1 , IT +2 , ..., IT +7 ] for the future one week via Eq.(9)∼(12).
6 Experiment
6.1 Data
We collaborate with Blogwatcher Inc. to get big human GPS trajectory data
that cover 5 million people in the 47 prefectures of Japan. The location data
are collected through smartphone apps that have a built-in module provided by
Blogwatcher Inc. under user’s consent. Any personally identifiable information
were not collected. Data attributes are anonymized ID, timestamp, longitude,
latitude, accuracy, OS type. The raw data file of one month is approximately
1TB in csv format, and contains around 180 GPS records per day per user.
After data cleaning and trip segmentation, each ID has average 10 GPS records
corresponding to either origin location or destination location. We select 2020/1/1/
∼ 2021/2/28 (425 days) as the target time period. Correspondingly, we collect
COVID-19 infection number of each prefecture in the same time period. ToCountrywide OD Matrix Prediction for COVID-19 11 check the representativeness of our GPS data, we further compare the population proportion of each prefecture with Census data and obtain R2 ≥ 0.8. According to Definition 1∼3, OD transition data among 47 prefectures are stored as a (425, 47, 47) tensor and COVID19 infection data are stored as a (425, 47) tensor. 6.2 Setting We make natural logarithm of the original OD tensor to have a relatively neat distribution. We split the data with ratio 6.4:1.6:2 to get train/validation/test datasets respectively. Adam is employed as the optimizer, where the batch size set to 16 and the learning rate to 0.0001. The training algorithm would either be early-stopped if the validation error converged within 20 epochs or be stopped after 200 epochs. The observation step α and prediction step β are both set to 7, which means we use the past one week of observations to do the next one week prediction. PyTorch was used to implement our proposed model. The experiments are performed on a GPU server with four 1080Ti graphics cards. Two layers of ODCRU are respectively used to construct the encoder and decoder of our proposed ODCRN. In each ODCRU, the size of the hidden state is set to 32. Finally, we evaluate the overall performance on the multi-step OD matrix prediction using three metrics: MSE (Mean Square Error), RMSE (Root Mean Square Error), MAE (Mean Absolute Error). 6.3 Evaluation on OD Matrix Prediction We implement four classes of baselines to compare and evaluate our proposed model on the OD matrix prediction task, including: Naive Forecasting Methods: (1) MonthlyAverage. We take the average of past 28 days of OD matrices as the prediction. (2) CopyLastWeek. We directly copy the OD matrix from last week (recent 7 days) as the prediction. Video-like Predictive Models: (3) ST-ResNet [39]. ST-ResNet is proposed to predict crowd flow of each region in a city. This model merges the time and flow dimensions together and uses three branches of CNN network to extract the seasonality of the data. (4) PCRN [42]. PCRN is built based on ConvGRU to take both recent observations and periodic weekly/daily patterns into account. Graph-based Spatio-temporal Models: (5) ST-GCN [37]. ST-GCN is one of the earliest models that integrate temporal convolution (TCN) and graph convolution (GCN) to do spatiotemporal modeling. (6) DCRNN [24]. DCRNN developed a new type of GCN called diffusion convolution and embedded it into GRU to perform recurrent graph convolution. (7) Graph WaveNet [33]. Graph WaveNet is also based on TCN and GCN, but it proposes an adaptive/learnable graph to replace the static adjacency graph. OD Matrix Prediction Models: (8) GEML [32]. The origin-destination matrix prediction model is a state-of-the-art graph-based transition prediction model that utilizes graph embedding and periodic-skip LSTM to predict the OD matrix. (9) CSTN [26]. CSTN is a grid-based model for taxi OD matrix prediction, where the OD matrix and DO matrix are respectively modeled by
12     R. Jiang and Z. Wang et al.

Table 1: Comparison of Overall Performance between Four Classes of Baselines and
   Proposed ODCRN on Multi-step Origin-Destination Matrix Prediction Task
                   in Power on Natural Exponential Function
           Model                      MSE       RMSE         MAE
            MonthlyAverage            0.1915      0.4376       0.3000
            CopyLastWeek              0.2630      0.5128       0.3191
            STResNet [39]             0.1648      0.4060       0.2822
            PCRN [42]                 0.1636      0.4044       0.2864
            STGCN [37]                0.1656      0.4070       0.2910
            DCRNN [24]                0.1682      0.4102       0.2954
            Graph WaveNet [33]        0.1632      0.4040       0.2887
            GEML [32]                 0.1606      0.4008       0.2806
            CSTN [26]                 0.1608      0.4010       0.2857
            MPGCN [29]                0.1609      0.4011       0.2859
            ODCRN (w/o DGC)           0.1585      0.3982      0.2820
            ODCRN                     0.1558      0.3947      0.2802

two branches of euclidean CNNs and then fused together. (10) MPGCN [29].
MPGCN applied 2DGCN to multiple graphs including adjacency graph, POI
similarity graph, and correlation graph to predict the OD matrix.
Overall performance: In Table 1, we compare the overall performance between
the adopted four classes of baselines and proposed ODCRN on the multi-step
OD matrix prediction task. Overall, deep learning based approaches as a group
outperforms two naive forecasting methods to a great extent. The experimental
results also show that the difference between video-like and graph-based predictive
models are not significant. This phenomenon might be explained by the way

Fig. 3: Comparison of Stepwise Performance between Deep Learning Based Models on
                Multi-step Origin-Destination Matrix Prediction Task
Countrywide OD Matrix Prediction for COVID-19 13
we define the static graph, for which we employ adjacency matrix that only
accounts for local dependency. In addition, OD matrix prediction oriented models
demonstrate superior performance compared with regular graph-based methods.
Our proposed ODCRN model, by simultaneously capturing the dynamic two-sided
spatial and temporal dependency, reaches the best performance in all metrics.
Besides, Figure 3 illustrates the comparison of stepwise performance between
all deep learning based models. Generally, the prediction accuracy drops as the
forecasting horizon increases. Compared with other models, ODCRN turns out
to be less prone to extreme values and more stable and consistent throughout
the whole-week prediction period.
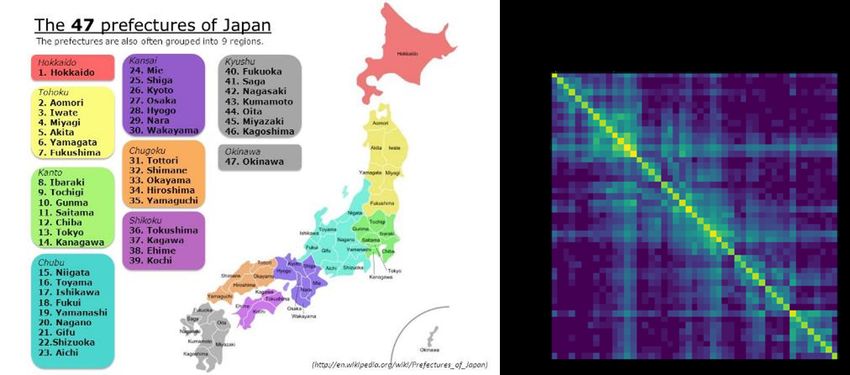
6.4 Evaluation on COVID-19 Simulation
With the predicted OD matrices, we use the OD matrix based SEIR model
Eq.(9)∼(12) to forecast the COVID-19 infection numbers from 2020/12/12 to
2021/1/6 (four weeks). The epidemic parameter B is estimated with the COVID-
19 data from 2020/11/12 to 2020/12/11. We demonstrate the performance over
two metropolitan areas as shown in Fig.4. Kanto metropolitan area (Fig.4-Left)
consists of four prefectures, Tokyo, Chiba, Kanagawa, and Saitama. Kansai
metropolitan area (Fig.4-Right) consists of three prefectures, Osaka, Kyoto, and
Hyogo. These two areas respectively containing the biggest two cities of Japan,
namely Tokyo and Osaka, have extremely high population density, that results
in a severe epidemic situation during COVID-19. Japanese government specially
lifted The State of Emergency for these two areas. We plot the time-series ground-
truth and prediction number with solid line and dotted line respectively as
Fig.4, through which we can see that our model generally achieves a satisfactory
performance and behaves rather robust for the the first three weeks. However,
since the epidemic situation in both Kanto and Kansai area was changing very
rapidly, the pre-estimated time-varying B could not remain effective for the fourth
week.
Fig. 4: OD Matrix Based COVID-19 Prediction for Kanto and Kansai Area.14 R. Jiang and Z. Wang et al.
7 Conclusion
In the worldwide COVID-19 emergency, human mobility has been taken as a
significant factor for the epidemic spread. In this study, we model countrywide
human mobility with origin-destination transition matrix and apply it to forecast
the COVID-19 infection numbers for all of the prefectures in Japan. For multi-
step Origin-Destination matrix prediction, we present a novel deep learning
model called Origin-Destination Convolutional Recurrent Network (ODCRN)
with encoder-decoder structure. It can perform graph convolution along the Origin
axis and the Destination axis to simultaneously capture the two-sided spatial
dependency in Origin-Destination matrix. Then we extend the classic SEIR model
to OD matrix based epidemic model to do the multi-region infection prediction.
The evaluation results demonstrate the high reliability and applicability of our
model for COVID-19 scenario. The code of our model has been uploaded to
github https://github.com/deepkashiwa20/ODCRN.git.
References
1. https://qianxi.baidu.com/
2. https://en.wikipedia.org/wiki/Compartmental\_models\_in\_epidemiology/
The\_SIR\_model
3. Bai, L., Yao, L., Kanhere, S., Wang, X., Sheng, Q., et al.: Stg2seq: Spatial-temporal
graph to sequence model for multi-step passenger demand forecasting. In: IJCAI.
pp. 1981–1987 (2019)
4. Bertuzzo, E., Mari, L., Pasetto, D., Miccoli, S., Casagrandi, R., Gatto, M., Rinaldo,
A.: The geography of covid-19 spread in italy and implications for the relaxation of
confinement measures. Nature communications 11(1), 1–11 (2020)
5. Bruna, J., Zaremba, W., Szlam, A., Lecun, Y.: Spectral networks and locally
connected networks on graphs. In: International Conference on Learning Represen-
tations (2014)
6. Chang, S., Pierson, E., Koh, P.W., Gerardin, J., Redbird, B., Grusky, D., Leskovec,
J.: Mobility network models of covid-19 explain inequities and inform reopening.
Nature 589(7840), 82–87 (2021)
7. Chinazzi, M., Davis, J.T., Ajelli, M., Gioannini, C., Litvinova, M., Merler, S.,
y Piontti, A.P., Mu, K., Rossi, L., Sun, K., et al.: The effect of travel restrictions on
the spread of the 2019 novel coronavirus (covid-19) outbreak. Science 368(6489),
395–400 (2020)
8. Della Rossa, F., Salzano, D., Di Meglio, A., De Lellis, F., Coraggio, M., Calabrese,
C., Guarino, A., Cardona-Rivera, R., De Lellis, P., Liuzza, D., et al.: A network
model of italy shows that intermittent regional strategies can alleviate the covid-19
epidemic. Nature communications 11(1), 1–9 (2020)
9. Diao, Z., Wang, X., Zhang, D., Liu, Y., Xie, K., He, S.: Dynamic spatial-temporal
graph convolutional neural networks for traffic forecasting. In: Proceedings of the
AAAI Conference on Artificial Intelligence. vol. 33, pp. 890–897 (2019)
10. Feng, J., Li, Y., Zhang, C., Sun, F., Meng, F., Guo, A., Jin, D.: Deepmove:
Predicting human mobility with attentional recurrent networks. In: Proceedings of
the 2018 World Wide Web Conference. pp. 1459–1468. International World Wide
Web Conferences Steering Committee (2018)Countrywide OD Matrix Prediction for COVID-19 15
11. Gao, Q., Zhou, F., Trajcevski, G., Zhang, K., Zhong, T., Zhang, F.: Predicting
human mobility via variational attention. In: The World Wide Web Conference. pp.
2750–2756. ACM (2019)
12. Gatto, M., Bertuzzo, E., Mari, L., Miccoli, S., Carraro, L., Casagrandi, R., Rinaldo,
A.: Spread and dynamics of the covid-19 epidemic in italy: Effects of emergency
containment measures. Proceedings of the National Academy of Sciences 117(19),
10484–10491 (2020)
13. Geng, X., Li, Y., Wang, L., Zhang, L., Yang, Q., Ye, J., Liu, Y.: Spatiotemporal
multi-graph convolution network for ride-hailing demand forecasting. In: 2019 AAAI
Conference on Artificial Intelligence (AAAI’19) (2019)
14. Guo, S., Lin, Y., Feng, N., Song, C., Wan, H.: Attention based spatial-temporal
graph convolutional networks for traffic flow forecasting. In: Proceedings of the
AAAI Conference on Artificial Intelligence. vol. 33, pp. 922–929 (2019)
15. Hamilton, W., Ying, Z., Leskovec, J.: Inductive representation learning on large
graphs. In: Advances in neural information processing systems. pp. 1024–1034
(2017)
16. Hoang, M.X., Zheng, Y., Singh, A.K.: Fccf: forecasting citywide crowd flows based on
big data. In: Proceedings of the 24th ACM SIGSPATIAL International Conference
on Advances in Geographic Information Systems. pp. 1–10 (2016)
17. Hu, J., Yang, B., Guo, C., Jensen, C.S., Xiong, H.: Stochastic origin-destination
matrix forecasting using dual-stage graph convolutional, recurrent neural networks.
In: 2020 IEEE 36th International Conference on Data Engineering (ICDE). pp.
1417–1428. IEEE (2020)
18. Jiang, R., Song, X., Fan, Z., Xia, T., Chen, Q., Chen, Q., Shibasaki, R.: Deep
roi-based modeling for urban human mobility prediction. Proceedings of the ACM
on Interactive, Mobile, Wearable and Ubiquitous Technologies 2(1), 1–29 (2018)
19. Jiang, R., Song, X., Fan, Z., Xia, T., Chen, Q., Miyazawa, S., Shibasaki, R.: Deep-
urbanmomentum: An online deep-learning system for short-term urban mobility
prediction. In: AAAI. pp. 784–791 (2018)
20. Jiang, R., Song, X., Huang, D., Song, X., Xia, T., Cai, Z., Wang, Z., Kim, K.S.,
Shibasaki, R.: Deepurbanevent: A system for predicting citywide crowd dynamics
at big events. In: Proceedings of the 25th ACM SIGKDD International Conference
on Knowledge Discovery & Data Mining. pp. 2114–2122. ACM (2019)
21. Kraemer, M.U., Yang, C.H., Gutierrez, B., Wu, C.H., Klein, B., Pigott, D.M.,
Du Plessis, L., Faria, N.R., Li, R., Hanage, W.P., et al.: The effect of human
mobility and control measures on the covid-19 epidemic in china. Science 368(6490),
493–497 (2020)
22. LeCun, Y., Bottou, L., Bengio, Y., Haffner, P.: Gradient-based learning applied to
document recognition. Proceedings of the IEEE 86(11), 2278–2324 (1998)
23. Li, R., Pei, S., Chen, B., Song, Y., Zhang, T., Yang, W., Shaman, J.: Substantial
undocumented infection facilitates the rapid dissemination of novel coronavirus
(sars-cov-2). Science 368(6490), 489–493 (2020)
24. Li, Y., Yu, R., Shahabi, C., Liu, Y.: Diffusion convolutional recurrent neural
network: Data-driven traffic forecasting. In: International Conference on Learning
Representations (2018)
25. Lin, Z., Feng, J., Lu, Z., Li, Y., Jin, D.: Deepstn+: Context-aware spatial-temporal
neural network for crowd flow prediction in metropolis. In: Proceedings of the AAAI
Conference on Artificial Intelligence. vol. 33, pp. 1020–1027 (2019)
26. Liu, L., Qiu, Z., Li, G., Wang, Q., Ouyang, W., Lin, L.: Contextualized spatial–
temporal network for taxi origin-destination demand prediction. IEEE Transactions
on Intelligent Transportation Systems 20(10), 3875–3887 (2019)16 R. Jiang and Z. Wang et al.
27. Liu, Q., Wu, S., Wang, L., Tan, T.: Predicting the next location: A recurrent model
with spatial and temporal contexts. In: Proceedings of the AAAI Conference on
Artificial Intelligence. vol. 30 (2016)
28. Monti, F., Bronstein, M., Bresson, X.: Geometric matrix completion with recur-
rent multi-graph neural networks. In: Advances in Neural Information Processing
Systems. pp. 3697–3707 (2017)
29. Shi, H., Yao, Q., Guo, Q., Li, Y., Zhang, L., Ye, J., Li, Y., Liu, Y.: Predicting
origin-destination flow via multi-perspective graph convolutional network. In: 2020
IEEE 36th International Conference on Data Engineering (ICDE). pp. 1818–1821.
IEEE (2020)
30. Sun, J., Zhang, J., Li, Q., Yi, X., Liang, Y., Zheng, Y.: Predicting citywide crowd
flows in irregular regions using multi-view graph convolutional networks. IEEE
Transactions on Knowledge and Data Engineering (2020)
31. Wang, D., Cao, W., Li, J., Ye, J.: Deepsd: supply-demand prediction for online
car-hailing services using deep neural networks. In: 2017 IEEE 33rd International
Conference on Data Engineering (ICDE). pp. 243–254. IEEE (2017)
32. Wang, Y., Yin, H., Chen, H., Wo, T., Xu, J., Zheng, K.: Origin-destination matrix
prediction via graph convolution: a new perspective of passenger demand modeling.
In: Proceedings of the 25th ACM SIGKDD International Conference on Knowledge
Discovery & Data Mining. pp. 1227–1235 (2019)
33. Wu, Z., Pan, S., Long, G., Jiang, J., Zhang, C.: Graph wavenet for deep spatial-
temporal graph modeling. In: IJCAI. pp. 1907–1913 (2019)
34. Xingjian, S., Chen, Z., Wang, H., Yeung, D.Y., Wong, W.K., Woo, W.c.: Convolu-
tional lstm network: A machine learning approach for precipitation nowcasting. In:
Advances in neural information processing systems. pp. 802–810 (2015)
35. Yao, H., Wu, F., Ke, J., Tang, X., Jia, Y., Lu, S., Gong, P., Ye, J., Li, Z.: Deep
multi-view spatial-temporal network for taxi demand prediction. In: Proceedings of
the AAAI Conference on Artificial Intelligence. vol. 32 (2018)
36. Ye, J., Sun, L., Du, B., Fu, Y., Tong, X., Xiong, H.: Co-prediction of multiple trans-
portation demands based on deep spatio-temporal neural network. In: Proceedings
of the 25th ACM SIGKDD International Conference on Knowledge Discovery &
Data Mining. pp. 305–313 (2019)
37. Yu, B., Yin, H., Zhu, Z.: Spatio-temporal graph convolutional networks: a deep
learning framework for traffic forecasting. In: Proceedings of the 27th International
Joint Conference on Artificial Intelligence. pp. 3634–3640. AAAI Press (2018)
38. Yuan, Z., Zhou, X., Yang, T.: Hetero-convlstm: A deep learning approach to traffic
accident prediction on heterogeneous spatio-temporal data. In: Proceedings of the
24th ACM SIGKDD International Conference on Knowledge Discovery & Data
Mining. pp. 984–992. ACM (2018)
39. Zhang, J., Zheng, Y., Qi, D.: Deep spatio-temporal residual networks for citywide
crowd flows prediction. In: Proceedings of the AAAI Conference on Artificial
Intelligence. vol. 31 (2017)
40. Zhang, J., Zheng, Y., Sun, J., Qi, D.: Flow prediction in spatio-temporal networks
based on multitask deep learning. IEEE Transactions on Knowledge and Data
Engineering 32(3), 468–478 (2019)
41. Zhang, Q., Chang, J., Meng, G., Xiang, S., Pan, C.: Spatio-temporal graph structure
learning for traffic forecasting. In: Proceedings of the AAAI Conference on Artificial
Intelligence. vol. 34, pp. 1177–1185 (2020)
42. Zonoozi, A., Kim, J.j., Li, X.L., Cong, G.: Periodic-crn: A convolutional recurrent
model for crowd density prediction with recurring periodic patterns. In: IJCAI. pp.
3732–3738 (2018)You can also read