Deep learning based automated and universal bubble detection and mask extraction in complex two phase flows
←
→
Page content transcription
If your browser does not render page correctly, please read the page content below
www.nature.com/scientificreports
OPEN Deep learning‑based automated
and universal bubble detection
and mask extraction in complex
two‑phase flows
Yewon Kim1 & Hyungmin Park1,2*
While investigating multiphase flows experimentally, the spatiotemporal variation in the interfacial
shape between different phases must be measured to analyze the transport phenomena. For this,
numerous image processing techniques have been proposed, showing good performance. However,
they require trial-and-error optimization of thresholding parameters, which are not universal for all
experimental conditions; thus, their accuracy is highly dependent on human experience, and the
overall processing cost is high. Motivated by the remarkable improvements in deep learning-based
image processing, we trained the Mask R-CNN to develop an automated bubble detection and
mask extraction tool that works universally in gas–liquid two-phase flows. The training dataset was
rigorously optimized to improve the model performance and delay overfitting with a finite amount
of data. The range of detectable bubble size (particularly smaller bubbles) could be extended using a
customized weighted loss function. Validation with different bubbly flows yields promising results,
with AP50 reaching 98%. Even while testing with bubble-swarm flows not included in the training set,
the model detects more than 95% of the bubbles, which is equivalent or superior to conventional
image processing methods. The pure processing speed for mask extraction is more than twice as fast
as conventional approaches, even without counting the time required for tedious threshold parameter
tuning. The present bubble detection and mask extraction tool is available online (https://github.com/
ywflow/BubMask).
Measurement techniques based on optical visualization are ubiquitous approaches that are now being adopted
in the experimental investigations of diverse problems from biological (small scale) to industrial (large scale)
phenomena1–4. This is also true while studying multiphase flows, where the simultaneous measurement of indi-
vidual phases over a large region of interest, without disturbing the flow, is advantageous (compared to intrusive
measurement methods) in understanding the interaction between phases. In dealing with a gas–liquid two-phase
(bubbly) flow, in particular, it is critical to measure the spatiotemporal variation of the interfacial shape accurately
for the purpose of analyzing the transport phenomena between p hases5–9. While detecting bubbles using opti-
cal visualization, the major obstacle is to identify and track individual bubbles (and statistics including the size
and velocity) from the overlapped bubble cluster. Numerous image processing techniques have been proposed
as tools for effective bubble detection, such as the Hough t ransform10,11, breakpoint m ethod12,13, and Watershed
transform9,14,15. These methods have proved to be useful, but the application of a simple image processing filter is
insufficient to process all images of bubbles with various geometrical features, because of the wide scatter of the
flow conditions and optical settings of each study. Even in a single image of a bubbly flow, bubble images have
different characteristics that cannot be readily distinguished using a single process (criteria). While addressing
this issue, our group established a reliable framework to detect bubbles in different types of bubbly flows with
volume void fractions as high as 2% by rigorously synthesizing digital image processing a lgorithms5,8; however,
the limitation of this approach still exists. Most importantly, conventional methods require the optimization of
coefficients or thresholds by trial-and-error, and they are not universally applicable to various types of bubbly
flow. Therefore, detection accuracy largely varies depending on the skillfulness of the researcher, and the overall
processing cost including human resources is very high.
In recent years, deep learning has been recognized as a powerful tool in the field of digital image processing,
and has also proved promising in addressing various problems in fluid m echanics20–25. These studies are finding
1
Department of Mechanical Engineering, Seoul National University, Seoul 08826, Korea. 2Institute of Advanced
Machines and Design, Seoul National University, Seoul 08826, Korea. *email: hminpark@snu.ac.kr
Scientific Reports | (2021) 11:8940 | https://doi.org/10.1038/s41598-021-88334-0 1
Vol.:(0123456789)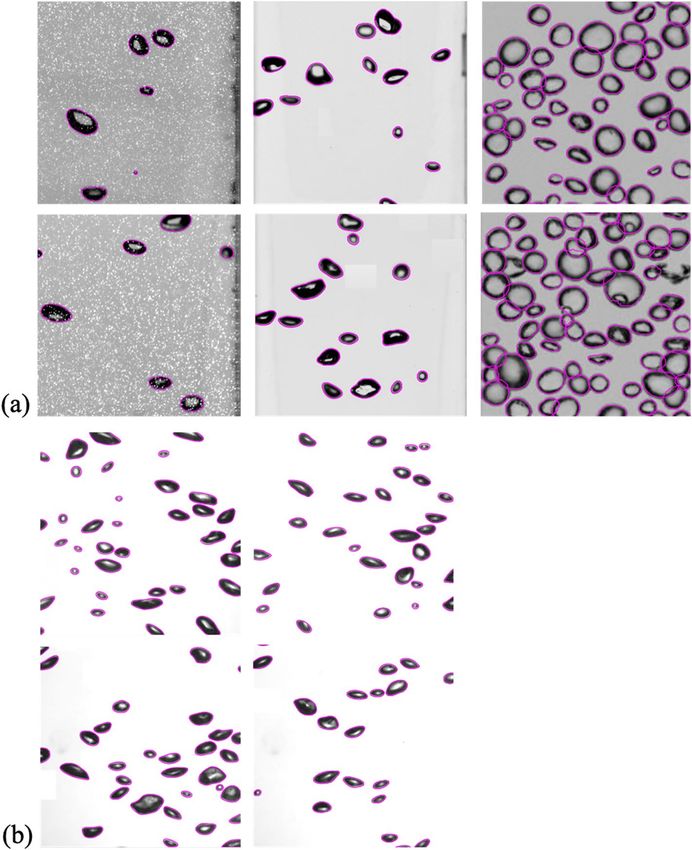
www.nature.com/scientificreports/
Figure 1. Examples of bubbly flow images used as a training and test dataset: (a) experimental data of upward
ipe8; (b) synthetic bubble images from B
bubbly flows in an expansion p ubGAN40; (c) experimental data of
bubble-swarm flow9.
ways to overcome long-lasting problems by applying a deep learning-based methodology to solve governing
equations or to improve experimental techniques, which have been shown to enhance model accuracy and save
on overall data processing cost, which is dominated by human resources. Recent experiments in multiphase flow
studies attempted to detect objects (e.g., bubbles, droplets, and particles) by combining deep learning models like
object detection models such as Faster R-CNN26 with conventional image processing in gas–liquid two-phase
flow27–33. Cerqueira and P aladino27 determined the best fitted ellipse of each candidate bubble using the region
proposal algorithm and a CNN (convolution neural network), and Poletaev et al.31 found the center, axes, and
orientation of each bubble in a bubbly jet flow using an autoencoder and a CNN classifier. To understand the
detailed interactions between each phase, however, it is important to know the exact shape (not just the bound-
ing box or fitted ellipse) of the gas–liquid interface, which has not been possible previously. The aforementioned
studies have a distinct limitation in that it is not feasible to obtain the actual bubble geometry under the shape
instability (i.e., wobbling or deformation) caused by various flow conditions, because they considered a narrow
range of bubble shapes, namely spherical or synthetic (artificially manipulated). It should also be noted that
testing (validation) of the trained model with untrained data is missing in most previous studies.
Therefore, in the present study, we develop and validate a fully automated tool to detect and extract the actual
shape of bubbles based on a deep-learning framework, which can be universally applied to various types of
two-phase flows. We focused on instance segmentation, which extracts a pixel-wise segmentation mask of each
detected instance, one of the representative challenges in the area of computer v ision34,35. It has been actively
adopted in fields where it is necessary to identify each instance under harsh conditions, such as high noise or
variation in image contrast and color. For example, there are many studies in biology and biotechnology that
need to identify each cell or tissue in a complex image36–39. We train the Mask R-CNN34, one of the instance
segmentation models, with training data composed of bubbly flow data obtained experimentally under differ-
ent conditions and synthetic bubble images. We optimized the amount and composition of training data from
different sources and used a variety of image augmentation methods to optimize model performance. Typically,
the object detection model requires a large amount of training data, but we were able to achieve a high detection
performance with a relatively small but rigorously refined dataset. In addition, a customized loss function was
used to improve the performance of small bubble detections, which is typically poorer than that of larger object
detections34,36. As a result, we obtained a fully automated bubble detection and mask extraction tool that is effec-
tive in different gas–liquid bubbly flows without manually tuning the thresholds. We hope this will be useful in
reducing the difficulties in the analysis of the optical images of multiple objects interacting in a complex manner.
Training and evaluation of the algorithm
Data acquisition and optimization. For a training dataset, we used both experimental and synthetic
bubbly flow images obtained from the upward bubbly flows in an expansion p ipe8 and BubGAN a lgorithm40,
respectively (Fig. 1a,b). The experimental bubbly flow data included bubbles with a size range of 7–98 pixels
Scientific Reports | (2021) 11:8940 | https://doi.org/10.1038/s41598-021-88334-0 2
Vol:.(1234567890)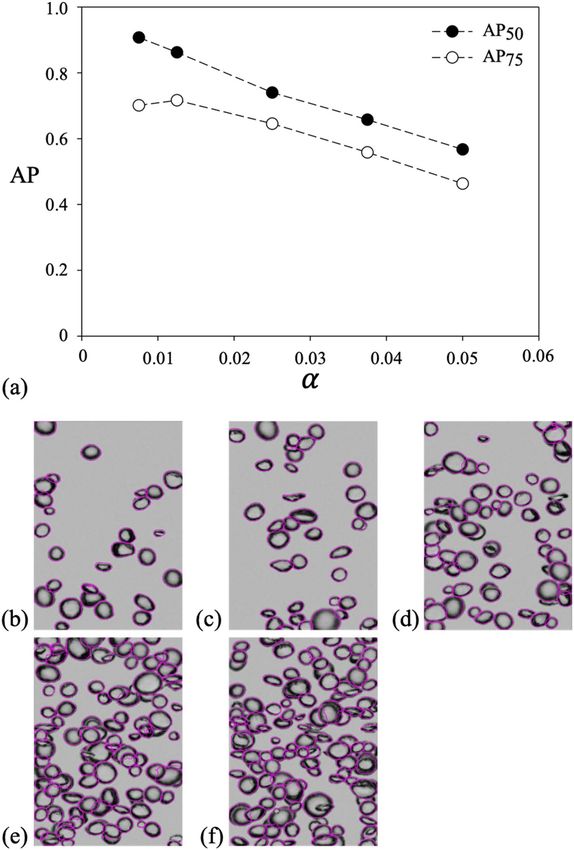
www.nature.com/scientificreports/
Bubbly flow in an expansion
pipe8
Source of data two-phase PIV Shadowgraph BubGAN40 Bubble-swarm flow9
200 × 300
Resolution [pixels] 736 × 1120 576 × 1032 624 × 976
100 × 900
Bubble size [pixels] 7–98 (46.8) 10–60 (31.4) 4–123 (34.0) 7–65 (28.3)
Volume void fraction [%] 0.72 0.72 3.0–8.0 0.3–2.0
# of images 1588 854 150 –
Training set
# of bubbles 8160 14,640 15,280 –
# of images 8 8 8 8
Test set
# of bubbles 40 120 770 330
Table 1. Details for training and test datasets. The numbers in the bracket denote the averaged bubble size.
(0.25–3.4 mm in physical scale), and its volume void fraction was 0.72%. As shown in Fig. 1(a), they were
obtained using two different techniques: two-phase particle image velocimetry (PIV) and shadowgraph. Whereas
the shadowgraph visualizes the bubble shadow only, the two-phase PIV measures the liquid-phase velocity as
well as the bubble statistics (shadows). Thus, the images obtained using the two-phase PIV were added to the
training dataset to make the model robust in environments, wherein the optical image has a significant level of
noise (represented by seeding particle images). In addition, the training dataset would benefit from the fact that
the distribution of gray levels in the image differs depending on the optical setup8,9. Because one of our primary
goals is to improve the performance of disassembling of overlapped bubbles, the conditions possibly missing in
the experimental dataset can be supplemented by the synthetic dataset in which the size and distribution of bub-
bles are controlled. For the data produced by the BubGAN, the bubble size was varied between 4 and 123 pixels,
and the intersection over union (IoU) between two bounding boxes (of each bubble) was set as I oUB = 0.11, 0.16,
and 0.2 (Fig. 1(b)). A much higher value of IoUB caused negative effects, in that the dense bubble population
would lead to excessive split of bubbles. Here, the IoU indicates the ratio of the overlapping area between two
objects to the union area. The void fraction of the synthetic dataset was set to 3.0–8.0%. To add bubbles smaller
than the average size of 35 pixels in diameter, on the other hand, the height of the image with IoUB = 0.16 was
adjusted to three times longer than for other cases (IoUB = 0.11 and 0.2), because all training inputs are scaled to
be the same size (640 × 640 pixels), regardless of the physical size of the image.
Although some of the images from the same experimental conditions as the training dataset were used to
evaluate the model, we also added the experimental data of bubble-swarm fl ow9 to the test dataset, which was
not included in the training set (Fig. 1(c)). The bubble size range in the bubble-swarm flow data in the test
set was 7–65 pixels (0.6–5.2 mm) with a volume void fraction of 0.3–2.0%. For all experimental images in the
training and test datasets, the overlapped bubbles that were difficult to obtain the exact separated mask (ground
truth) were removed to avoid detrimental effects to the model. The conditions of the training and test datasets
are listed in Table 1.
In general, a model trained with more data performs better, but there is a practical limit to the amount, as
well as the level of quality, of data that can be obtained from the experiments. Therefore, we needed to optimize
the composition of the training dataset and ran several experiments to determine the optimal condition. In
other words, two models were trained for the same iterations, the first one was trained with the experimental
data, whereas the second one was trained with the synthetic data. They were then evaluated with the same test
dataset: 30% from the upward bubbly flow in an expansion pipe, 45% from the synthetic bubble images, and 25%
from the bubble-swarm flow. The model trained with the synthetic data only exhibited half the accuracy ( AP50,
average precision (AP) for the cases of IoU ≥ 0.5) as the model trained only with the experimental data, thereby
indicating that the model trained with only the synthetic dataset (even though its size is large) does not provide
the desired performance. The experimental data play a critical role in transferring the ability to recognize the
actual bubble shapes under various conditions.
By adding synthetic bubble images to the training set of the experimental data, it was enhanced to disas-
semble the overlapped bubbles. Moreover, we found that the accuracy ( AP50) increased slightly if the training
dataset included the experimental images without a brightness gradient inside the bubble shadows, i.e., if all the
bubbles were completely filled with black color. The optimized compositions of the training and test datasets
are presented in Table 1.
Deep learning model and training configurations. Mask R-CNN is an instance segmentation model
that labels each pixel corresponding to each instance detected by adding a parallel mask branch to Faster
R-CNN, a widely used object detection model. In this study, we used the Matterport Mask R-CNN implemen-
tation (https://github.com/matterport/Mask_RCNN), using ResNet-101 as the backbone and applied transfer
learning from pre-trained COCO weights (https://github.com/matterport/Mask_RCNN/releases/download/
v2.0/mask_rcnn_coco.h5) to maximize the data efficiency and delay overfitting. The model was trained for 24
epochs using a batch size of 1, with an initial learning rate of 1 0–4, which was optimized for our computing envi-
ronment using a grid search (from 1 0–2 to 1 0–5), while decreasing it by a factor of 10 after every 10 epochs. From
the entire model, only ResNet stage 5 and the head layer were re-trained, and it was empirically shown that the
highest accuracy was achieved before the occurrence of overfitting, compared to the selection of other layers to
Scientific Reports | (2021) 11:8940 | https://doi.org/10.1038/s41598-021-88334-0 3
Vol.:(0123456789)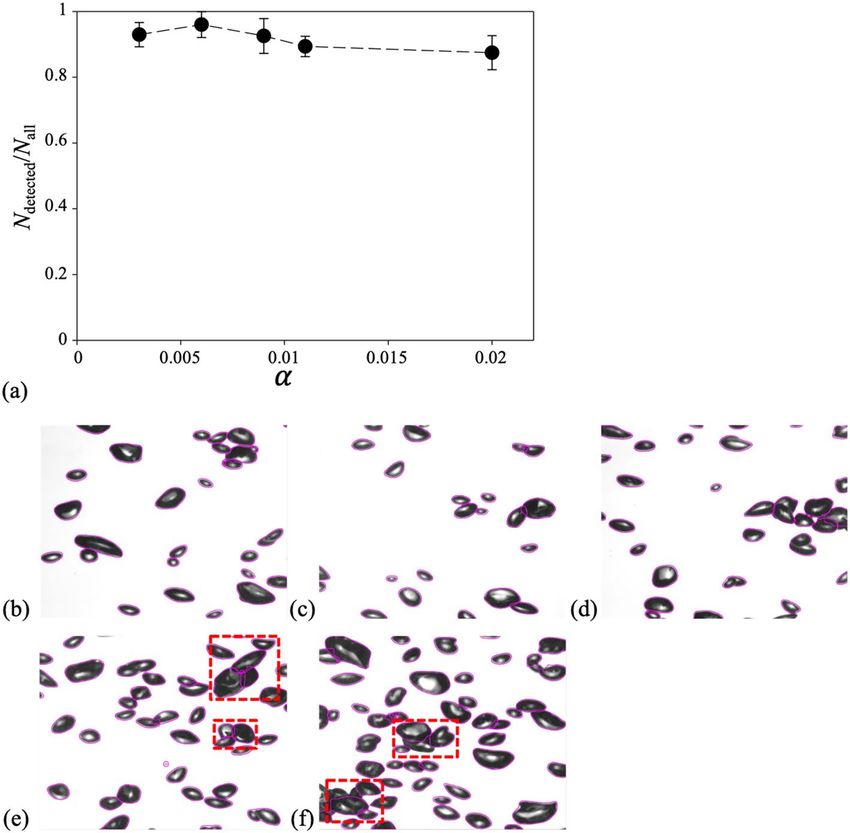
www.nature.com/scientificreports/
Figure 2. Mask averaged precision based on the IoU threshold and object size range. set #1: all test dataset in
Table 1, set #2: images with similar experimental conditions to the training s et8,40, set #3: images with different
experimental conditions from the training dataset9.
be trained. In addition, to slow down the overfitting, we applied several image augmentations, such as flipping,
rotation, and Gaussian noise addition, randomly to the training input image at each iteration. For the training,
ADAM was chosen as an optimizer, and the regularization weight decay value was set to 1 0–4. The training was
conducted on a single NVIDIA RTX 2080 Ti GPU.
In general, large objects in an image have a dominant influence on the training loss of the object detection
model34,36, and thus the accuracy of smaller objects detection tends to be low. Regarding the bubble detection
problem, however, the detection accuracy of small bubbles is as important as that of large bubbles, because the
bubble size follows a Gaussian distribution in a typical gas–liquid two-phase flows, and their scale-wise inter-
actions are especially important in studying the transport p henomenon5,8,9. Therefore, we improved the mask
accuracy of small bubbles using a customized loss function that increases or reduces the effect of the bubble size
on the loss by weighting the loss according to the bubble size (more details are provided in the Methods section).
As a result, the mask accuracy of small bubbles ( APS) increased by approximately 4%, and the overall accuracy
(AP50) slightly increased (the definitions of APx are provided in the next section). More configuration details can
be found in our code, which is available online (https://github.com/ywflow/BubMask).
Evaluation of the bubble mask extraction performance. The performance of the model was evalu-
ated by calculating the mask AP for each mask IoU threshold and object size range, following the COCO evalu-
ation metrics (https://cocodataset.org/#detection-eval). The evaluation metrics used include the AP (averaged
over IoU thresholds from 0.5 to 0.95 with intervals of 0.05), AP50 (for IoU ≥ 0.5), and AP75 (IoU ≥ 0.75) according
to the IoU threshold, and A PS, APM, and A PL according to the bubble size of the test dataset. Here, the subscript
refers to the IoU threshold as a percentage or the size range of the bubble. The ranges of bubble size (db) for the
APS, APM, and APL were determined by classifying all bubbles in the test dataset into small (db < 22.6 pixels),
medium (22.6 pixels ≤ db < 39.5 pixels), and large ( db > 39.5 pixels), respectively, and they cover 36%, 38%, and
26% of the total number of bubbles tested. This ratio was determined intentionally to evaluate the effect of the
customized loss function on the model performance quantitatively, especially for detecting small bubbles. It is
noted that each type of AP for each image was averaged over all corresponding images in the test dataset, and
not just from a single test, while maintaining the same number of images for all types of data. This is because the
accuracy of each image is also important to confirm the universality of the present model which works in vari-
ous complex two-phase flows; as mentioned above, each test image has different levels of bubble density, bubble
locations, image background, and lighting conditions, which requires the development of a universal model.
Results and discussion
Bubble detection and mask extraction. Figure 2 shows the accuracy (AP) of the present model depend-
ing on the IoU threshold value and object size range, evaluated using three test datasets, which are designated
as set #1, #2, and #3, respectively. Each test set included all the test images, images from similar experimental
conditions to the training set8,40, and images of different experimental conditions9 from the training dataset (see
Table 1). The present model exhibits a high accuracy not only for test set #2, which has similar experimental
conditions as the training set, but also for set #3, which was not included in the training set. While the accuracy
variation among the test sets is not substantial in general, the difference in APS between test sets #2 and #3 is rela-
tively large. This is because the bubbles in the small size range of set #2 are smaller than the bubbles in the small
size range of set #3. Even if the magnitude of the mask difference between the ground truth and the detected
mask is the same for the large bubbles, the IoU is largely reduced for small bubbles, resulting in a significant
decrease in the accuracy of detection.
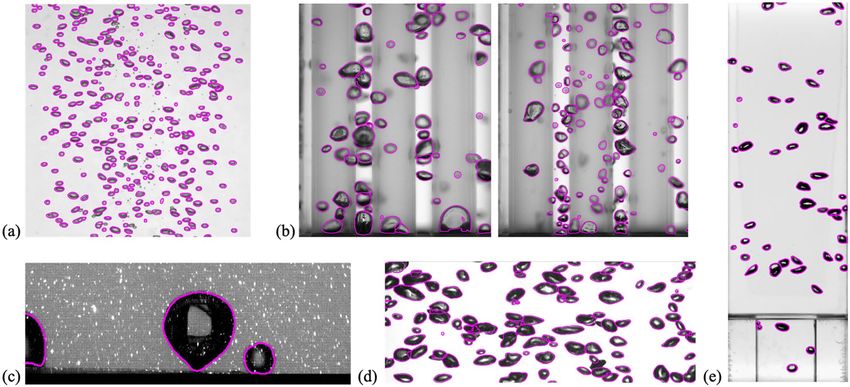
The representative results of bubble edge (mask) detection by the present model (for an IoU threshold of
0.5) are shown in Fig. 3. It is clear that the detected bubble shapes follow the actual bubble shadows quite well.
Based on the results shown in Figs. 2 and 3, we deem it reasonable to represent the performance of the present
model based on A P50, because the difference between A P50 and A
P75 is small, and the IoU between the ground
Scientific Reports | (2021) 11:8940 | https://doi.org/10.1038/s41598-021-88334-0 4
Vol:.(1234567890)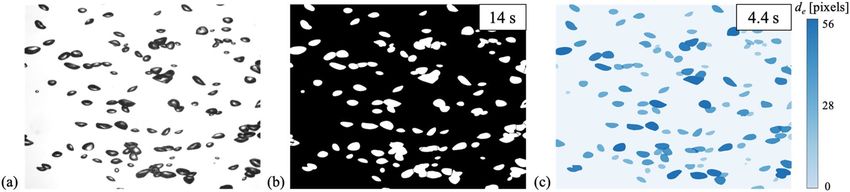
www.nature.com/scientificreports/
Figure 3. Bubble detection examples (IoU threshold of 0.5) for (a) test set #2 and (b) #3. Here, the purple solid
lines denote the extracted bubble shapes, and the images were cropped from original images and scaled for
better visibility.
truth and predicted mask would increase due to human error relating to the process of labeling the ground truth
mask (bubble edge). The A P50 for the entire test dataset (set #1) of the present model is 0.981 (it is 0.997 for set
#3), which is a promising bubble edge detection performance.
Assessment of model performance depending on bubbly flow conditions. In this section, we
present the assessment of the present model’s performance in several ways to confirm its effectiveness under a
wide range of experimental and/or flow conditions. First, we analyzed the dependency on the volume void frac-
tion (α) of the model performance, which is one of the most important parameters for characterizing the physics
of bubbly flows. In Fig. 4(a), we plotted the variation of A
P50 and A
P75 depending on the void fraction. Because
ground truth (separated bubble edges) for overlapped bubbles are required for a fair evaluation, the evaluation
was performed using the synthetic bubble images. The results of 50 synthetic images were averaged for each void
fraction. As expected, the accuracy tended to decrease as the void fraction increased, and AP50 and AP75 reached
0.567 and 0.463, respectively, when the void fraction increased to 5%. Considering that the typical maximum
void fraction in the experimental studies on bubbly flows using optical measurements is approximately 2–3%
(mostly below 1%)5,41,42, the A P50 is higher than 0.71–0.8 (0.9 for void fraction below 1%), which is acceptable.
Some representative result images for each void fraction are presented in Fig. 4(b)–(f), which qualitatively dem-
onstrate the operating range and performance of the present model.
Next, we test the model with experimental bubble-swarm flow d ata9, which includes a larger number of over-
lapped bubbles than the images used in the training dataset, to determine the effectiveness of the present model
in two-phase flows with a moderate void fraction (up to approximately 2%). Unlike that for synthetic images,
Scientific Reports | (2021) 11:8940 | https://doi.org/10.1038/s41598-021-88334-0 5
Vol.:(0123456789)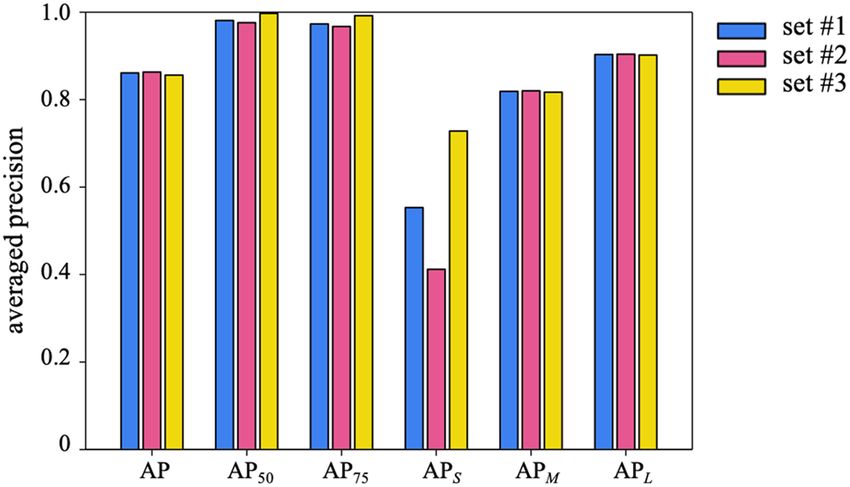
www.nature.com/scientificreports/
Figure 4. (a) Variation of AP50 and AP75 of synthetic images with volume void fraction (α). Representative
bubble images with detection results (purple solid lines) are shown for α of (b) 0.0075; (c) 0.0125; (d) 0.0250; (e)
0.0375; (f) 0.0500.
obtaining the exact individual shape from all the overlapped bubbles is not feasible in this case; thus, the ratio
of the number of bubbles detected by the model to the total number of bubbles was calculated depending on
the volume void fraction (Fig. 5(a)). Here, the results of 10 images were averaged for each corresponding void
fraction, and the representative result images were also presented to judge the operating range and performance
of the present model qualitatively (Fig. 5(b)–(f)). More than 92% of the bubbles were detected for void fractions
of up to 1%. The loss of detection slowly increased with the void fraction; however, more than 87% of the bub-
bles were detected (within 5% standard deviation), even for an intermediate void fraction of 2%. As shown in
Fig. 5(f), the bubbles are severely overlapped, even with a void fraction of 2%. The capability of the present model
to identify individual bubbles with corresponding masks among the overlapped bubbles is well demonstrated in
bubble clusters without a clear bright core (highlighted with dashed boxes in Fig. 5(e,f)). It is noted that some
Scientific Reports | (2021) 11:8940 | https://doi.org/10.1038/s41598-021-88334-0 6
Vol:.(1234567890)www.nature.com/scientificreports/
Figure 5. (a) Ratio of the number of detected bubbles (Ndetected) to the total number of bubbles in the bubble-
swarm flow images9 with volume void fraction (α). Representative bubble images with detection results (purple
solid lines) are shown for α of (b) 0.003; (c) 0.006; (d) 0.009; (e) 0.011; (f) 0.02.
image processing algorithms, as discussed previously, use the bright spot inside the bubble shadow to distinguish
an individual bubble from the cluster.
Finally, we have shown the results of bubble detection and mask extraction achieved by the present model
for different types of gas–liquid two-phase flows (Fig. 6), of which the visualization data came from our group
(published and unpublished data). The tested two-phase flow includes the bubble plume (Fig. 6(a), unpublished),
bubbly flow in a rod-bundle geometry in a nuclear power plant (Fig. 6(b), unpublished), pool boiling bubble
(Fig. 6(c), unpublished), bubble-swarm flow (Fig. 6(d), Lee and P ark9), and upward bubbly flow in an expansion
pipe (Fig. 6(e), Kim and P ark8). It should be noted that these data were not included in both the training and test
dataset. As shown, it was qualitatively demonstrated that the present model can be universally applied to diverse
two-phase flows, for the purpose of detecting and extracting an individual bubble. It is also promising to see that
the bubbles in the interaction with the solid wall, such as adhesion, bouncing, and sliding, can also be detected
(Fig. 6(b,c,e)). In the supplementary video, we further demonstrate how the extraction of exact bubble shapes
can be used to track individual bubbles in the spatiotemporally varying bubbly flows.
Saving on mask extraction time. When processing the optically obtained experimental data, computa-
tional speed is also an important issue as its accuracy. Because the conventional multiple-filter image processing
technique is now being replaced with convolutional layers in the present model, it is expected that the time
required for mask extraction would be reduced. When we use the same computing resources to test the same
images, the calculation time of the present model is two to three times shorter than that of the conventional
method. It should be noted that the bubble mask extracted by the present model is at least equivalent to or bet-
ter than the results from conventional image processing (Fig. 6). Figure 7 shows an example of the extraction
of bubble masks and a time cost comparison between the present model and the conventional method. Here,
the bubble-swarm fl ow9 of 0.9% void fraction was compared, and the Watershed transform was applied twice
repeatedly as a conventional method. As shown, the extracted bubble masks are equivalent to each other, but the
time cost (averaged for 10 images) significantly decreased to 4.4 s from 14 s taken by the Watershed transform.
Scientific Reports | (2021) 11:8940 | https://doi.org/10.1038/s41598-021-88334-0 7
Vol.:(0123456789)www.nature.com/scientificreports/
Figure 6. Bubble detection and mask extraction results for various gas–liquid two-phase flow experiments:
(a) bubble plume (JG = 0.033 × 10⁻³ m/s, de = 1.8 mm) (unpublished data); (b) bubbly flow in a rod-bundle of
nuclear power plant (JG = 0.008 m/s, JL = 0, 0.68 m/s, de = 2.8 and 2.0 mm) (unpublished data); (c) pool boiling
bubble (Tw = 104 ℃, Tl = 98 ℃, de = 3.1 mm) (unpublished data); (d) bubble-swarm flow9 (α = 0.021, de = 4.2 mm);
(e) upward bubbly flow in an expansion pipe8 (α = 0.0072, de = 3.0 mm). JG: gas flow rate, JL: liquid flow rate, de:
mean bubble equivalent diameter, Tw: wall temperature, Tl: liquid temperature, α: volume void fraction.
Figure 7. Example of the comparison of mask extraction and corresponding time consumption: (a) raw image;
(b) result of conventional image processing; (c) result of present model. The image was obtained from the
bubble-swarm flow9 with void fraction of 0.9% and has a resolution of 1248 × 976 pixels.
Concluding remarks
In the present study, we successfully developed a fully automated and universal bubble detection and shape
extraction tool by training the Mask R-CNN with an optimized dataset including experimental images of bubbly
flows and realistic synthetic bubble images (produced by BubGAN). We customized the loss function to weight
the effect of bubble size on the detection performance and enhanced the accuracy of detecting small bubbles
(APS) by 4%, thereby improving overall accuracy as well. The present model shows good universality under a
wide range of experimental conditions and high detection performance owing to dataset optimization and a
unique loss weighting system according to bubble size, which was possible based on the physical understand-
ing of bubbly flows. We also applied randomized data augmentation such as adding noise and generating black
bubbles, which helped to improve accuracy, as in other studies. As a result, the averaged precision ( AP50) for the
entire test dataset (which includes the bubble-swarm flow data not included in the training set) of the present
model reached 0.981. Furthermore, we confirmed that the present model works well on a variety of experimental
(optical setup) and flow conditions, even if the data were not included in the training dataset. Finally, the mask
extraction time was significantly reduced compared to that of the conventional image processing method. What
is remarkable here is that the present model no longer requires human intervention (trial-and-error) during the
mask extraction process, thus reducing the overall processing cost. Based on our experience while training and
testing the model, to improve the performance of the model, we suggest resizing the image to different scales
and merging the obtained masks of multiple images adjusted to different scales.
In a future work, we plan to further improve the model by combining other deep-learning-based algorithms
(e.g., deep learning optical flow) and using other bubble image features such that it can be readily applied to
Scientific Reports | (2021) 11:8940 | https://doi.org/10.1038/s41598-021-88334-0 8
Vol:.(1234567890)www.nature.com/scientificreports/
much wider experimental conditions (or harsh conditions in terms of optical configuration), such as low contrast
images, multiple fluid layers with different refractive indices, and severely high void fraction flows. Although
the present model was developed focusing on gas–liquid two-phase flows, we believe that it can be extended to
other areas where the separation of objects in optically visualized images is required, as in studies on droplet
(particle)-laden flows.
Methods
Preparing data for training. For the training and evaluation of the model, we need raw images of bubbles
with ground truth masks for each bubble. We followed the conventional image processing method for optical
gas–liquid two-phase flow experiments that our group has established5,8,9 to create the ground truth mask of the
experimental images. First, the images were binarized using a median filter and Sauvola b inarization43. Then,
44
the bright bubble core was filled using the morphological image reconstruction algorithm and denoised using
a size filter5. Next, each object in the binarized image was identified to determine whether it was an overlapped
bubble cluster or solitary bubble using a roundness c riterion14 based on the relationship between the perimeter
and area of the bubble. After the overlapped bubble clusters were identified, they were removed from both the
raw and binarized images using an in-house MATLAB code. If any overlapped bubble cluster that was indistin-
guishable by a roundness criterion still remained, it was also removed manually using the MATLAB GUI tool.
As a result, we obtained bubble images with only solitary bubbles and binary masks for each bubble in the image.
Weight for the loss function. To increase the model accuracy for small bubbles as much as that for large
bubbles, we apply the weight factor to the loss function to increase the contribution of small bubbles to the
training losses (smooth L1 loss). The customized weights are given by Eq. (1), where size denotes the bubble
equivalent diameter (db), and w is the weight effect factor, which is 0.3 in the present study.
size−1 − sizemax
−1
Global weight = −1 −1
− 0.5 w + 1 (1)
sizemin − sizemax
To apply the global weights to the loss function rather than the local weights, which only work on each itera-
tion (image), the minimum and maximum bubble sizes of all the bubbles in the training set are used. We have
empirically found that weighting only small bubbles is more effective than weighting small and large bubbles.
Received: 10 December 2020; Accepted: 7 April 2021
References
1. Stephens, D. J. & Allan, V. J. Light microscopy techniques for live cell imaging. Science 300, 82–86 (2003).
2. Xie, X. A review of recent advances in surface defect detection using texture analysis techniques. ELCVIA Electron. Lett. Comput.
Vis. Image Anal. 7, 1–22 (2008).
3. Chen, G., Weng, Q., Hay, G. J. & He, Y. Geographic object-based image analysis (GEOBIA): emerging trends and future opportuni-
ties. GIsci. Remote Sens. 55, 159–182 (2018).
4. Moen, E. et al. Deep learning for cellular image analysis. Nat. Methods 16, 1233–1246 (2019).
5. Kim, M., Lee, J. H. & Park, H. Study of bubble-induced turbulence in upward laminar bubbly pipe flows measured with a two-phase
particle image velocimetry. Exp. Fluids 57, 55 (2016).
6. Alméras, E., Mathai, V., Lohse, D. & Sun, C. Experimental investigation of the turbulence induced by a bubble swarm rising within
incident turbulence. J. Fluid Mech. 825, 1091–1112 (2017).
7. Aoyama, S., Hayashi, K., Hosokawa, S., Lucas, D. & Tomiyama, A. Lift force acting on single bubbles in linear shear flows. Int. J.
Multiphas. Flow 96, 113–122 (2017).
8. Kim, Y. & Park, H. Upward bubbly flows in a square pipe with a sudden expansion: Bubble dispersion and reattachment length.
Int. J. Multiphas. Flow 118, 254–269 (2019).
9. Lee, J. & Park, H. Bubble dynamics and bubble-induced agitation in the homogeneous bubble-swarm past a circular cylinder at
small to moderate void fractions. Phys. Rev. Fluids 5, 054304 (2020).
10. Hosokawa, S. et al. Measurement of micro bubbles generated by a pressurized dissolution method. J. Phys. Conf. Series. 147, 012016
(2009).
11. Gordiychuk, A., Svanera, M., Benini, S. & Poesio, P. Size distribution and Sauter mean diameter of micro bubbles for a Venturi
type bubble generator. Exp. Therm. Fluid Sci. 70, 51–60 (2016).
12. Fu, Y. & Liu, Y. Development of a robust image processing technique for bubbly flow measurement in a narrow rectangular chan-
nel. Int. J. Multiphas. Flow 84, 217–228 (2016).
13. Zhong, S., Zou, X., Zhang, Z. & Tian, H. A flexible image analysis method for measuring bubble parameters. Chem. Eng. Sci. 141,
143–153 (2016).
14. Lau, Y., Deen, N. & Kuipers, J. Development of an image measurement technique for size distribution in dense bubbly flows. Chem.
Eng. Sci. 94, 20–29 (2013).
15. Villegas, L. R. et al. Image processing for the experimental investigation of dense dispersed flows: application to bubbly flows. Int.
J. Multiphas. Flow 111, 16–30 (2019).
16. Jeong, H. & Park, H. Near-wall rising behaviour of a deformable bubble at high Reynolds number. J. Fluid Mech. 771, 564–594
(2015).
17. Lee, J. & Park, H. Wake structures behind an oscillating bubble rising close to a vertical wall. Int. J. Multiphas. Flow 91, 225–242
(2017).
18. Kim, N., Park, H. & Do, H. Evolution of cavitation bubble in tap water by continuous-wave laser focused on a metallic surface.
Langmuir 35, 3308–3318 (2019).
19. Maeng, H. & Park, H. An experimental study on the heat transfer by a single bubble wake rising near a vertical heated wall. Int. J.
Heat Mass Transf. 165, 120590 (2021).
Scientific Reports | (2021) 11:8940 | https://doi.org/10.1038/s41598-021-88334-0 9
Vol.:(0123456789)www.nature.com/scientificreports/
20. Stoecklein, D., Lore, K. G., Davies, M., Sarkar, S. & Ganapathysubramanian, B. Deep learning for flow sculpting: Insights into
efficient learning using scientific simulation data. Sci. Rep. 7, 46368 (2017).
21. Brunton, S. L., Noack, B. R. & Koumoutsakos, P. Machine learning for fluid mechanics. Annu. Rev. Fluid Mech. 52, 477–508 (2020).
22. Jung, H. et al. Development and evaluation of data-driven modeling for bubble size in turbulent bubbly flows using artificial
multi-layer neural networks. Chem. Eng. Sci. 213, 115357 (2020).
23. Kim, J. & Lee, C. Prediction of turbulent heat transfer using convolutional neural networks. J. Fluid Mech. 882, A18 (2020).
24. Park, J. & Choi, H. Machine-learning-based feedback control for drag reduction in a turbulent channel flow. J. Fluid Mech. 904,
A24 (2020).
25. Ye, S. et al. A flow feature detection method for modeling pressure distribution around a cylinder in non-uniform flows by using
a convolutional neural network. Sci. Rep. 10, 4459 (2020).
26. Ren, S., He, K., Girshick, R. & Sun, J. Faster R-CNN: Towards real-time object detection with region proposal networks. in Advances
in Neural Information Processing Systems. pp. 91–99 (2015).
27. Cerqueira, R. F. L. & Paladino, E. E. Development of a deep learning-based image processing technique for bubble pattern recogni-
tion and shape reconstruction in dense bubbly flows. Chem. Eng. Sci. 230, 116163 (2020).
28. Haas, T., Schubert, C., Eickhoff, M. & Pfeifer, H. BubCNN: bubble detection using Faster RCNN and shape regression network.
Chem. Eng. Sci. 216, 115467 (2020).
29. Li, J., Shao, S. & Hong, J. Machine learning shadowgraph for particle size and shape characterization. Meas. Sci. Tech. 32, 015406
(2020).
30. Torisaki, S. & Miwa, S. Robust bubble feature extraction in gas-liquid two-phase flow using object detection technique. J. Nucl.
Sci. Tech. 57, 1231–1244 (2020).
31. Poletaev, I., Tokarev, M. P. & Pervunin, K. S. Bubble patterns recognition using neural networks: Application to the analysis of a
two-phase bubbly jet. Int. J. Multiphas. Flow 126, 103194 (2020).
32. Chun-Yu, G., Yi-Wei, F., Yang, H., Peng, X. & Yun-Fei, K. Deep-learning-based liquid extraction algorithm for particle image
velocimetry in two-phase flow experiments of an object entering water. Appl. Ocean Res. 108, 102526 (2021).
33. Oktay, A. B. & Gurses, A. Automatic detection, localization and segmentation of nano-particles with deep learning in microscopy
images. Micron 120, 113–119 (2019).
34. He, K., Gkioxari, G., Dollár, P., & Girshick, R. Mask R-CNN. in Proceedings of the IEEE International Conference on Computer
Vision. pp. 2961–2969 (2017).
35. Li, Y., Qi, H., Dai, J., Ji, X., & Wei, Y. Fully convolutional instance-aware semantic segmentation. in Proceedings of the IEEE Confer-
ence on Computer Vision and Pattern Recognition. pp. 2359–2367 (2017).
36. Caicedo, J. C. et al. Nucleus segmentation across imaging experiments: the 2018 Data Science Bowl. Nat. Methods 16, 1247–1253
(2019).
37. Ali, S. et al. An objective comparison of detection and segmentation algorithms for artefacts in clinical endoscopy. Sci. Rep. 10,
2748 (2020).
38. Cho, Y. S. et al. Automated measurement of hydrops ratio from MRI in patients with Ménière’s disease using CNN-based segmen-
tation. Sci. Rep. 10, 7003 (2020).
39. Moshkov, N., Mathe, B., Kertesz-Farkas, A., Hollandi, R. & Horvath, P. Test-time augmentation for deep learning-based cell
segmentation on microscopy images. Sci. Rep. 10, 5068 (2020).
40. Fu, Y. & Liu, Y. BubGAN: Bubble generative adversarial networks for synthesizing realistic bubbly flow images. Chem. Eng. Sci.
204, 35–47 (2019).
41. Schlegel, J. P. et al. Void fraction and flow regime in adiabatic upward two-phase flow in large diameter vertical pipes. Nucl. Eng.
Des. 239, 2864–2874 (2009).
42. Hosokawa, S. & Tomiyama, A. Bubble-induced pseudo turbulence in laminar pipe flows. Int. J. Heat Fluid Flow 40, 97–105 (2013).
43. Sauvola, J. & Pietikäinen, M. Adaptive document image binarization. Pattern Recognit. 33, 225–236 (2000).
44. Soille, P. Morphological image analysis: principles and applications (Springer, 2013).
Acknowledgements
This work was supported by research grant (2020R1A2C2014510) through the National Research Foundation
(NRF) of Korea, funded by the Korean government (MSIT) via SNU-IAMD.
Author contributions
Y.K. and H.P. developed the problem and designed the research project. Y.K. conducted the optimization of
the training and evaluation of the algorithm. Y.K. and H.P. contributed to the writing and development of the
manuscript.
Competing interests
The authors declare no competing interests.
Additional information
Supplementary Information The online version contains supplementary material available at https://doi.org/
10.1038/s41598-021-88334-0.
Correspondence and requests for materials should be addressed to H.P.
Reprints and permissions information is available at www.nature.com/reprints.
Publisher’s note Springer Nature remains neutral with regard to jurisdictional claims in published maps and
institutional affiliations.
Scientific Reports | (2021) 11:8940 | https://doi.org/10.1038/s41598-021-88334-0 10
Vol:.(1234567890)www.nature.com/scientificreports/
Open Access This article is licensed under a Creative Commons Attribution 4.0 International
License, which permits use, sharing, adaptation, distribution and reproduction in any medium or
format, as long as you give appropriate credit to the original author(s) and the source, provide a link to the
Creative Commons licence, and indicate if changes were made. The images or other third party material in this
article are included in the article’s Creative Commons licence, unless indicated otherwise in a credit line to the
material. If material is not included in the article’s Creative Commons licence and your intended use is not
permitted by statutory regulation or exceeds the permitted use, you will need to obtain permission directly from
the copyright holder. To view a copy of this licence, visit http://creativecommons.org/licenses/by/4.0/.
© The Author(s) 2021
Scientific Reports | (2021) 11:8940 | https://doi.org/10.1038/s41598-021-88334-0 11
Vol.:(0123456789)You can also read