Bayona, J. A., Savran, W., Strader, A., Hainzl, S., Cotton, F., Schorlemmer, D. (2021): Two global ensemble seismicity models obtained from the ...
←
→
Page content transcription
If your browser does not render page correctly, please read the page content below
Bayona, J. A., Savran, W., Strader, A., Hainzl, S.,
Cotton, F., Schorlemmer, D. (2021): Two global
ensemble seismicity models obtained from the
combination of interseismic strain measurements
and earthquake-catalogue information. -
Geophysical Journal International, 224, 3,
1945-1955.

https://doi.org/10.1093/gji/ggaa554

Institional Repository GFZpublic: https://gfzpublic.gfz-potsdam.de/
Geophys. J. Int. (2021) 224, 1945–1955                                                                                       doi: 10.1093/gji/ggaa554
Advance Access publication 2020 November 20
GJI Seismology

Two global ensemble seismicity models obtained from the
combination of interseismic strain measurements and
earthquake-catalogue information

                                                                                                                                                        Downloaded from https://academic.oup.com/gji/article/224/3/1945/5996192 by Bibliothek des Wissenschaftsparks Albert Einstein user on 17 February 2021
J.A. Bayona,1,2,* W. Savran,3 A. Strader,1 S. Hainzl,1,2 F. Cotton1,2 and D. Schorlemmer1
1 GFZ  German Research Centre for Geosciences, Telegrafenberg, 14473 Potsdam, Germany. E-mail: jose.bayona@bristol.ac.uk
2 Institute
          of Geosciences, University of Potsdam, Karl-Liebknecht-Str. 24-25, 14476 Potsdam-Golm, Germany
3 Southern California Earthquake Center, University of Southern California, 90089-0742 Los Angeles, CA, USA

Accepted 2020 November 8. Received 2020 October 13; in original form 2020 May 20

                                        SUMMARY
                                        Global seismicity models provide scientific hypotheses about the rate, location and magni-
                                        tude of future earthquakes to occur worldwide. Given the aleatory variability of earthquake
                                        activity and epistemic uncertainties in seismicity forecasting, the veracity of these hypothe-
                                        ses can only be confirmed or rejected after prospective forecast evaluation. In this study, we
                                        present the construction of and test results for two updated global earthquake models, aimed
                                        at providing mean estimates of shallow (d ≤ 70 km) seismicity for seismic hazard assess-
                                        ment. These approaches, referred to as the Tectonic Earthquake Activity Model (TEAM) and
                                        the World Hybrid Earthquake Estimates based on Likelihood scores (WHEEL) model, use
                                        the Subduction Megathrust Earthquake Rate Forecast (SMERF2), an earthquake-rate model
                                        for subduction zones constrained by geodetic strain measurements and earthquake-catalogue
                                        information. Thus, these global ensemble seismicity models capture two independent com-
                                        ponents necessary for long-term earthquake forecasting, namely interseismic crustal strain
                                        accumulation and sudden lithospheric stress release. The calibration period for TEAM and
                                        WHEEL extends from 1977 January 1 to 2013 December 31. Accordingly, we use m ≥ 5.95
                                        earthquakes recorded during the 2014–2019 period to pseudo-prospectively evaluate the fore-
                                        casting skills of these earthquake models, and statistically compare their performances to that
                                        of the Global Earthquake Activity Rate (GEAR1) model. As a result, GEAR1 and WHEEL
                                        are the most informative global seismicity models during the pseudo-prospective test period,
                                        as both rank with the highest information scores among all participant earthquake-rate fore-
                                        casts. Nonetheless, further prospective evaluations are required to more accurately assess the
                                        abilities of these global ensemble seismicity models to forecast long-term earthquake activity.
                                        Key words: Probabilistic forecasting; Earthquake interaction, forecasting and prediction;
                                        Seismicity and tectonics; Statistical seismology.

                                                                             any seismicity model (Taroni et al. 2014). However, a drawback of
1 I N T RO D U C T I O N
                                                                             prospective forecast tests is the time that one might have to wait to
Until recently, there has been some skepticism within the earthquake         sample a statistically representative number of large events, given
and engineering community about the capacity of earthquake-rate              the usual level of global activity. Hence, multiple efforts have been
models to reliably characterize seismicity patterns. This lack of            made to reduce prospective forecast evaluation periods by expand-
credulity primarily stems from the strongly stochastic nature of             ing earthquake forecasting areas, which has led to the generation of
earthquakes and the relatively limited disposal of target data to inde-      global seismicity models. As a result, global m ≥ 5.8 earthquake
pendently calibrate and test seismicity models (Werner et al. 2011).         forecasts offer prospective test results that can be obtained in only
Accordingly, only prospective forecast evaluations are considered            1–8 yr (Bird et al. 2015).
rigorous enough to objectively describe the forecasting skills of               Short- and long-term global earthquake forecasts rely on homog-
                                                                             enized seismicity catalogues, which currently provide hypocentral
                                                                             locations and magnitude estimates for thousands of earthquakes
∗Now at: School of Earth Sciences, University of Bristol, Queens Road, BS8   around the world. The Kagan–Jackson smoothed-seismicity (KJSS;
1QU Bristol, United Kingdom

C The Author(s) 2020. Published by Oxford University Press on behalf of The Royal Astronomical Society. All rights reserved. For
permissions, please e-mail: journals.permissions@oup.com
                                                                                                                                                1945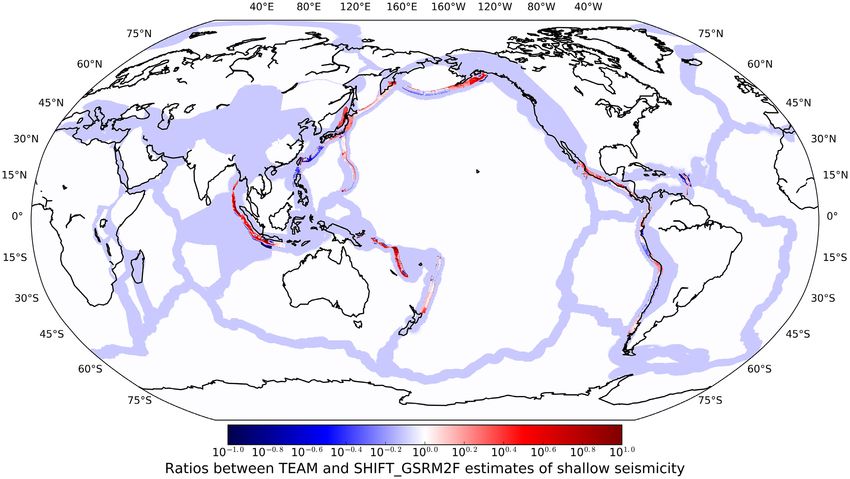
1946       J.A. Bayona et al.

Kagan & Jackson 2011) model, for instances, averages out the ex-          to the global rate of observed seismicity according to the 1977–
ceedance rates of 30 000 earthquakes reported in the 1977–2008            2004 global CMT catalogue, max stands for the maximum value,
global centroid moment tensor Project (CMT; Dziewonski et al.             Sij denotes the smoothed seismicity KJSS parent forecast, d is an
1981; Ekström et al. 2012) and the preliminary determinations of         optimization parameter to be determined, Tij refers to the tectonic
epicentres (PDE) seismicity catalogues to estimate global earth-          SHIFT GSRM2f earthquake component and f symbolizes a baseline
quake activity. Moreover, this model smoothes the location of each        seismicity rate defined as the min[min(Sij ), min(Tij )]. The optimized
tectonic event with an anisotropic kernel function and uses a tapered     combination between parent forecast components for GEAR1 was

                                                                                                                                                     Downloaded from https://academic.oup.com/gji/article/224/3/1945/5996192 by Bibliothek des Wissenschaftsparks Albert Einstein user on 17 February 2021
Gutenberg–Richter relation to compute the spatial and magnitude           determined by maximizing the I1 (success) information score of
distributions of forecasted seismicity. Thus, KJSS provides earth-        Kagan (2009) from actual 2005–2012 seismicity. In this manner,
quake rate densities per unit area, time and magnitude that depend        Bird et al. (2015) found that the most informative GEAR1 forecast
exclusively on instrumentally recorded seismicity.                        is derived from a multiplicative combination of parent components,
   The increasing availability of geodetic measurements along plate       with exponent d = 0.6 on KJSS (Seismicity) and 1 − d = 0.4 on
boundaries over the last two decades has enabled the creation of          SHIFT GSRM2f (Tectonics). Based on this, the GEAR1 modellers
high-resolution models of plate motion and strain rate, which can         enhanced the preferred hybrid seismicity model by recomputing
be translated in present day into global maps of predicted seis-          the Seismicity and Tectonics parent forecasts using the complete
micity. The Seismic Hazard Inferred from Tectonics based on the           1977–2013 global CMT catalogue. As a result, the update of such a
Global Strain Rate Map (SHIFT GSRM, Kreemer et al. 2003;                  preferred hybrid earthquake-rate model is what they refer to as the
Bird & Liu 2007; Bird et al. 2010) model converts interseismic            GEAR1 seismicity forecast.
strain rates into long-term rates of seismic moment using global             GEAR1 and its individual components were submitted to the
‘geodesy-to-seismicity’ parameters, such as fault-dipping angles,         Collaboratory for the Study of Earthquake Predictability (CSEP;
coupled seismogenic thicknesses and elastic shear moduli (i.e.            Jordan, 2006; Schorlemmer & Gerstenberger 2007; Zechar et al.
Bird & Kagan, 2004). Depending on the coupling, or the frac-              2010) testing centre for independent evaluation. According to 2-yr
tion of geodetic moment to be seismically released, seismicity rates      prospective test results, GEAR1 significantly outperforms both of its
are thereupon obtained by assuming a tapered Gutenberg–Richter            parent forecasts, providing preliminary support to combine geode-
frequency–magnitude distribution, which varies spatially among            tic strain rates with smoothed-seismicity data for long-term earth-
different tectonic regimes. According to retrospective test results       quake forecasting (Strader et al. 2018). In particular, the total earth-
for the 1977–2009 evaluation period, the raw SHIFT GSRM fore-             quake number, spatial and magnitude distributions forecasted by
cast is consistent with the observations in continental convergent        GEAR1 were all consistent with observed seismicity. Nonetheless,
boundaries. Nevertheless, it significantly underpredicts earthquake       both geodetic-based models SHIFT GSRM and SHIFT GSRM2f
rates in subduction zones, presumably due to geometrical effects          failed the spatial evaluation, in spite of the high spatial strain-rate
inappropriately captured by the global average subduction dip an-         resolution offered by GSRM and GSRM2.1.
gle employed in the formulation. Thus, the SHIFT GSRM authors                During the 20th century, subduction interface seismicity released
empirically corrected the forecast as the last step in constructing       almost 90 per cent of the global seismic moment rate, and com-
this seismicity model.                                                    prised approximately 60 per cent of the earthquake activity observed
   A few years later, Bird & Kreemer (2015) presented a revised           worldwide (Pacheco & Sykes 1992; Bird et al. 2010). Based on this,
version of SHIFT GSRM: the SHIFT GSRM2f earthquake model.                 Bayona-Viveros et al. (2019) constructed the Subduction Megath-
SHIFT GSRM2f is based on the updated Global Strain Rate Map               rust Earthquake Rate Forecast (SMERF) as a complementary ap-
(GSRM2.1; Kreemer et al. 2014), a global velocity gradient tensor         proach to the raw SHIFT GSRM and SHIFT GSRM2f forecasts to
field and continuous strain-rate model obtained from 22 415 GPS in-       improve their forecasted number, and potentially spatial, distri-
terseismic velocities. Among other improvements, SHIFT GSRM2f             butions in subduction zones. Similar to SHIFT GSRM2f, SMERF
incorporates a spatial smoothing of model strain rates around off-        computes long-term budgets of seismic moment from interseismic
shore plate boundaries to provide high-resolution estimates of earth-     strain rates and instrumentally recorded seismicity. Nevertheless,
quake activity. However, the uncorrected SHIFT GSRM2f fore-               SMERF uses regional—not global—geodesy-to-seismicity conver-
cast underestimates global earthquake rates during the 2005–2012          sion parameters to account for the great diversity of earthquake
retrospective evaluation period, mainly due to underpredictions of        patterns among subduction margins (i.e. Heuret et al. 2011; Kagan
subduction-zone seismicity. As a result, the SHIFT GSRM2f mod-            & Jackson 2016). As a result, SMERF holds the initial capacity
ellers applied empirical calibration factors to improve the forecast in   to properly forecast subduction-zone seismicity, according to retro-
subduction zones by assuming that discrepancies between this new          spective and pseudo-prospective number-test results for the 1977–
earthquake-rate forecast and the observations are primarily derived       2014 and 2015–2018 evaluation periods. A limitation of SMERF,
from the absence of specific fault-dipping angles in the moment-rate      however, is the relatively large number of seismicity parameters it
balance equation.                                                         needs to be constructed and the limited availability of earthquake-
   SHIFT GSRM2f was then combined with KJSS to generate the               catalogue information to individually calibrate them. Hence, we
Global Earthquake Activity Rate (GEAR1; Bird et al. 2015) model.          present in this study, a revised version of SMERF that depends
Specifically, GEAR1 results from a multiplicative log-linear blend        on a reduced amount of earthquake parameters, referred to as the
of smoothed-earthquake data and geodetic strain rates, expressed          SMERF2 model. Moreover, we integrate SMERF2 estimates in sub-
as:                                                                       duction zones with SHIFT GSRM2f computations outside of these
                                                                        tectonic convergent margins to produce the global Tectonic Earth-
Hi j = c · max (Sidj · Ti1−d
                         j   ), f .                                (1)    quake Activity Model (TEAM). Furthermore, we combine KJSS
                                                                          with this updated tectonic earthquake model to create the World Hy-
  In this equation, Hij represents the hybrid seismicity forecast in      brid Earthquake Estimates based on Likelihood scores (WHEEL)
each grid cell centred on longitude i and latitude j, c is a nor-         model; an alternative hybrid seismicity approach to GEAR1. Fi-
malization factor adjusting the global predicted earthquake rate          nally, we use d ≤ 70 km, m ≥ 5.95 earthquakes recorded during the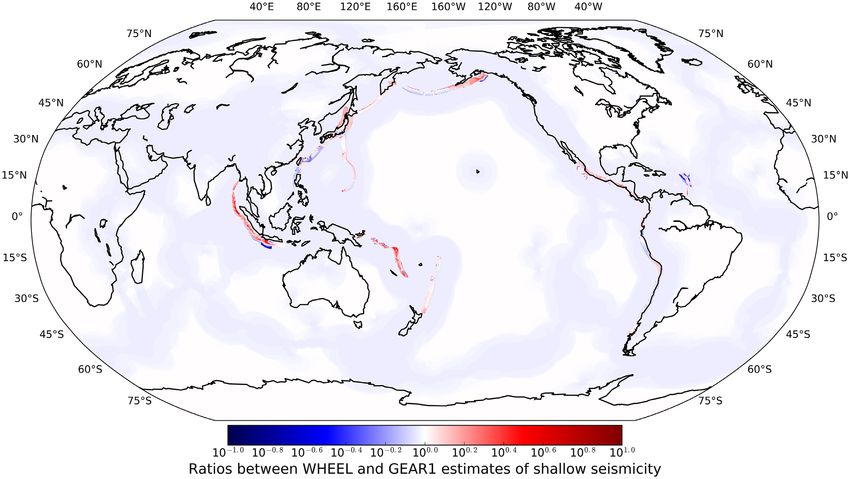
Two global ensemble seismicity models          1947

                    Table 1. Mean estimates of seismic coupling coefficient cH for 14 (Kagan & Jackson 2016) subduction interfaces.
                    Number        Heuret’s subduction zone                  KJ’s subduction zone                        cH
                        1         Northern Tonga                            Kermadec-Tonga-Samoa                        0.12
                                  Southern Tonga                                                                    [0.10–0.14]
                                  Northern Kermadec
                                  Southern Kermadec
                    2             Southern New-Hebrides                    New Hebrides Is.                            0.82

                                                                                                                                                      Downloaded from https://academic.oup.com/gji/article/224/3/1945/5996192 by Bibliothek des Wissenschaftsparks Albert Einstein user on 17 February 2021
                                  D’Entrecasteux                                                                    [0.56–1.00]
                                  Northern New-Hebrides
                    3             Solomon                                  Bismarck-Solomon Is.                         0.56
                                  Bougainville                                                                      [0.38–0.83]
                                  New Britain
                    4             Java                                      Sunda Arc                                   0.16
                                                                                                                    [0.11–0.22]
                    5             Sumatra                                  Andaman Is.-Sumatra                          0.16
                                  Andaman                                                                           [0.12–0.21]
                    6             Taiwan-Manila                             Taiwan                                      0.21
                                                                                                                    [0.15–0.30]
                    7             Southern Ryukyu                          S.E. Japan-Ryukyu Is.                        0.26
                                  Northern Ryukyu                                                                   [0.18–0.37]
                                  Nankai
                    8             Tohoku                                   Japan-Kamchatka                              0.47
                                  Southern Kuril                                                                    [0.33–0.66]
                                  Northern Kuril
                                  Kamchatka
                    9             Marianas                                  Guam-Japan                                  0.10
                                  Izu-Bonin                                                                         [0.09–0.12]
                    10            Southwestern Aleutians                   Alaska-Aleutian Arc                          0.36
                                  Central Aleutians                                                                 [0.26–0.50]
                                  Eastern Aleutians
                                  Western Alaska
                                  Eastern Alaska
                    11            Mexico                                   Mexico-Guatemala                             0.47
                                  Cocos                                                                             [0.32–0.70]
                    12            Costa Rica                                Central America                             0.21
                                  Colombia-Ecuador                                                                  [0.15–0.30]
                    13            Antilles                                  Caribbean Loop                              0.17
                                                                                                                    [0.11–0.24]
                    14            Northern Peru                            Andean S.America                             0.79
                                  Southern Peru                                                                     [0.52–1.00]
                                  Northern Chile
                                  Southern Chile
                    Notes: Based on eq. (14) in Bayona-Viveros et al. (2019), we empirically calibrate these values to construct the
                    SMERF2 seismicity model; In bold, we present mean estimates of seismic coupling coefficient cH; In square
                    brackets, we report uncertainties associated with cH computations.

2014–2019 period to pseudo-prospectively evaluate the consistency              of degrees of freedom, specifically regional seismic coupling co-
of these global ensemble seismicity models with the observations,              efficients, to be individually constrained by available earthquake-
and quantitatively compare their forecasting skills with GEAR1,                catalogue data. Therefore, we present a revised version of SMERF
our benchmark global earthquake-rate model.                                    that depends on a reduced number of seismicity parameters, re-
                                                                               ferred to as the SMERF2 model. Same as SMERF, SMERF2 uses
                                                                               the trench segmentation model of Heuret et al. (2011) to assign geo-
                                                                               metric parameters, such as seismogenic thicknesses, trench lengths
2 NEW SEISMICITY MODELS                                                        and fault-dipping angles to 37 subduction areas. Nonetheless, this
                                                                               updated model version employs only one average elastic shear mod-
2.1 The updated Subduction Megathrust Earthquake                               ulus μ̄s = 68 GPa for subduction interfaces, derived from the re-
Rate Forecast                                                                  sults of Bayona-Viveros et al. (2019). Moreover, SMERF2 utilizes
One of the most basic ways that SMERF differs from                             the subduction segmentation model of Kagan & Jackson (2016) to
SHIFT GSRM2f is that SMERF identifies 37 subduction margins,                   re-calibrate mean regional seismic coupling coefficients cH from
according to variations of seismicity parameters (i.e. Heuret et al.           estimates of corner magnitude computed for each subduction zone
2011; Kagan & Jackson 2016). In contrast, SHIFT GSRM2f dis-                    in such a study. For this aim, we group together some of the Heuret
tinguishes one subduction zone from other tectonic plate bound-                et al. (2011) subduction zones (e.g. Northern Peru, Southern Peru,
aries based on discontinuities of relative plate velocity (i.e. Bird           Northern Chile and Southern Chile) to relate them to the Kagan &
et al. 2009). Thus, SMERF possesses a relatively large number                  Jackson (2016) subduction segments (e.g. Andean S. America). As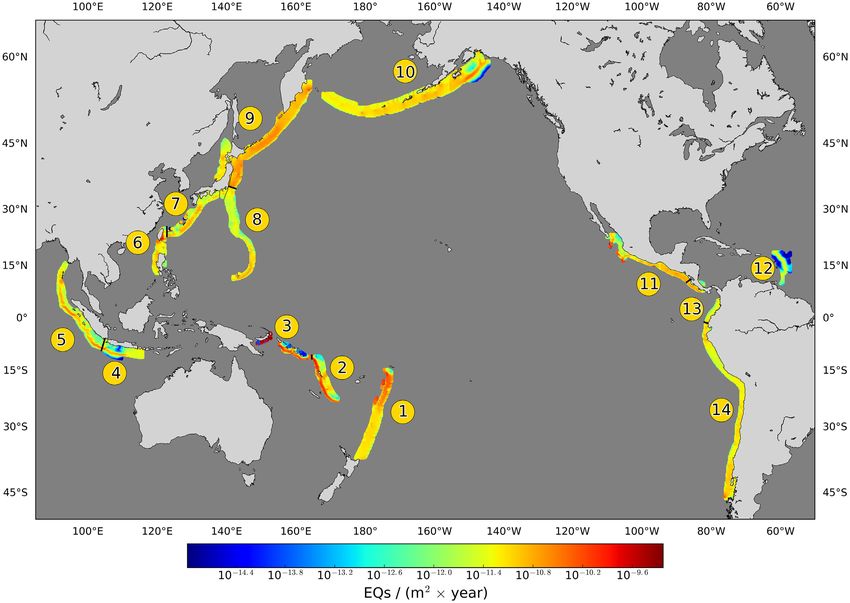
1948 J.A. Bayona et al.
Downloaded from https://academic.oup.com/gji/article/224/3/1945/5996192 by Bibliothek des Wissenschaftsparks Albert Einstein user on 17 February 2021
Figure 1. Mean annual density rates of shallow d ≤ 70 km, m ≥ 5.95 interface seismicity, provided by the updated SMERF2.
a result, SMERF2 reduces the number of mean seismic coupling 2.3 The World Hybrid Earthquake Estimates based on
coefficients from 37 to 14 (see Table 1) to provide high-resolution Likelihood scores model
estimates of subduction-zone seismicity (see Fig. 1).
We finally blend the new TEAM seismicity model with KJSS to cre-
ate the WHEEL model. Same as GEAR1, this hybrid earthquake-
rate model uses a multiplicative log-linear combination of earth-
2.2 The Tectonic Earthquake Activity Model quake parent components, with exponent d = 0.6 on the Seismicity
forecast (KJSS) and 1 − d = 0.4 on the Tectonic constituent (now
Strictly speaking, SHIFT GSRM2f and SMERF2 are hybrid seis- TEAM). As a result, WHEEL serves as an alternative approach to
micity models, because both unavoidably employ earthquake infor- GEAR1 to compute global earthquake activity, with special focus
mation to translate geodetic strain rates into high-resolution esti- on subduction-zone seismicity (see Figs 4 and 5).
mates of shallow seismicity. Particularly, the predicted number of
earthquakes is calibrated from observed seismicity, and the spatial
earthquake distribution is provided by interseismic strain measure-
3 E A RT H Q UA K E M O D E L E VA L UAT I O N S
ments. Nonetheless, we assume SHIFT GSRM2f and SMERF2 in
this work to be geodetic-based earthquake models. Thus, we com- SHIFT GSRM2f, KJSS, GEAR1, TEAM and WHEEL provide sci-
bine SMERF2 computations of subduction-zone seismicity with entific hypotheses about where and how frequently earthquakes can
SHIFT GSRM2f estimates of earthquake activity outside of the occur (see Table 2). Nonetheless, the veracity of these hypotheses
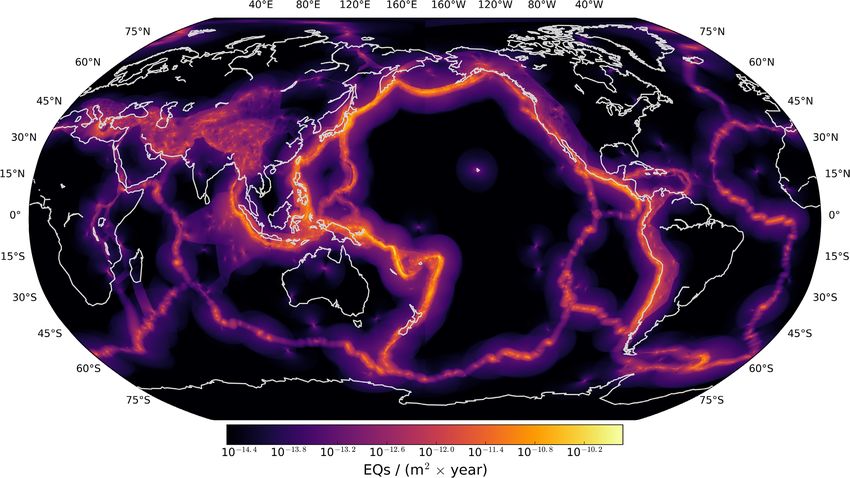
SMERF2 subduction margins to generate the global TEAM (see can only be confirmed or rejected after prospective forecast exper-
Figs 2 and 3). To achieve it, we first preserve the annual earth- iments. In this study, we evaluate the initial consistency of these
quake rate for subduction zones predicted by SMERF2, as seismic global seismicity forecasts with observations recorded during the
coupling coefficients cH employed in its formulation are empirically 2014 January 1–2019 December 31 pseudo-prospective test pe-
calibrated from actual 1977–2013 interface seismicity (see eq. 14 in riod. Moreover, we statistically compare the performance of each
Bayona-Viveros et al. 2019). Then, we multiply SHIFT GSRM2f participant global earthquake approach with GEAR1, our selected
earthquake rate densities in non-SMERF2 subduction areas by a benchmarck seismicity model. To do so, we first divide the global
factor of approximately 0.8 to adjust the mean global rate to ap- study region into spatio-magnitude bins with increments of 0.1 units
proximately 176 m ≥ 5.767 earthquakes per year, provided by the in longitude, latitude and magnitude. Within each bin, we then spec-
1977–2013 global CMT catalogue. ify expected numbers of earthquakes during the evaluation period,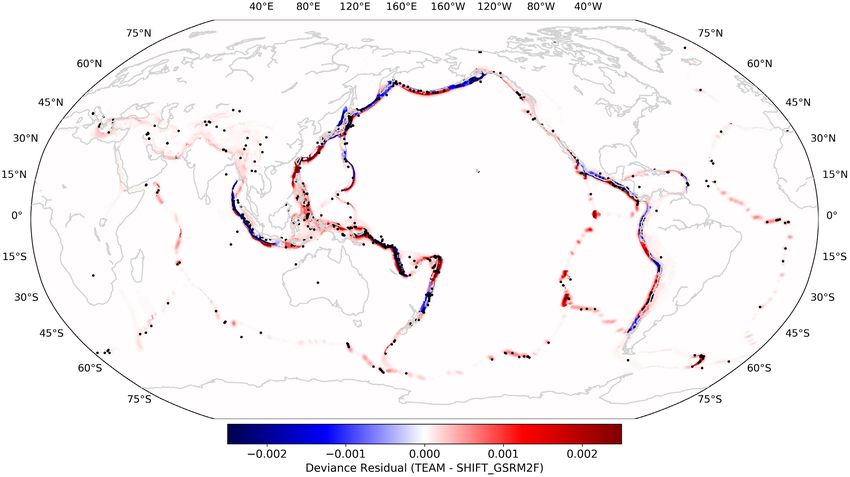
Two global ensemble seismicity models              1949

                                                                                                                                                        Downloaded from https://academic.oup.com/gji/article/224/3/1945/5996192 by Bibliothek des Wissenschaftsparks Albert Einstein user on 17 February 2021
Figure 2. Forecast map showing annual d ≤ 70 km, m ≥ 5.95 earthquake rate densities (per m2 ), derived from the global TEAM.

Figure 3. Variations in m ≥ 5.95 annual earthquake rate densities forecasted by TEAM and SHIFT GSRM2f. In red regions, TEAM estimates a larger number
of earthquakes per year than SHIFT GSRM2f. On the contrary, blue points denote locations where SHIFT GSRM2f computes larger seismicity rates than
TEAM.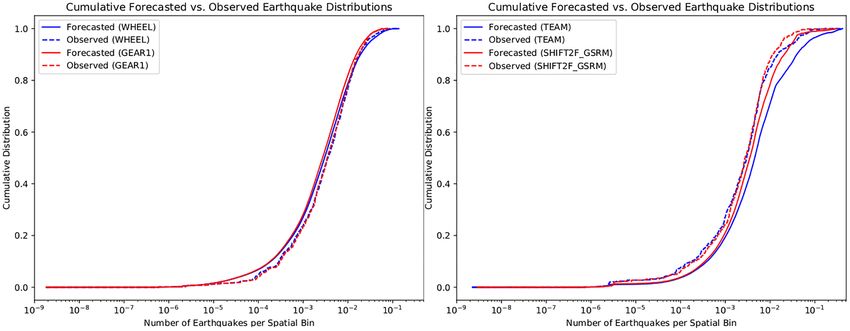
1950 J.A. Bayona et al.
Downloaded from https://academic.oup.com/gji/article/224/3/1945/5996192 by Bibliothek des Wissenschaftsparks Albert Einstein user on 17 February 2021
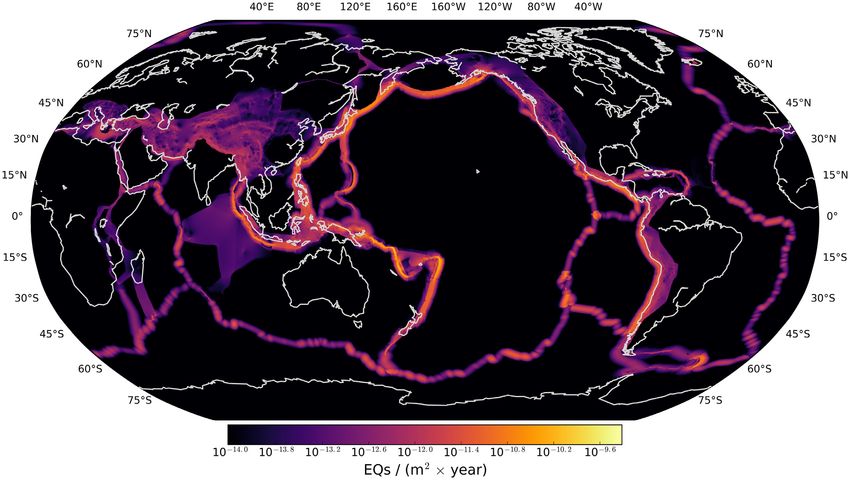
Figure 4. Mean estimates of annual d ≤ 70 km, m ≥ 5.95 earthquake rate densities (per m2 ), computed by the WHEEL model.
Figure 5. Variations in m ≥ 5.95 annual seismicity rates forecasted by the WHEEL and GEAR1 earthquake models. In red, WHEEL estimates a larger number
of earthquakes than GEAR1. In blue, oppositely, GEAR1 computes larger seismicity rates than WHEEL.
which are assumed to be Poisson distributed (Schorlemmer et al. 3.1 Comparative tests
2007; Zechar, Gerstenberger & Rhoades 2010). Also, we implement
We evaluate the relative performance of forecast pairs by measuring
the comparative and consistency tests described below to assess the
the rate-corrected information gain per earthquake of one forecast
forecasting capacities of contestant global seismicity models.
over another (Rhoades et al. 2011). For each global forecast pair,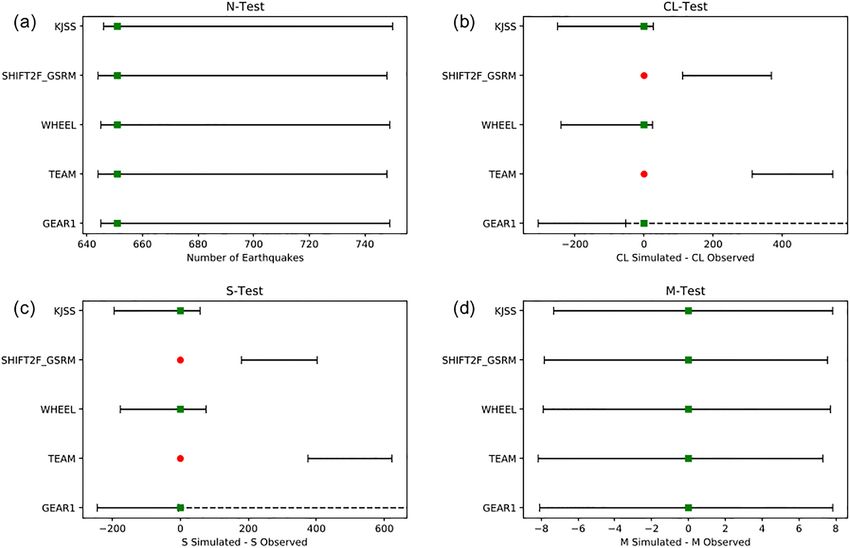
Two global ensemble seismicity models              1951

Table 2. Summary of seismicity models described in this study. In bold, we highlight global earthquake-rate forecasts undergoing pseudo-prospective
evaluation. We do not include SHIFT GSRM, as SHIFT GSRM2f is its successor earthquake-rate model.
Model                            Nature             Coverage                   Based on                             Reference
SHIFT GSRM                       Tectonic           Global                     GSRM and CMT catalogue               Bird et al. (2010)
KJSS                             Seismicity         Global                     CMT catalogue                        Kagan & Jackson (2011)
SHIFT GSRM2f                     Tectonic           Global                     GSRM2.1 and CMT catalogue            Bird & Kreemer (2015)
GEAR1                            Hybrid             Global                     KJSS and SHIFT GSRM2f                Bird et al. (2015)

                                                                                                                                                        Downloaded from https://academic.oup.com/gji/article/224/3/1945/5996192 by Bibliothek des Wissenschaftsparks Albert Einstein user on 17 February 2021
SMERF                            Tectonic           Subduction zones           GSRM2.1 and CMT catalogue            Bayona-Viveros et al. (2019)
SMERF2                           Tectonic           Subduction zones           GSRM2.1 and CMT catalogue            This issue
TEAM                             Tectonic           Global                     SMERF2 and SHIFT GSRM2f              This issue
WHEEL                            Hybrid             Global                     KJSS and TEAM                        This issue

                                                                               distribution, used to evaluate the consistency of forecasted seismic-
                                                                               ity patterns with observed earthquakes (Schorlemmer et al. 2010).
                                                                               Greater log-likelihood scores indicate greater consistency, corre-
                                                                               sponding to a higher probability of the forecast generating a seis-
                                                                               micity distribution similar to observations. This in turn implies a
                                                                               greater ability of the seismicity model to forecast earthquakes.
                                                                                  Consistency with observed seismicity, expressed as the log-
                                                                               likelihood score, can be decomposed into three dimensions: number
                                                                               of earthquakes, magnitude and spatial distributions. So, we apply
                                                                               tests of consistency for each of these dimensions (N-, M- and S-
                                                                               tests, respectively), which are directly derived from the likelihood,
                                                                               or L-test (Zechar et al. 2010). A forecast’s log-likelihood score is
                                                                               most impacted by the number of earthquakes. Therefore, we also
                                                                               apply the conditional likelihood (CL) test, which provides infor-
                                                                               mation about a forecast’s spatial and magnitude distribution while
Figure 6. Comparative T-test results for contestant global seismicity models
                                                                               removing information regarding the total number of earthquakes
during the 2014–2019 pseudo-prospective evaluation period. We present
the mean information gain per earthquake as circles, and the 95 per cent
                                                                               (Werner et al. 2011).
confidence interval with vertical lines. GEAR1 and WHEEL are the most
informative models among all participant earthquake-rate approaches, as
both rank with the highest information gain scores. Although not displayed,    4 R E S U LT S A N D D I S C U S S I O N
W-test results corrobate all T-tests.
                                                                               T-test results show that GEAR1 and WHEEL are the most informa-
                                                                               tive seismicity forecasts during the 2014–2019 pseudo-prospective
we apply the Student’s paired T-test. This comparative test is based
                                                                               evaluation period, as they possess the highest information gain
on the null hypothesis that two forecasts perform similarly, and the
                                                                               scores among all participant earthquake-rate forecasts (see Fig. 6
alternate hypothesis that one forecast significantly outperforms the
                                                                               and Table 3). In agreement with Strader et al. (2018), the outper-
other. As a result, one forecast is considered more informative than
                                                                               formance of these hybrid seismicity models over their individual
the other if the mean information gain significantly differs from the
                                                                               forecast parent components indicate that the combination of in-
scaled difference in forecasted earthquake numbers between two
                                                                               strumentally recorded seismicity and geodetic strain information is
forecasts.
                                                                               suitable for long-term earthquake modelling. As formerly explained,
   If the number of target earthquakes is large, the T-test relies on the
                                                                               the multiplicative log-linear blend of seismicity forecasts is based
approximate normality of the mean of the information gain scores
                                                                               on the maximization of the Kagan (2009) I1 success information
at observed earthquake locations, which is guaranteed by the central
                                                                               score during the 2005–2012 retrospective period. Thus, compar-
limit theorem. In contrast, for small a number of target earthquakes,
                                                                               ative T-test results support the selection of the preferred GEAR1
the Student’s paired T-test requires the assumption that the infor-
                                                                               model over a similar test period, suggest its stability over time, as
mation gain scores at observed earthquake locations are normally
                                                                               described by Bird (2018), and serve as new evidence to promote
distributed. In this case, the non-parametric W-test, evaluating the
                                                                               the creation and development of ensemble seismicity models, as
median information gain per earthquake rather than the mean, needs
                                                                               concluded by Marzocchi et al. (2012) and Akinci et al. (2018).
to be applied to strengthen a T-test result. This test only requires
                                                                                  Comparative T-test results also exhibit that KJSS exceeds the
that the information gain distribution is symmetric, and increases in
                                                                               forecasting skills of TEAM and SHIFT GSRM2f during the 6-yr
power with increasing numbers of observed earthquakes (Rhoades
                                                                               pseudo-prospective assessment period. Additionally, we observe
et al. 2011).
                                                                               that TEAM and SHIFT GSRM2f are equally informative during
                                                                               the same testing period, as the difference between their information
                                                                               gain scores is statistically insignificant. Nonetheless, these latter
3.2 Consistency tests
                                                                               seismicity models might perform better than KJSS in the long term
Using a suite of likelihood consistency tests, we evaluate the con-            due to the incorporation of interseismic strain data into their formu-
sistency of forecasted and observed seismicity during the exper-               lations. Plate motion is assumed to lead to constant strain rates that
iment’s testing period. These tests are based on the likelihood of             can be estimated over fairly short interseismic time periods assum-
observed seismicity patterns, given forecasted earthquake numbers.             ing stationary coupling properties (Haines & Holt 1993; Savage &
A forecast’s log-likelihood score is a metric, based on the Poisson            Simpson 1997; Kreemer et al. 2014). The earthquake probabilities
1952 J.A. Bayona et al.
Table 3. Pseudo-prospective N-, M-, S- and CL-test statistics for participant global seismicity models.
Model δ1 δ2 κ ζ ξ IG (over GEAR1)
GEAR1 0.96 0.04 0.55 1.00 1.00 0.00
WHEEL 0.96 0.04 0.57 0.98 1.00 0.01 [-0.02 – 0.04]
KJSS 0.96 0.04 0.50 0.98 1.00 -0.14 [-0.22 – -0.09]
SHIFT GSRM2f 0.96 0.05 0.59 0.00 0.00 -0.45 [-0.55 – -0.32]
TEAM 0.96 0.05 0.62 0.00 0.00 -0.44 [-0.56 – -0.31]
Downloaded from https://academic.oup.com/gji/article/224/3/1945/5996192 by Bibliothek des Wissenschaftsparks Albert Einstein user on 17 February 2021
Notes: The N-test metrics δ 1 and δ 2 describe the probabilities of observating at least and at most the actual
number of earthquakes, respectively. If δ 1 < 0.025, the forecast significantly underpredicts observed seismicity;
if δ 2 < 0.025, the forecast importantly overestimates actual seismicity; if δ 1 > 0.025 and δ 2 > 0.025 the forecast
is consistent with the observations. The magnitude κ, spatial ζ , and magnitude-spatial ξ statistics provide the
percentage of simulated seismicity catalogues, derived from each earthquake model, with a lower log-likelihood
score than the score computed for the observed earthquake catalogue. At a 0.05 confidence level, if these metrics
are greater than 0.025, the forecasted seismicity distributions are consistent with actual earthquake activity. Thus,
we indicate in bold values inconsistencies of earthquake-rate forecasts with the observations. Finally, we display
information gain scores per event IG and confidence intervals (in brackets) over GEAR1, obtained for each
contestant earthquake model during the 2014–2019 pseudo-prospective test period.
Figure 7. Consistency evaluation results for participant global earthquake-rate models during the 2014 January 1–2019 December 31 pseudo-prospective
testing period. We show (a) N-, (b) CL-, (c) S- and (d) M-test results. Green squares indicate that earthquake forecasts are consistent with the observations. In
contrast, red circles denote that models forecast earthquake patterns inconsistent with actual seismicity. Horizontal lines stand for the 95 per cent confidence
intervals. Dashed lines represent the one-sided form of the test distribution. Thus, seismicity models with a quantile score greater than the distribution upper
limit are not rejected. For the N-test, the x-axis exhibits the number of earthquakes. For all other evaluations, the x-axis displays log-likehihood scores.
are expected to be proportional to the stress rates which, in turn, can describe the forecasting potential of these global geodetic-based
be related to the estimated strain rates. Thus, geodetic-based seis- earthquake models.
micity models like TEAM and SHIFT GSRM2f can be expected to N-test results reveal that all global seismicity forecasts are con-
represent the long-term probabilities better than earthquake-based sistent with observations recorded during the 2014–2019 evaluation
models like KJSS, which attempt to estimate probabilities based on period (see Fig. 7). This is important, as the N-test is the most pow-
relatively limited earthquake-catalogue information. Accordingly, erful consistency test implemented in CSEP, but it is unsurprising
we recommend further prospective evaluations to more accurately because all contestant global forecasts were normalized to computeTwo global ensemble seismicity models 1953
Downloaded from https://academic.oup.com/gji/article/224/3/1945/5996192 by Bibliothek des Wissenschaftsparks Albert Einstein user on 17 February 2021
Figure 8. Residuals between spatial log-likelihood scores forecasted by TEAM and SHIFT GSRM2f during the pseudo-prospective test period. In red areas,
ratios between spatial likelihood scores obtained by these models are positive, indicating that TEAM is spatially more informative than SHIFT GSRM2f.
In contrast, blue zones denote locations where the spatial distribution forecasted by SHIFT GSRM2f is more similar to the observations than the spatial
distribution computed by TEAM. We include as black circles d ≤ 70 km, mw ≥ 5.95 earthquakes reported from 2014 January 1 to 2019 December 31 in the
global CMT catalogue.
Figure 9. Concentration plots displaying the normalized cumulative distribution of observed seismicity (dashed lines), in comparison to that of the forecasted
earthquake activity (solid lines), according to (elft) the hybrid WHEEL (blue) and GEAR1 (red) models, and (right) the strain-based TEAM (blue) and
SHIFT GSRM2f (red) seismicity models.
the global annual seismicity rate provided by the 1977–2013 global are consistent with observed seismicity during the testing period
CMT catalogue. In addition, we note that all contestant seismic- at the 0.05 significance level, as both tectonic models, TEAM and
ity forecasts simultaneously pass the magnitude M-test during the SHIFT GSRM2f, forecast spatial seismicity patterns inconsistent
pseudo-prospective evaluation period (see Fig. 7). These results are with the observations (see Fig. 7). As discussed in Strader et al.
due to the fact that all models use unions of tapered Gutenberg– (2018) and Bayona-Viveros et al. (2019), SHIFT GSRM2f spatial
Richter functions to distribute their computed seismic moment rates inconsistencies during the 2015–2017 period could be primarily due
among rates of forecasted seismicity. Distinctively, only the spatial to initial underestimations of earthquake numbers in most subduc-
earthquake distributions forecasted by WHEEL, GEAR1 and KJSS tion zones. Therefore, TEAM attempts to compensate for this issue1954 J.A. Bayona et al.
Table 4. Pseudo-prospective N- and M-test results for GEAR1 and WHEEL over 2-yr intervals, overlapping during the
2014–2019 period.
Evaluation start date δ 1 (GEAR1) δ 2 (GEAR1) ζ (GEAR1) δ 1 (WHEEL) δ 2 (WHEEL) ζ (WHEEL)
01-01-2014 0.56 0.47 1.00 0.56 0.47 0.99
01-01-2015 0.89 0.12 1.00 0.89 0.12 0.98
01-01-2016 0.99 0.01 0.69 0.99 0.01 0.40
01-01-2017 1.00 0.01 0.29 1.00 0.01 0.08
Downloaded from https://academic.oup.com/gji/article/224/3/1945/5996192 by Bibliothek des Wissenschaftsparks Albert Einstein user on 17 February 2021
01-01-2018 0.73 0.29 0.98 0.73 0.29 0.91
Notes: These results show that N-test results are unstable during the 2016 January 1–2017 December 31 time frame, as GEAR1
and WHEEL overestimate rates of global seismicity (highlighted in bold).
by concentrating more of the forecasted seismicity density within hazard assessment. These approaches are based on SMERF2,
subduction margins by applying localized geomechanical parame- an earthquake-rate model for subduction zones constrained by
ters, such as dip angles, corner magnitudes and coupling coefficients interseismic strain measurements and earthquake-catalogue infor-
to these regions. Nevertheless, both tectonic forecasts obtain almost mation. TEAM is an ensembled tectonic seismicity model resulting
the same spatial likelihood score (-4858.75 for TEAM and -4857.09 from the combination of SMERF2 estimates in subduction margins
for SHIFT GSRM2f) during the testing period, despite substantial with SHIFT GSRM2f computations in non-SMERF2 interplate
variations among their spatial earthquake distributions (see Fig. 8). regions. WHEEL is a hybrid seismicity model created from the
Thus, these results suggest that spatial inconsistencies forecasted multiplicative blend of the tectonic parent TEAM and the KJSS seis-
by TEAM and SHIFT GSRM2f might rather be due to spatial un- micity forecast. Using actual earthquakes recorded during the 2014
dersmoothing or limitations of CSEP evaluations. January 1–2019 December 31 period, we pseudo-prospectively
To better understand S-test results, we generate concentration test the forecasting skills of these global ensemble earthquake
plots for both hybrid and tectonic forecasts, showing their normal- models, and statistically compare their performances with respect to
ized cumulative observed and forecasted seismicity distributions GEAR1. As a result, GEAR1 and WHEEL are the most informative
(see Fig. 9). For the hybrid models, the predicted earthquake distri- seismicity forecasts during the pseudo-prospective test period, as
butions are slightly shifted to the left of the actual seismicity distri- they obtain the highest information gain scores among all contestant
bution, which explains why the GEAR1 model ‘fails’ the two-sided earthquake forecasts (see Fig. 6 and Table 3). Interestingly, the
S-test during the evaluation period (although the S-test is one-sided). difference between their information gain scores is statistically
For the strain-based models, the forecasted cumulative distributions so insignificant, that the two models can be considered equally
are significantly shifted to the right of the observed earthquake dis- informative. Thus, we strongly recommend further prospective
tribution, with a greater difference observed for TEAM. This indi- evaluations of all contestant global seismicity models to objectively
cates that seismicity forecasted by TEAM and SHIFT GSRM2f is assess their capacities to forecast longer term earthquake activity.
too localized along plate boundaries compared to KJSS, GEAR1 The two global strain-based earthquake models are restricted to
and WHEEL. Consequently, if an earthquake occurs just outside of provide high-resolution estimates of shallow seismicity along tec-
a subduction zone, the forecasted rate will abruptly decrease and tonic plate boundaries. When compared, TEAM exceeds the spatial
cause a large drop in the S-likelihood score. As described above, forecasting abilities of SHIFT GSRM2f in subduction areas where
CSEP tests rely on the assumption that earthquakes rates are in- both forecasted and observed earthquake rate densities are high (e.g.
dependent and Poisson distributed. However, this assumption is the western portion of the Aleutian arc, the coastline of central Chile
particularly questionable in the presence of clusters of seismicity, and the New-Hebrides and Bismarck–Solomon subduction zones;
as the Poisson distribution could be underdispersed with respect see Fig. 8). In contrast, SHIFT GSRM2f better characterizes spatial
to the true earthquake distribution (Lombardi & Marzocchi 2010). patterns than TEAM in interplate regions with low forecasted seis-
Thus, S-test results may need to be revisited in future work using micity rates, hosting relatively few earthquakes during the testing
testing procedures that can more adequately capture the clustering period (e.g. the Andaman–Sumatra subduction margin, the middle
nature of earthquakes. American trench along southern Mexico, and the eastern sector
Finally, a further pseudo-prospective analysis shows that the num- of the Aleutian arc). We expect these results to converge towards
ber and spatial test results for GEAR1 and WHEEL tend to remain a more stable solution in the future, as geodetic strain rates are
stable over 2-yr intervals, overlapping during the 2014–2019 test- thought to have longer term effects on earthquake forecasting than
ing period (see Table 4). Interestingly, these forecasts overestimate six years, given their intrinsic relationship with seismic coupling
global earthquake activity during the 2016 January 1–2017 Decem- and plate motion. Accordingly, we will submit TEAM and WHEEL
ber 31 period, despite the occurrence of intermediate-size tectonic to the CSEP testing centre to assess the veracity of this hypothesis.
events, such as the 2016 mw = 7.9 Papua New Guinea, the 2016 mw CSEP is currently transitioning into a new phase of earthquake
= 7.8 Solomon Islands and the 2017 mw = 8.2 Mexico earthquakes. forecast experiments designed to relax the Poisson assumption by
Nevertheless, we interpret these results to be due to temporal fluc- accounting for the full distribution of the forecast (Nandan et al.
tuations in earthquake activity, which should be taken into account 2019; Savran et al. 2020). The pseudo-prospective evaluation of
for time-dependent seismicity modelling. earthquake-rate models presented in this study is the first testing
exercise of this underconstruction project on a global scale. Until
now, CSEP has been able to identify the most informative seismic-
5 C O N C LU S I O N A N D P RO S P E C T S ity models among more than 400 participant earthquake approaches
(Michael & Werner 2018; Schorlemmer et al. 2018). In this manner,
In this study, we describe the construction and pseudo-prospective
seismicity models like GEAR1 and WHEEL have been proven to
evaluation of two updated global seismicity models, aimed at
indeed possess the initial capacities to reliably characterize earth-
providing mean estimates of earthquake activity for seismic
quake patterns worldwide, despite some skepticism.Two global ensemble seismicity models 1955
6 D ATA A N D R E S O U R C E S Kagan, Y.Y., 2009. Testing long-term earthquake forecasts: likelihood meth-
ods and error diagrams, Geophys. J. Int., 177(2), 532–542.
The earthquake catalogue was obtained from the Global Centroid Kagan, Y.Y. & Jackson, D.D., 2011. Global earthquake forecasts, Geophys.
Moment Tensor (CMT; Dziewonski et al. 1981; Ekström et al. J. Int., 184(2), 759–776.
2012) Project, available at www.globalcmt.org/CMTsearch.html Kagan, Y.Y. & Jackson, D.D., 2016. Earthquake rate and magnitude distri-
(last accessed January 2020). butions of great earthquakes for use in global forecasts, Geophys. J. Int.,
206(1), 630–643.
Kreemer, C., Blewitt, G. & Klein, E.C., 2014. A geodetic plate motion and
Downloaded from https://academic.oup.com/gji/article/224/3/1945/5996192 by Bibliothek des Wissenschaftsparks Albert Einstein user on 17 February 2021
AC K N OW L E D G E M E N T S Global Strain Rate Model, Geochem. Geophys. Geosyst., 15(10), 3849–
3889.
The authors genuinely thank the Editor Margarita Segou, the anony- Kreemer, C., Holt, W.E. & Haines, A.J., 2003. An integrated global model
mous reviewers, and the reviewer Naoshi Hirata for their thorough of present-day plate motions and plate boundary deformation, Geophys.
reading and helpful comments in improving this manuscript. Ad- J. Int., 154(1), 8–34.
ditionally, we are grateful to David Jackson for enlightening dis- Lombardi, A.M. & Marzocchi, W., 2010. The assumption of Poisson
cussions on the construction of these global ensemble seismic- seismic-rate variability in CSEP/RELM experiments, Bull. seism. Soc.
ity models. Moreover, we warmly thank Peter Bird for provid- Am., 100, 15A(8):2293–2300.
ing valuable feedback to produce these models, as well as the Marzocchi, W., Zechar, J.D. & Jordan, T.H., 2012. Bayesian forecast evalua-
KJSS and SHIFT GSRM2f forecast grids to compare them with. tion and ensemble earthquake forecasting, Bull. seism. Soc. Am., 102(6),
This research was funded by the Consejo Nacional de Ciencia 2574–2584.
Michael, A.J. & Werner, M.J., 2018. Preface to the focus section on the
y Tecnologı́a (CONACYT) in collaboration with the Deutscher
Collaboratory for the Study of Earthquake Predictability (CSEP): new
Akademischer Austauschdienst (DAAD), under the funding pro- results and future directions, Seismol. Res. Lett., 89(4), 1226–1228.
gram number 57177537. Nandan, S., Ouillon, G., Sornette, D. & Wiemer, S., 2019. Forecasting the
full distribution of earthquake numbers is Fair, robust, and better, Seismol.
Res. Lett., 90(4), 1650–1659.
REFERENCES Pacheco, J.F. & Sykes, L.R., 1992. Seismic moment catalog of large shallow
Akinci, A., Moschetti, M.P. & Taroni, M., 2018. Ensemble smoothed seis- earthquakes, 1900 to 1989, Bull. seism. Soc. Am., 82(3), 1306–1349.
micity models for the new Italian probabilistic seismic hazard map, Rhoades, D.A., Schorlemmer, D., Gerstenberger, M.C., Christophersen, A.,
Seismol. Res. Lett., 89(4), 1277–1287. Zechar, J.D. & Imoto, M., 2011. Efficient testing of earthquake forecasting
Bayona-Viveros, J.A., von Specht, S., Strader, A., Hainzl, S., Cotton, F. models, Acta Geophys., 4(59), 1306–1349.
& Schorlemmer, D., 2019. A regionalized seismicity model for subduc- Savage, J.C. & Simpson, R.W., 1997. Surface strain accumulation and the
tion zones based on geodetic strain rates, geomechanical parameters, and seismic moment tensor, Bull. seism. Soc. Am., 87(5), 1345–1353.
earthquake-catalog data, Bull. seism. Soc. Am., 109(5), 2036–2049. Savran, W.H., Werner, M.J., Marzocchi, W., Rhoades, D.A., Jackson, D.D.,
Bird, P., 2018. Ranking some global forecasts with the Kagan information Milner, K., Field, E. & Michael, A., 2020. Pseudoprospective evaluation
score, Seismol. Res. Lett., 89(4), 1272–1276. of UCERF3–ETAS forecasts during the 2019 Ridgecrest Sequen, Bull.
Bird, P., Jackson, D.D., Kagan, Y.Y., Kreemer, C. & Stein, R.S., 2015. seism. Soc. Am., 110(4), 1799–1817.
GEAR1: a global earthquake activity rate model constructed from geode- Schorlemmer, D. & Gerstenberger, M.C., 2007. RELM testing center,
tic strain rates and smoothed seismicity, Bull. seism. Soc. Am., 105(5), Seismol. Res. Lett., 78(1), 30–36.
2538–2554. Schorlemmer, D., Gerstenberger, M.C., Wiemer, S., Jackson, D.D. &
Bird, P. & Kagan, Y.Y., 2004. Plate-tectonic analysis of shallow seismicity: Rhoades, D.A., 2007. Earthquake likelihood model testing, Seismol. Res.
apparent boundary width, beta, corner magnitude, coupled lithosphere Lett., 78(1), 17–29.
thickness, and coupling in seven tectonic settings, Bull. seism. Soc. Am., Schorlemmer, D., Zechar, J.D., Werner, M.J., Field, E.H., Jackson, D.D. &
94(6), 2380–2399. Jordan, T.H., RELM Working Group, 2010. First results of the regional
Bird, P., Kagan, Y.Y., Jackson, D.D., Schoenberg, F.P. & Werner, M.J., 2009. earthquake likelihood models experiment, in Seismogenesis and Earth-
Linear and nonlinear relations between relative plate velocity and seis- quake Forecasting: The Frank Evison Volume II, pp. 5–22, Springer,
micity, Bull. seism. Soc. Am., 99(6), 3097–3113. Basel.
Bird, P. & Kreemer, C., 2015. Revised tectonic forecast of global shallow Schorlemmer, D. et al., 2018. The collaboratory for the study of earthquake
seismicity based on version 2.1 of the Global Strain Rate Map, Bull. predictability: achievements and priorities, Seismol. Res. Lett., 89(4),
seism. Soc. Am., 105(1), 152–166. 1305–1313.
Bird, P., Kreemer, C. & Holt, W.E., 2010. A long-term forecast of shallow Strader, A., Werner, M., Bayona, J., Maechling, P., Silva, F., Liukis, M.
seismicity based on the Global Strain Rate Map, Seismol. Res. Lett., 81(2), & Schorlemmer, D., 2018. Prospective evaluation of global earthquake
184–194. forecast models: 2 yrs of observations provide preliminary support for
Bird, P. & Liu, Z., 2007. Seismic hazard inferred from tectonics: California., merging smoothed seismicity with geodetic strain rates, Seismol. Res.
Seismol. Res. Lett., 78(1), 37–48. Lett., 89(4), 1262–1271.
Dziewonski, A.M., Chou, T.A. & Woodhouse, J.H., 1981. Determination of Taroni, M., Zechar, J.D. & Marzocchi, W., 2014. Assessing annual global M
earthquake source parameters from waveform data for studies of global 6+ seismicity forecasts, Geophys. J. Int., 196(1), 422–431.
and regional seismicity, J. geophys. Res.: Solid Earth, 86(B4), 2825–2852. Werner, M.J., Helmstetter, A., Jackson, D.D. & Kagan, Y.Y., 2011. High-
Ekström, G., Nettles, M. & Dziewoński, A.M., 2012. The global CMT resolution long-term and short-term earthquake forecasts for California,
project 2004-2010: centroid-moment tensors for 13,017 earthquakes, Bull. seism. Soc. Am., 101(4), 1630–1648.
Phys. Earth planet. Inter., 200, 1–9. Zechar, J.D., Gerstenberger, M.C. & Rhoades, D.A., 2010. Likelihood-
Haines, A.J. & Holt, W.E., 1993. A procedure for obtaining the complete hor- based tests for evaluating space-rate-magnitude earthquake forecasts,
izontal motions within zones of distributed deformation from the inversion Bull. seism. Soc. Am., 100(3), 1184–1195.
of strain rate data, J. geophys. Res.: Solid Earth, 98(B7), 12057–12082. Zechar, J.D., Schorlemmer, D., Liukis, M., Yu, J., Euchner, F., Maechling,
Heuret, A., Lallemand, S., Funiciello, F., Piromallo, C. & Faccenna, C., P.J. & Jordan, T.H., 2010. The Collaboratory for the Study of Earthquake
2011. Physical characteristics of subduction interface type seismogenic Predictability perspective on computational earthquake science, Concurr.
zones revisited, Geochem. Geophys. Geosyst., 12(1), 58–61. Comput.: Pract. Exper., 22(12), 1836–1847.
Jordan, T.H., 2006. Earthquake predictability, brick by brick, Seismol. Res.
Lett., 77(1), 3–6.You can also read