Crevasse patterns and the strain-rate tensor: a high-resolution comparison
←
→
Page content transcription
If your browser does not render page correctly, please read the page content below
JournalojGlaciology, Vo!. 44, No. 146, 1998

                 Crevasse patterns and the strain-rate tensor:
                        a high-resolution comparison

                                    J. T.   HARPER,i    N. F.   HUMPHREY,I     W. T.   PFEFFER
                                                                                                   2

                     IDepartment ojGeology and Geophysics, University ojT!lYoming, Laramie, TiJYoming 82071, US.A .
                     2Jnstitute oj Arctic and Alpine Research, University ojColorado, Bouldel; Colorado 80309, US.A.

                   ABSTRACT. Values of the strain-rate tensor r eprese nted at a 20 m length sca le a re
                   found to explain the pattern and orientation of crevasses in a 0.13 km 2 reach of Worthing-
                   ton Glacier, Alaska, U.S.A. The flow fi eld of the reach is constructed from surveyed dis-
                   placements of 110 m a rkers spaced 20- 30 m apart. A velocity gradient m ethod is then used
                   to calcul ate values of the principal strain-rate axes at the nodes of a 20 m x 20 m ortho-
                   gonal grid. Crevasses in the study reach are of two types, splaying and transverse, a nd a re
                   everywhere norm a l to the trajectories of greatest (most tensile ) principal strain ra te.
                   Splaying crevasses ex ist where the longitudinal strain rate (Ex ) is :'S 0 and transverse cre-
                   vasses are present under longitudinally extending flow (i. e. Ex > 0). The orientation of cre-
                   vasses changes in the down-glacier direction, but the calculated rota tion by the flow field
                   does not acco unt for this change in orientation. Obse rvations suggest that individu al cre-
                   vasses represent local values of th e regional flow field and a re transi ent on the time-scale
                   of 1- 2 yea rs; they are not p ersistent features that a re translated a nd rotated by flow.
                   Crevasse patterns are thus found to be a useful tool for mapping the strain-rate ten or in
                   this reach of a temperate valley glacier.

INTRODUCTION                                                          different flow regimes. For example, Nye (1952) described
                                                                      the crevasse patterns that would be exp ected under various
Crevasses, features that a re common to virtually all glaciers        config urations oflateral shear and longitudinal stress.
and ice shee ts, are often interpreted as an indication of ten-           Whil e some observa tional case-studies of crevasses h ave
sional stress in surface layers of ice. For example, the cre-         been m ade (e.g. Nye, 1952; Meier a nd others, 1957; M eier,
vasses in the upper reaches of an icefall are commonly                1958; Gunn, 1964; K ehle, 1964; Holdsworth, 1969b; Colb eck
ass umed to represent fast a nd extending flow. \tVhile such          and Evans, 1971; H ambrey and Mii 11 er, 1978; Ham brey and
assumptions are broadly valid , glaciologists often need a            others, 1980; Vornbe rger and Whill a ns, 1990), field-based
more compl ete description of the flow field than the c urrenL        testing of theory has been limited a nd results have been in-
understanding of crevasses allows. A better knowledge of              conclusive. Previous work has been conducted at a variety of
the relationship between crevasses and flow-field dyna mics           length scales, from m eas uring the strain fi eld over a few cen-
might enable quick and useful assessments of the surface              time ters around a single crevasse (Colbeck and Eva ns, 1971)
flow conditions to be made from these features. A roug h ap-          to modeling the development of kilometer-long Antarctic
prai sa l of th e surface flow field would thus be possibl e for      crevasses (Vornberger and Whi ll a ns, 1990). Most fi eld
regions of many glaciers and ice sheets. This paper presents          studi es have made comparisons of crevasse occurrence with
a case-study that compares observations of crevasses a nd             measured values of the principal strain rates. A review of
detailed measurements of the flow fi eld as a means ofinves-          nearly all published fi eld measurements by Vaugha n (1993)
tigating the relationship between crevassing a nd the strain-         found that the thermal activation energies for creep and fail-
rate tensor.                                                          ure appear to be closely related, although no systematic var-
    The problem of crevassing has been addressed by theo-             iation with tensile stre ngth was found. Other workers h ave
retical , laboratory, and field-based observational studies. At       suggested a value of 0.01 a I as the critical level of ex tending
a small scale, work such as that by Ri st and Murrell (1994)          strain rate for the form ation of new crevasses in temperate
a nd Rist and others (1994) has examined the orientation of           ice (e.g. Meier, 1958; Holdsworth, 1969a). This, however,
brittle fractures a nd microcracks in stressed polycrystalline        has not been well establi shed, as H a mbrey and Mi.ill er
ice. Various workers have addressed the larger-scale                  (1978) found new crevasses opening over values ranging
problem of crevasse formation in glaciers with force-balance          from 0.004 to 0.163 a I.
co nsiderati ons. Much of this work has fo cused on the frac-             In addition to the uncertainties associated with crevasse
ture mechanics controlling th e spacing and p enetration              initiation, other ques tions remain a bout the relationship
depth of crevasses (e.g. Loewe, 1955; Nye, 1955; Robin, 1974;         between crevassing a nd flow dynam ics. In particular, rela-
Smith, 1976; \"'eertman, 1977; Nemat-Nasser a nd others, 1979;        tively little research has been directed toward the develop-
Sassolas and others, 1996). Sti ll other work has addressed the       m ent of crevasse fi eld s. Does an array of adjacent crevasses
theoretical patterns of crevasse famili es associated with            represe nt various stages in the life cyele of a crevasse as it is
68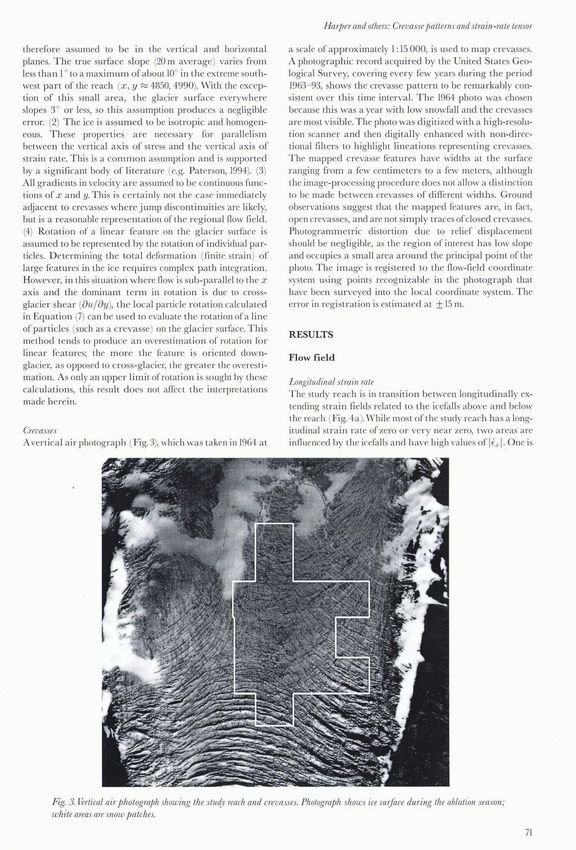
Harper and others: Crevasse patterns and strain -rate tensor

translated and rotated through the fl ow fi eld ? Or is each            center line of the glacier to the north val ley wall. Boreholes
crevasse a transient event representing on ly the stress condi-         drilled to the b ed and ice-penetrating radar measurements
tions of its c urrent location? Nye (1983: 75) stated, "the cre-        show that ice thickness ranges from 185 to 210 m (Welch and
vasses one observes on a glacier have been carried away                 others, 1996). Other work on this stud y reach has a ddressed
from the places where they were originally formed a nd have             th e subglacial h ydrology (Stone a nd others, 1994), surface
been rotated by the fl ow". For this reason, h e suggested that         velocity variations (H arper and others, 1996) a nd the char-
the trajectories of principa l stress and strain rate may not           acteristics of th e b ed and subsurface ice (H arper a nd Hum-
necessaril y match the crevasse pattern. H oldsworth                    phrey, 1995).
(1969b ) found that a seri es of transverse crevasses on Kaska-
wulsh Glacier, YukonTerritor y, Canada, are a train with two
                                                                        METHODS
new cr evasses form ed at a starting zone each year. Further-
more, Vornberger and \l\Thill ans (1990) modeled the transla-           Nye (1959) pioneered a procedure for calculating the princi-
tion and rotation of splaying crevasses on Ice Stream B,                pal axes of strain rate from measurements of the relative dis-
Antarctica, as individual crevasses that persist for decades            placement of velocit y markers. The m ethod s for calculating
and are transported tens of kilometers. Yet, open crevasses             the principal axes used here are an adaptation of this
certa inly h ave a finite lifetime; as ice moves into a changing        approach. A tota l of 110 point m eas urements of velocity are
stress field existing crevasses b ecome relict, while new ones          interpolated to form a velocity-fi eld g rid. Gradi ents in the
open. R el ict crevasses may p ersist in the new stress regim e,        velocity fi eld are then used to calcul ate components of the
may di sappear by ablatio n or infilling with snow a nd refro-          strain-rate tensor a t each of the grid nodes. Th e velocity gra-
zen meltwater, or may close by shear a nd compressional                 dient method h as the ad\'a ntage of rapid data coll ection and
strains. Th e questions th at rem ain about the life cycle of cre-      process ing, whi ch enabl es a la rge sampling of the fl ow field.
vasses m ay a t least in part b e due to a ver y limited number of      However, the a rea sampled by this meth od is less certain
compa ri so ns of crevasse field s with high spatial resolution         th an with techniques for direct m easurement of deforma-
meas urem ents of the flow field.                                       tion wit hin "st ra in elements".
     In this study the problem is addressed w ith a large obser-
vationa l data set defining the surface flow fi eld at a short          Velocities
length scale (10- 20 m). This a llows the strain-ra te tensor to
                                                                        Surface \"C locities were measured during two summ ers by
be calculated on a grid of d ensely spaced points with hori-
                                                                        repeated surveys of an array of stakes using a tota l station
zontal reso lution approximately equal to one-fifth of the ice
                                                                        theodoli te. In th e first year, 46 sta kes were pl aced in the
depth. The pattern of crevasses can therefore b e compared
                                                                        0.13 km 2 stud y reach, and 64 sta kes were used in the sa me
with well-defi ned variations in the flow fi eld . The objective
                                                                        reach during th e second yf'a r. The displacem ent of th e
is not to stud y locali zed p e rturbations in th e flow associated
                                                                        sta kes betwee n early M ay a nd m id-August (represe11ling
with the fo rm ation of individu al crevasses, but to investigate
                                                                        the ave rage summ er velocity ) was used to construct an
the relationship between families of crevasses and the regional
                                                                        interpol aled velocity field for each of the two sUlllm ers.
fl ow fi eld which creates and perhaps maintains th em.
                                                                        Surveying of 17 stakes o\'er a 1- 4 yea r period sugges ts that
     The stud y area cover s 0.13 km 2 of Worthing ton Glacier,
                                                                        the ave rage summer velocity is ver y close to the average
a temperate vall ey glacier in the Chugach Mountains,
                                                                        annual velocity. This is due to a balancing effect b e twee n a
Alaska, U.s.A. (Fig. I). Th e reach is just b elow the equi-
                                                                        win ter slow-down a nd a spring sp eed-up.
librium-line a ltitude of th e 8 km long, east- west runn ing
                                                                             The interpolated velocity grids are co nstructed with
valley glacier and occupies a low-angle b ench located
                                                                        nodes spaced at 20 m x 20 m on a n orthogonal g rid, and
between two icefall s. The ice falls are extremely fractured
                                                                        are referenced to a local coordin a te system. Each velocity
with deep and wide crevasses, multipl e fracture directions
                                                                        grid is sm oothed using a G a uss ia n filter co nsisting of a
and numerous seracs, whi le the bench is ch aracterized by
                                                                        3 x 3 matrix moved over the grid. Thi s reduces short-wave-
long, narrow a nd arc uate c revasses sp aced 3- 10 m apart.
                                                                        length noise in th e velocity field wh ich we beli eve r es ults
Th e stud y area extends across the bcnch from the kin ematic
                                                                        from loca li zed di sp lacement of sta kes ca used by m ove ment
                                                                        on crevasses (H arper and others, 1996). Again, the obj ective
                                                                        h ere is to investigate the regio na l fl ow fi eld and associated
                         Study Reach                                    crevasse pattern s, n ot the locali zed p erturbations associated
                                                                        with anyone crevasse. A virtually ident ical velocity p atte rn
                                                                        is seen in the two summ ers' meas urements, and the average
                                                                        difference between the two years a t th e grid nodes is less
                                                                        than 0.5%. Th e two velocity g rids are there fore co mbined
                                                                        to form a sp atia ll y and temporall y ave raged velocit y fi eld
                                   upper                                (Fig. 2). Because stakes are di splaced a la rge di stance during
                                   icefall                              the meas urem ent p eriod, the velocit y va lues h ave a sm all
                                                                        meas urement error: acculllu lated instrument a nd m eas ure-
                                                                        ment error a m ounts to no Illore th a n 0.3% of th e velocity.
                                                          o         1   The eri'ors and assumpt ions associated with th e sur vey ing
                                                           ~
                             145°45' W                        km        a nd interpolation procedures are di sc ussed in more deta il
                                                                        in H arper a nd othe rs (1996).
    Fig. 1. Map showing Worthington Glacier and the study reach.        Strain rates
    Th e study area covers a low -angle bench located between two
    major icifalls.                                                     Th e total velocity field (Fig. 2)    1S   decomposed into three

                                                                                                                                          69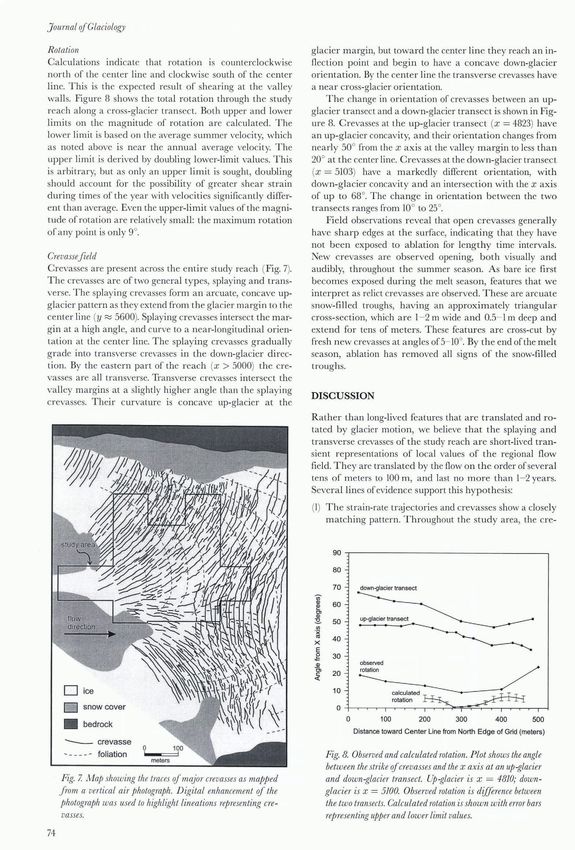
JournalofGlaciology

                                  5900.------,-------.-------.------.-------~------~~

                                  5800

                                  5700
                                                    -
                                               scale:
                                                   75 m a-'
                                               contour interval:
                                                1 m a-'

                     '-
                     Q)
                    -(3
                     III
                    aI/)
                         I
                                  5600
                     I/)

                     e
                    c..>
                                  5500

                                    4600               4700                  4800            4900        5000         5100          5200
                                                                             Down-Glacier Coordinate (meters)

       Fig. 2. Velocity field_Vectors show the measured displacement of110 velocity markers during the period early May to mid-August_
       ContollTS are of velocity in myem-- '. T he glacier's approximate center line is the east-west arm located at y =5600. Velocities are
       highest along the center line and decrease toward the valley walls. A strong gradient in velocity is present along the western arm of
       the center line at the base of the upper icifall.
orthogonal fields, cons isting of the down-glacier (x-direc-                                        measured vertical strain rate is within 6% of the calculated
ti on), cross-glacier (y-direction), a nd vertical (z-directio n)                                   value of E2 at this location. A second test on the continuity of
components of velocity: u, v a nd w, respectively_ Differen-                                        the interpolation and numerica l differentiation processe is
tiation of the horizontal velocity g rid s gives the stra in rates                                  provided by determining the residu al, R, of the principal
where                                                                                                train rates where
                                                                                                                                                                 (5)
          E.r        _ ] [ fl.!.!
                    Exy                !2 (fl.!.!+ill!)]
                                               ax                      ay    ax
                                                                                            (1)
                     Ey = ! (ill! +au)
        [ Eyx                                 av                                       -            Since Equation (2) assumes a n incompressibility condition,
                          2                   8y
                                              ax     ay                                             a non-zero value of R implies a lack of continuity in the nu-
The z ax is is oriented parall el to gravity, but since the slope                                   merical methods. When compared to the mean magnitude
of the glacier is low it is also approxim ately normal to the                                       of the g reatest principal strain rate, f3, R is found to be neg-
glacier surface_Therefore, because the air above the glacier                                        ligible over the entire grid: the max imum value of R/f3 at
can support no shear stress, the z ax is is taken to be a princi-                                   any locati on is 1.95 x 10 7. This shows that the numerical
pal ax is of stress_Assuming that the strain-rate tensor is par-                                    methods of interpolation a nd differentiation of the velocity
allel to the stress tensor and ice is incompressible, the                                           grids, which are used in finding El and E3, a re at least intern-
m ag nitude of the vertical principa l strain-rate axis, E2, is                                     ally consistent.
                                                                                                        The rotation of ice through the study reach can be
                                                                                            (2)     tracked by examining infinitesim al elements of ice across
The strain-rate field s are next used to calculate the mag ni-                                      the reach. The instantaneous rotati on rate, W, is calcu lated
tude and direction of the principal strain-rate axes in the                                         at each of the grid nodes by
horizontal xy plane_The magnitudes of the least tensile of
the horizontal axes, El, and most tensi le of the horizontal                                                             W=     ~ (~~ - ~~) .                    (6)
axes, E3, a re calculated as
                                                                                                    Th e fl ow paths are now assumed to be parallel to the x ax is.
          _         1 (_             _)               1 (_            _)2     - 2]                  Actual flow vectors devia te from th e x direction by a maxi-
         El     =   "2       Ex   + Ey    -         [ 4: Ex   -       Ey    + Exy          (3a)
                                                                                                    mum of only 5°, so this assumption produces a minim al
                                                                                                    error. The rotation is then accumu lated as an element of ice
          .                                                           . )2    . 2] ,                passes through the flow fi eld_The total rotation at anyone
         E3     =   "21 (.Ex + Ey. ) +               1 (.
                                                    [4: Ex    -       Ey    + Exy          (3b)
                                                                                                    point is calculated from
a nd                                                                                                                                 x wx(x)
                           2E-
        2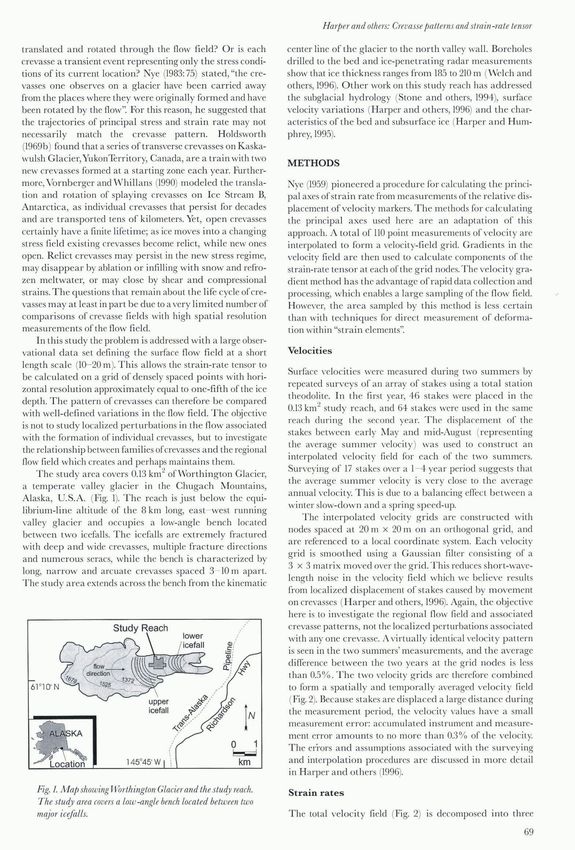
HmjJer and others: Crevasse pattems and strain-rate tensor

therefore ass umed to b e in the \'ertical a nd horizonta l                a scale of approx imately I : 15 000, is used to m ap crevasses.
pla nes. The true surface slope (20 m aver age) va ries from               A photogr aphic record acquired by the United Sta tes Geo-
less tha n 1° to a maximum of about 10° in the extreme so uth-             logical Survey, covering ever y few years during the period
west part of the reach (x, y ~ 4850, 4990). With the excep-                1963- 93, shows th e crevasse p a ttern to be rem a rka bly con-
tion of thi s small a rea, th e glacier surface everywh ere                sistent over this time inter val. The 1964 photo was chosen
slop es 3° or less, so this ass umpti on p roduces a negligible            because this was a yea r wi t h low snowfa ll a nd the crevasses
error. (2) Th e ice is assumed to be isotropic a nd homogen-               are most visibl e. The photo was digiti zed with a hig h-resolu-
eous. These properti es are necessa ry for parallelism                     ti on scanner a nd then di gita lly enh a nced wi th non-direc-
betwee n the ve rtical ax is of stress and th e vertica l ax is of         tional filters to highlight lineati o ns representing cre\'asses.
strain ra te. This is a common ass umpti on a nd is supported              T he mapped crevasse features h ave widths at th e surface
by a sig nificant body of literature (e.g. P a terson, 1994). (3)          ranging fro III a few eentimete rs to a few meters, a lthough
All gradi ents in velocity a re ass umed to b e continuous func-           the im age-process ing p rocedu re d oes not allow a di stinction
ti ons of x a nd y. This is certa inl y not the case immedi ately          to be made b etwee n crevasses o f different width s. Ground
adj ace nt to crevasses where jump di scontinuiti es a re likely,          observations suggest that the m a pped features a r e, in fac t,
but is a reasonabl e representati on of the regional fl ow field.          open crevasses, a nd arc not simpl y traces of elosed crevasses.
(4) Rota tion of a lin ea r feature on the g lacier surface is             Photog ram metric di stortion due to relief di splacement
ass um ed to be represented by the rotation of individual p a r-           should be n egligible, as the r egio n of interest h as low slope
ticles. D etermining the to ta l deform ation (finite strain ) of          a nd occ upi es a sm all area a ro und the principal p oint of the
large features in the ice requires complex p ath integrati o n.            photo. Th e im age is registered to the fl ow-field coo rdinate
However, in thi s situ ati o n wh ere fl ow is sub-pa rall el to th e x    system using p oints recogni zable in the pho tograph that
ax is and th e domin ant te rm in ro tatio n is due to cross-              have been surveyed into th e local coordinate system. Th e
glacier shea r (aul ay), the local particle ro ta tion calculated          error in registration is estim a ted a t ± 15 m.
in Equ ati o n (7) can be used to evaluate th e rotation of a lin e
of pa rtiel es (such as a crevasse ) on the g lacier surface. This
                                                                            RESULTS
method tend s to produce a n overestimati o n of rotation for
linear features; the m or e the feature is oriented down-
                                                                            Flow field
glacier, as opposed to cr oss-glacier, the g r eater the overesti-
mati on. A s onl y an upper limit of rotatio n is sought by these
                                                                            Longitudinal strain rate
calculations, thi s res ult d oes not affec t th e interpretati on s
                                                                            Th e stud y reach is in tra nsitio n b etween longitudin ally ex-
made herein.
                                                                            tending strain fi elds related to the icefall s above a nd below
                                                                            th e reach (Fig. 4a ). Whil e most of the stud y reac h has a long-
Crevasses                                                                   itudinal stra in ra te of zero o r ve r y near zero, two areas arc
A ve rtica l air photograph (Fig. 3), which was taken in 1964 a t           influenced by th e icefalls a nd h ave high values of IE.r I..onc is

        Fig. 3. Vertical air jJlwtograj)h showing the study reach and crevasses. Photograph shows ice s1l1Jace during the ablalion season;
        while areas are snow patches.
                                                                                                                                              71
J ournal qfGlaciology
4700 4800 4900 5000 51 00 5200
A
en...
$
5800 longitudinal
Strain Rate (E.) D
Cl)
E-
Cl)
...- Contaur In/erval;
(tl 0.01 a' \
c 5700
...0
'6
0
()
...
Cl)
'0
(tl 5600
(5
u,
r/)
e
()
5500
B
-.....
Shear
en... 5800
Strain Rate (E..)
$ -~~
-.....
Cl)
E-
-Cl)
(tl
c
'E0
5700
Contaur In/eNal;
0.01 a' \
-0-4!0
0
()
...
Cl)
'0
5600
0
~
(tl
(5
I
r/)
~
r/)
e
()
5500
4700 4800 4900 5000 5100 5200
Down-Glacier Coordinate (meters)
Fig. 4. ( a) Contour map of the longitudinal strain rate. ( b) Contour map qf the shear strain rate. Shaded areas are regions with
positive values.
a region of strong compression in the up-glacier part of the in the southeastern par t of the reach (x, y ;::::: 5000, 5525).
center line (x < 4800). H ere, compressional strain r ates This a r ea overlaps with the a rea of high long itudinal exten-
reach values as high as - 0.071a- I. This a rea is where the sIon.
slop e of th e glacier surface is steadil y decreasing as the
upper icefall gives way to the low-a ngle bench of the study Principal axes
reach. The second area with a high IEx I is undergoing long- The axes of principal strain r ate show significan t variations
itudina l extension and is in the southeast pa rt of the r each over the study area. The principal axes at each of the grid
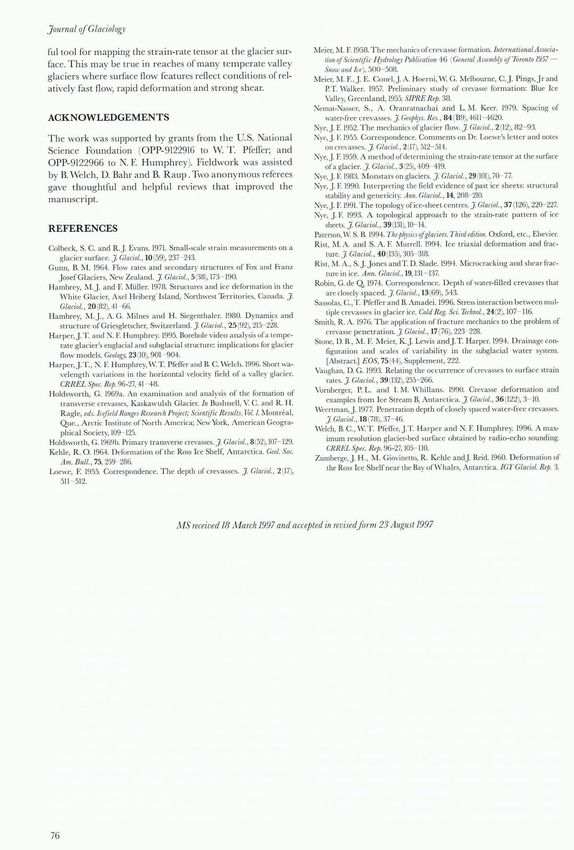
(x > 5000; Y < 5600). This area corresponds to a zone of in- nodes a r e plotted as arrows showing m ag nitude, orienta-
creasing surface slope a nd has a m aximum tensile str a in tion, a nd extension or compression (Fig. 5). No part of the
r ate of 0.015 a- I. The bed slope is also incr easing in this a rea reach shows bulk compression or extension in the horizontal
(Welch and others, 1996). plane, a lthough many a reas show a strong disp a rity in mag-
nitude between El and E3. The magnitudes of the principal
Shear strain rate strain-rate axes reach m aximum values of 0.056 a- I in exten-
D eform ation by shearing at the valley wa lls dominates the sion a nd - 0.084 a - I in compression, while the a bsolute value
surface ice fl ow of the study reach : a sh ear gradient is pa r al- ave raged over the study reach is 0.02 a- I. Compression is
lel to the valley walls ac ross the en tire reach (Fig. 4 b). Shear greatest a t the western a rm of the center line (x :s; 4825)
m ag nitudes increase from near-zero values at the center line wher e values are as high as - 0.084 a- I. Both El a nd E3 have
to negati ve values (indicating left-l ateral shear) of - 0.045 a- I large m agnitudes along the nor thern ed ge of the study
near the northern valley wall. In addition lo lhe gr adienl, region where there is slrong shearing al lhe va lley margins.
two a reas show localized high shearing. Strongly negative A sligh t p eak in the magnitude of E3 is observed in the south-
values of Exy are presen t in the western a rm of the center line eastern p a r t of the reach (x, y = 5000, 5550). This area co-
(x :s; 4825). H ere, a steep slope to the sou thwest causes sh ear incides with th e region of high shear a nd longitudina l
during compression. Positive shear (rig ht-lateral) is p resent extension.
72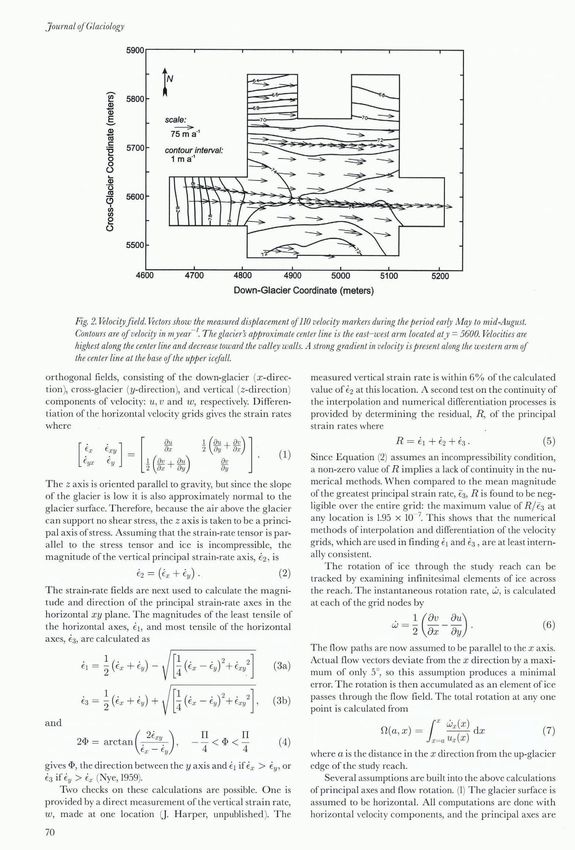
Hmper and others: Crevasse patterns and strain-rate tensor

                              5900

                              5850
                                                                       xxxxx
                   Cil
                   ....                                                XXXXX
                   2Q)        5800                                 XXXXX
                                                                   XXXXX
                   .s 5750                    x                        XXXX"X;.\, ...... ";-"-Y-..Y-..'I...'h
                    Q)
                   coc:                                                xxxxx                      x x ",,",,-'1...')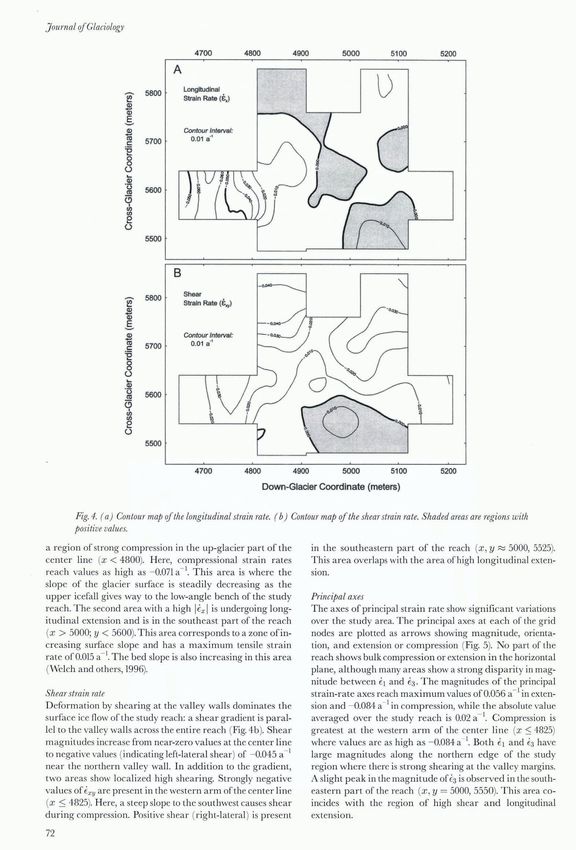
Journal cifGlaciology

Rotation                                                              glacier m a rgin, but toward the center line they reach a n in-
Calcu lations indicate that rotation IS counterclockwise              fl ectio n point and begin to have a concave down-glacier
nort h of the center line and clockwise south of the cen ter          orienta ti o n. By the cen ter line the transver se crevasses have
li ne. T hi s is the expected resul t of sheari ng at the vall ey     a near cross-glacier orien tation.
wa lls. Figure 8 shows the total ro tation thro ugh the study              The change in orien tation of crevasses between an up-
reac h a long a cross-glacier transect. Both upper a nd lower         glacie r tr ansect and a d own-glacier tr ansect is shown in Fig-
limits on th e m ag nitude of rota tio n a re calculated. Th e        ure 8. Crevasses at the up-glacier transect (x = 4823) have
lower limit is based on the ave rage sum mer velocity, which          a n up-g lacier concavity, a nd their orienta tio n changes from
as noted above is near the a nnu a l ave rage velocity. The           nea rl y 50° from the x ax is at the valley m a rgin to less tha n
upper li mit is derived by do ubling lower-limi t values. This        20° a t the center line. Crevasses at the d ow n-glacier transect
is a rbitrary, but as only an upper limi t is sought, d oubling       (x = 5103) have a m a rkedly different orientation, with
shoul d account for the possibi lity of g reater shear stra in        down-glacier concavity a nd a n intersecti o n with the x axis
d uring times of the year with velocities significantly differ-       of up to 68 °. The cha nge in orientation between the two
ent than average. Even the upper-limit values of the m agni-          transects ranges from 10° to 25°.
tude of rotation a re relati vely sm a ll: the m ax imum rotation          Field observations r eveal that open cr eva sses gener a lly
of a ny point is only go.                                             have sh a rp edges at the surface, indicating that they have
                                                                      not been exposed to a bl ation for leng thy time interva ls.
Crevasse field                                                        New cr evasses are observed opening, both vi sually a nd
Crevasses are present across the en tire study reach (Fig. 7).        audibly, throughout the summer season. As bare ice first
T he crevasses a re of two general ty p es, spl aying a nd trans-     becom es exposed during the melt sea son, features that we
verse. T he splaying crevasses for m a n a rcuate, concave up-        interpre t as relict crevasses a re observed . These are arcua te
glacier pattern as they extend from the glacier margin to t he        snow-fi li ed troughs, having a n approximately triangul a r
ce nter line (y ~ 5600). Splaying crevasses intersect the m a r-      cross-section, which are 1- 2 m wide a nd 0.5- 1 m deep a nd
gin at a high a ngle, and cur ve to a near-l ongitudinal orien-       extend fo r tens of m ete rs. These features a re cross-cut by
tation at the center line. The splaying crevasses gradually           fresh n ew crevasses at a ng les of 5- 10°. By the end of the m elt
grade into transverse crevasses in the down-glacier direc-            season, a blation has rem oved all sig ns of the snow-filled
tion. By the eastern part of the reach (x > 5000) th e cre-           tro ugh s.
vasses a re all transverse. Transverse cr evasses intersect the
valley margins at a slightly higher a ngle than the splaying
                                                                      DISCUSSION
crevasses. Their c urvat ure is concave up-glacier at the
                                                                      R at her than long-lived features that a re tra nslated and ro-
                                                                      tated by g lacier motion, we beli eve th a t the splaying a nd
                                                                      tra nsver se crevasses of the study reach a r e short-lived tra n-
                                                                      sient representations of local values of the regional flow
                                                                      fi eld . They are translated by the fl ow on th e order of severa l
                                                                      tens of m eters to 100 m , a nd las t no more than 1- 2 years.
                                                                      Sever a l lines of evidence support this hy pothesis:
                                                                      (I) Th e stra in-rate traj ectories and crevasses show a closely
                                                                          m atc hing pattern . Th roughout the study a rea, the cre-

                                                                                90

                                                                                80

                                                                                70         down-glacier transect
                                                                       en
                                                                        Cl)
                                                                        ~
                                                                                60
                                                                        Cl
                                                                       Cl)
                                                                                           up-glacier transect
                                                                       ~        50
                                                                        '"
                                                                       ·x
                                                                       >
Harper and others: Crevasse pallerns and strain -rate tensor

   vasses are normal to E3 (parallel to Ell. Both crevasses                In addition to indicating the directions of El and E3, the
   a nd stra in-rate trajectori es show simil ar variatio ns         crevasse pattern of the study reach conta ins inform ation
   across the study reach: the y app roach th e vall ey walls        about the longitud ina l strain rate. Where Ex is zero or near
   at a high a ngle and show an increase in th is a ngle in th e     zero, splaying crevasses occur. Surface defo rm ation in these
   down-glacier direction, and they a re concave up-glacier          regions is dominated by shear. Splaying c revasses extend
   near the valley margin and become concave down-                   from the valley walls a ll the way to the glac ier center line,
   g lacier at the ce nter line in th e eastern part of the r each   even though the shea r strain rate is low a t mid-glacier. Nye
   (x> 4900).                                                        (1952) shows that crevasses are expected to extend to th e
                                                                     center lin e where Ex is ze ro. \-Vhere Ex is compressiona l
(2) Th e down-glacie r change in ori enta tion of the crevasses
                                                                     (negative ), the width of the crevasse belt caused by shear a t
    is not expl ained by the calcul a ted rotation of the fl ow
                                                                     the valley margin is controll ed by the ratio of the shea r
    fi eld. Th ese values a re compared a long two cross-glacier
                                                                     stress Txy to the longitudina l stress (J.,.. If la teral spreading
    transects in Figure 8. Upper-limit values of the cal-
                                                                     of the ice is prevented by stee p vall ey wa lls, crevasses ca n
    c ulated rotation are much lower than the observed rota-
                                                                     be expected where ITryl > la.r / V21. Nye's (1952) a nalysis fits
    tion, suggesting th at flow rotatio n is not responsibl e for
                                                                     th e study reach, where crevasses extend to the center lin e
    the change in o rientation of crevasses between th e two
                                                                     wherever the shear strain ra te is greater th a n the longi tudi-
    transects. As on ly abou t 4 yea rs are required for ice to
                                                                     nal stra in rate. Th e effect o f negative E.r is to swing most ten-
    pass from one transect to the other, rotation by fl ow can-
                                                                     sil e stress a round so as to m a ke an angle o f intersection with
    not keep the orientation of a crevasse in acco rdance w ith
                                                                     the margin of less than 45 °. In the stud y reach, both cre-
    observation for more than about 2 years. Th e crevasse
                                                                     vasses and principal stra in-ra te axes change from a smaller
    must close a nd a new one must open in a d iffering orien-
                                                                     to a hig her a ngle of intersec ti on with th e va ll ey wall as E.T
    tation. Thi s se ts an upper limit for the life-span of a
                                                                     goes from negati ve to ze ro values. Where E.1· becomes pos i-
    crevasse.
                                                                     tive (extensiona l) the cre vasses change from splaying to
(3) Field observations of crevasses s uggest that they are           transve rse.
    transient on a 1- 2 year time- cale. Active crevasses h ave           The topo logy of stra in-ra te field s has bee n examined in
    fresh, sharp edges revealing lit tle exposure to ablation.       detail by Nye (1983, 1990, 199 1, 1993). Nye indi cates that a n
    Inactive crevasses a re cross-cut by yo unger, active cre-       isotropic point, which is a point defin ed by a pattern of
    vasses. Whil e fi eld observations reveal fres h a nd opening    strain-rate traj ectories, sho uld be expec ted in virtuall y all
    crevasses, mapping does not indicate an increase in th e         glaciers. The importa nce o f a n isotropic point is that the pa t-
    density of crevasses in the down-g lacier directi on. This       tern of strain-rate traj ec to ri es a round th e po int is stable to
    impli es that old crevasse di sappear whil e new ones            perturbati o ns to the fl ow field ; it may move and warp, but
    o pen. We suggest that inactive crevasses di sappear, wh e n     will not di sappear. Th e stra in fi eld at a n iso tropic point is
    th ey are no longer oriented normal to the direction of          such that E.r = Ey a nd E.,.y = O. Th e stud y reach has an isotro-
    m ax imum ex tension, by a combination of clos ing due to        pic point in the southeas tern corner (x, Y ~ 5050, 5550),
    shea r strain and surface ablation. Zumberge and others          which in thi s case is a monstar pattern (Fig. 6). This point is
    (1960: 145) mea ured clos ing ra tes of crevasses o n the        along th e g lac ier ce nter I i ne a nd exists where the val ue of E.,.
    R oss Ice Sh elf tha t were similar in magnitude to open-        changes from zero to a positi ve va lue. Th e crevasses in this
    ing rates. Borehole video analysis of the englacia l ice         region a re in transition fro m spl ay ing to tra nsverse pat terns.
    strueture of Wo rthing to n Glacier revea ls a large numbe r     When the strain-rate field is pl otted at a 20 m length scale,
    of clea r-ice laye rs (H a rper a nd Humphrey, 1995) which       the isotropic point covers an a rea of approx im a tel y 2500 m 2 .
    a re probabl y closed a nd anneakd crevasses.
(4) Repeated surveys of stakes at wee kl y time intervals sh ow
    loeali zed anomalies in th e veloc ity fi eld that we believe    CONCLUSIONS
    a re the res ult of opening a nd closing of crevasses
    (H arper and oth ers, 1996). These anomali es are equall y       Ana lys is of d ata coll ected o n \ Vorthingto n G lac ier indicates
    di stributed across the stud y a rea, suggesting that cre-       that the p attern of crevasse in a non-icefa ll reach of the
    vasses are active ever ywhere in th e r each. Th e number        glacier co nta ins a great deal of inform atio n about th e flow
    o f these local perturbations is found to be proportional        fi eld. Crevasses a re co mpa red with ti me-ave raged 20 m
    to the average ve locity. Thus, as the g lacier moves faster     leng th scale values of th e strain-rate tensor derived from
    the crevasses open and close more frequentl y, a require-        detai led measurements o f th e fl ow field. A sp lay ing pattern
    ment for continuity of creva ses.                                of cre\'asses is prese nt whe re th e longitud i na l strain rate is
                                                                     compress ion a l or near zero and surface deformation is
    An a lternative expl anation for the difference be twee n        dominated by shear strain. \I\Ih ere longitudina l extensio n
the calculated va lues o ffl ow rotation and the observed rota-      ex ists, the crevasses becom e transver. e. Across the enti re
tion of crevasses is that the fl ow rotation is domin ated b y         tud), a rea the crevasses a rc normal to traj ecto ri es of th e
strain events that are transient a nd /or limited in space.          greatest principal extending stra in rate. Calculated valu es
Our ca lculations represent the tim e-averaged, 20 m length          of flow rotation for ice moving through the stud y reach a re
scale fl ow field , and th erefore res ults contain no information   significantly less than the observed change in th e orienta-
about such tim e- or space-limited events. H owever, transi-         ti on of c revasses from th e upstream to dow nstream ends of
ent strain events ca nnot explain fi eld observations that sug-      the reach. This, combined w ith fi eld obse r vati ons, impli es
gest crevasses are opening frequently and have a sho rt life-        that indiv idu al crevasses a re transient features that ex ist
span. Furthermore, this explan ation would impl y that th e          for no m ore th an about 1- 2 years and represent the loca ll y
close correlation be tween the traj ectori es of principa l aXIs     ave raged va lue of the regiona l fl ow fi eld. Th e crevasses of
a nd crevasse orientation is simpl y fortuitous.                     the stud y reac h in Worthing to n Glacier are, therefore, a use-

                                                                                                                                          75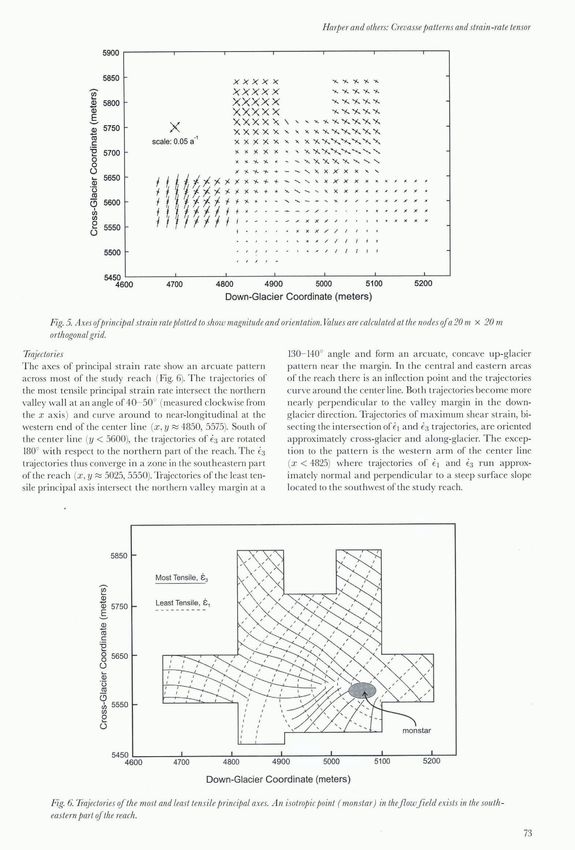
J ournal cifClaciology

ful tool for mapping the strain-rate tenso r a t the glacier sur-                            l\1eier. r..1. F. 1958. The mechanics of crevasse for mation. [nternational Associa-
                                                                                                  tion q/ Scientific Hydrology Publication 46 (Gelleral AssemblY qfToronto 1957 -
face. This may be true in reaches of ma ny temperate va ll ey
                                                                                                  Snow and lee), 500- 508.
glaciers w here surface fl ow features refl ect conditions of rel-                           Meier, M. F. . j. E. Conel, j. A. Hoerni, W. G. Melbourne, GJ. Pings, J r and
atively fast fl ow, rapid deformation and strong shear.                                           P T. Wa lke r. 1957. Prel iminary srudy of crevasse form at ion: Blue lee
                                                                                                  Vall ey, G ree nland, 1955. SIPR£ Rep. 38.
                                                                                             Nemat-Nasscr, S. , A. O ranratnach ai a nd L. M. Keer. 1979. Spacing of
ACKNOWLEDGEMENTS                                                                                  wa tcr-free crevasses. J Geophys. Res., 84 (B9), 4611 - 4620.
                                                                                             Nye, j. F. 1952. The mechanics of glac ier now. J GIl/cio!., 2 (12), 82- 93.
The wo rk was supported by g rants from th e U.S. Nationa l                                  Nye, j. F. 1955. Co rres pondence. Comments on Dr. Loewe's le tter a nd notes
Science Found ation (OPP- 9122916 to W. T. Pfef[er; a nd                                          on crcvasses. ]. Cladol., 2(17), 512-514.
                                                                                             :>Iye, j. F. 1959. A me th od of detcrmining the stra in-ra te tenso r at thc surfacc
OPP- 9122966 to N. F. Humphrey). Fi eldwork was as isted                                          of a glacier. J Claciol. , 3 (25), 409-419.
by B. vVelch, D. Bahr and B. Raup . Two a no nymous referees                                 Nye, j. F. 1983. M o nstars on glaciers. J ClacioL., 29 (101),70-77.
gave tho ug htfu l and helpful reviews th a t improved th e                                  Nye, j. F. 1990. Interpreting the fi eld evidence of past ice shccts: struc tural
manuscript.                                                                                       stabilit y a nd ge nericity. AIII/. Glaciol., 14, 208 210.
                                                                                             )lye, j. F. 1991. Th e topology of ice-sheet ce lllres. J GlacioL., 37 (126),220- 227.
                                                                                             :\'ye, j. F 1993. A topologica l approach to the strain-rate p a ttern of ice
REFERENCES                                                                                        sheets. J GlacioL. , 39 (131), 10- 14.
                                                                                             Paterson, \V. S. B. 1994. The jJII),sicsq/glaciers. T hird editioll. O xford, etc., Elsevier.
Co lbeck, S. G a nd R.]. Eva ns. 1971. Sm all-scale st ra in measurements on a               Rist, M. A. a nd S. A . F. Murrell. 1994. Ice tri ax ial deform a ti o n and frac-
    glacier sur face. J Glaciol., 10 (59), 237- 243.                                              turc. J Glaciol., 40 (13.)), 305- 318.
Gunn, B. M . 1964. Flow rates and secondary str ucrures of Fox and Fra nz                    Rist, M. A. , S.J.Jo nes and T. D. Sl ade. 1994. Microcracking a nd shea rfrac-
   J osefGlac iers, New Zea land. J Glaciol., 5 (38), 173 190.                                    ture in ice. Ann. Claciol. , 19, 131- 137.
H ambrey, M .]. a nd F. Mii ller. 1978. Structu res a nd ice defor mation in the             Robi n, G. de Q 1974. Correspondence. D ept h of water-filled c revasses that
    White G lacier, Axel Heiberg' Isla nd, Northwes t Territori es, Canada. J                     are closely sp aced. J Glaciol., 13 (69), 543.
    GlacioL., 20 (82), 41- 66.                                                               Sassolas, G, T. Pieffer a nd B. Amadei. 1996. Stress interaction betwcen mul-
H ambrey, M.]. , A. G. Miln es a nd H . Siegentha ler. 1980. Dynamics a nd                        tiple crevasses in glac ier ice. Cold Reg. Sci. TeChIlOL., 24 (2), 107- 116.
    structure of Griesgletscher, Switze rl and . J Glaciol., 25 (92), 215 228.               Smi th, R. A. 1976. The applicati on of frac tu re mechanics to th e p robl em of
H arper, j. T. a nd N. F. Humph rey. 1995. Borehole video a na lysis ofa tem pe-                  crevasse penetra tion. J Glaciol., 17 (76), 223- 228.
    rate glac ier's englacial a nd subglacial structure: implications for glacier            Stone, D. B. , M . F. M eicr, K.J. Lewis a ndj. T. Harper. 1994. Drai nage con-
    now m odel s. Geology, 23 (10), 901 - 904.                                                    figurat ion a nd scales of "a ri ability in the subglacia l water system.
H arper, j. T., :"I. F. Humph rey, W. T. Pfeffer and B. G Welch . 1996. Short wa-                 [Abstracl.] £ OS, 75 (44), Suppl ement, 222.
    ve leng th va ri ations in the horizonta l velocity fi eld of a va lley glac ier.        Vaughan, D. G. 1993. Relating the occu rrence of ere\'asses to surface strain
    CRR£ L SjJec. Rep. 96-27, 41- 48.                                                             rates. J Glaciol., 39 (132),255- 266.
Holdsworth, G. 1969a. An exa min ati on and ana lysis of the formation of                    Vornberger, P L. a nd I. M. Whill a ns. 1990. Crevasse defo rm ation a nd
    transverse cre,'asses, K askaw ul sh G lacier. In Bushne ll , V G and R. H.                   examples fro m Ice Stream B, Anta rctica. J GlacioL., 36 (122), 3 10.
    R agle, eds. lcif/efd Ranges Research Project; Scientific Results. ViJl. l. Montrea l,   Weertman, j. 1977. Penetration depth ofciosely spaced water-free crevasses.
    Que., A rct ic In sti tute of North A merica; Ncw York, America n Geogra-                     J Glaciol. , 18 (78),37- 46.
    phica l Society, 109- 125.                                                               Welch, B. G , "V.T. P feITe r, J. T. H arp er a nd N. F. Humphrey. 1996. A max-
Holdsworth, G. 1969 b. Prim ary tra nsverse crevasses.]. Glaciol., 8 (52), 107- 129.              imum resoluti o n glacier-bed surface obta ined by radi o-ech o sounding.
Kehle, R . O . 1964. Deformation of the R oss Ice Shelf, A nta rctica. Geol. Soc.                 CJ?R EL Spec. Rep. 96 -27, 105- 110.
    Am. BuLL., 75, 259- 286.                                                                 Zumberge, j. H. , M. G iovinetlO, R. Kehle andJ. Reid. 1960. D eformation of
Loewe, F. 1955. Correspondence. The depth of crevasses. J Glaciol., 2(17),                        the Ross lee Shelf near the Bay of\Vh a les, Antarctica. IGYClacioL. Rep. 3.
    511 - 512.

                                              MS received 18 M arch 1997 and accepted in revisedform 23 August 1997

76
You can also read