CTU Monthly Economic Bulletin - No. 220 (July 2020) - NZCTU
←
→
Page content transcription
If your browser does not render page correctly, please read the page content below
CTU Monthly Economic Bulletin
No. 220 (July 2020)

The Pay Equity edition
Summary
Discussion of various aspects of the gender and ethnic wage and pay gap including the
importance of early childhood education and the need for pay transparency.
Economic indicators for July show plateauing Jobseeker and Covid Income Relief payment
recipients albeit from a higher base than this time last year.
House, bond and share markets continue to increase in value ostensibly due to significant levels
of quantitative easing.

Last week in the dead of night – just before midnight on Thursday - the Government passed the
Equal Pay Amendment Act. This Act set out to improve the process for women in occupations
that have been economically disadvantaged compared to work of equal value done by men.

As well as being a gender equity issue it is also an economic and wellbeing issue as households
with the main earner being female are between two and three times more likely to be in poverty
than those with the main earner being male.1

1   https://www.hrc.co.nz/files/8215/7462/2882/In-Work_Poverty_Report_2019.pdf
1                                                                         CTU Monthly Economic Bulletin – July 2020
My own view on the structural gender pay gap is that it is quite understandable in a world where
arguably the most important work of our society – producing, feeding, and raising the next
generation – has a market price of zero. As this work has historically been done by women it is
unsurprising that unconscious bias - or discrimination or sexism - means that the market left to
its own devices will not value the paid work undertaken by women as highly as it does
comparable work done by men.

                                  Wage and salary gap cf European Male
    -10%
    -15%
    -20%
    -25%
    -30%
    -35%
    -40%
              2010       2011       2012       2013       2014        2015       2016       2017       2018       2019
                                 Source: NZ.Stat Average hourly wage by sex and ethnic group

               Maori Male          Pasifika Male        European Female           Maori Female          Pasifika Female

With race, researchers at the AUT have found higher levels of racism in the workplace in New
Zealand than in comparable countries. The graphs very clearly show the intersectional nature of
the wage gaps. Race plays an equivalent or – factoring in self-employment – potentially higher
impact than gender. 2

And yes, there is a structural pay gap – it is not all occupation or education.

This was very clearly shown by Dr Isabelle Sin and others with the Specialist Doctors and also
more generally for other occupations. In fact recently Dr Charlotte Chambers outlined the
structural challenges faced by the women specialist doctors which could easily be extended to
most professional women’s experience in the workplace – albeit a group that inherently has
significant privilege.

2I note though that any comments of mine on race should be taken with a grain of salt given that the economics profession also
suffers from racial unconscious biases
2                                                                            CTU Monthly Economic Bulletin – July 2020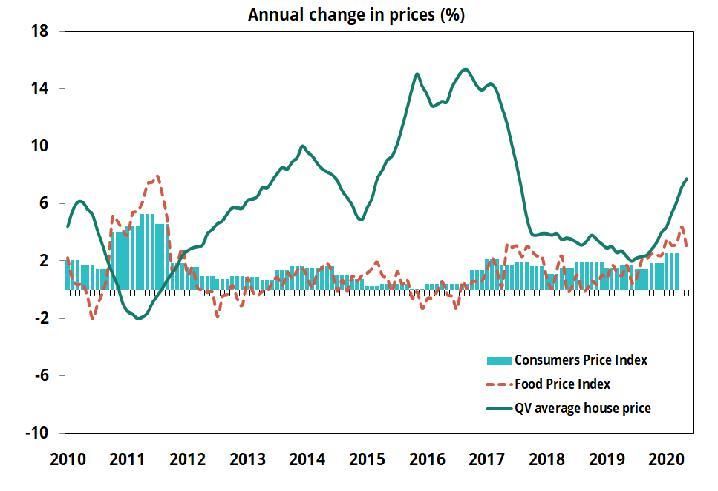
Self-employment

                                           Pay gap cf European Male
     -5%
    -10%
    -15%
    -20%
    -25%
    -30%
    -35%
    -40%

                                                                         2015
             2010

                        2011

                                    2012

                                               2013

                                                              2014

                                                                                        2016

                                                                                                  2017

                                                                                                             2018

                                                                                                                      2019
                    Source: NZ.Stat Earnings for people in paid employment (wage and self employment) by
                                                     sex and ethnic group
                        Male Maori                        Male Pacific Peoples             Female European
                        Female Maori                      Female Pacific Peoples

Interestingly as seen from the graph over the page and the one above - the wage gap and the
pay (including self-employment) gap are materially the same for all groups except European or
Pākehā women3. For them self-employment is statistically significant and combining it with wage
income seems to almost halve the gap faced by this group. One explanation for this could be that
for women in highly paid professions, self-employment is a mechanism to remove any female
discount.4

Public v Private Sector Wage Gap

                                 Gender wage gap- public v private sector
    18.5%
    16.5%
    14.5%
    12.5%

                                                        Source:Stats NZ QEX 002AA

                                                      Public Sector             Private Sector

3‘European’ is the term used by Stats NZ.
4A recent English study looking at the pay gap for Veterinarians ironically found that managers who felt there was no pay gap
were more likely to perpetuate in in practice than those whose felt a structural pay gap based on unconscious bias existed.
https://psychcentral.com/news/2020/06/30/gender-bias-kept-alive-by-people-who-think-its-dead/157701.html
3                                                                                     CTU Monthly Economic Bulletin – July 2020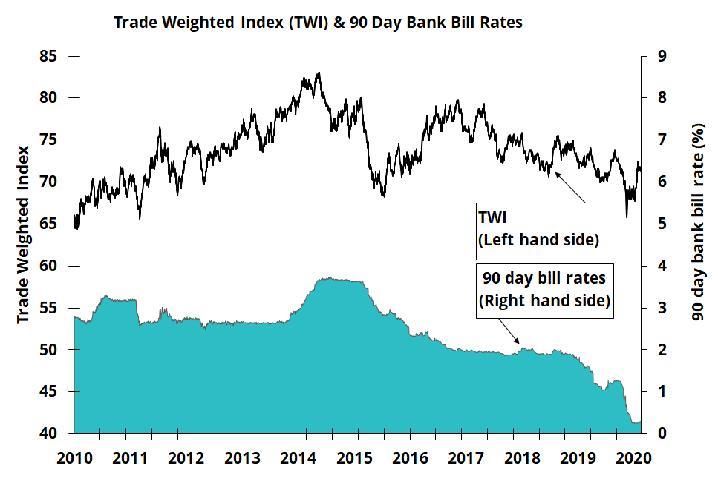
But the real equity gains are with low paid workers which have been a focus in the pay equity
settlements in the State Sector. 5 These are the incomes that support families and can be the
difference between material hardship and not.

Female Labour Force Participation

Couples with children who are both in paid work are only 1.9 % of those whose households are in
poverty. This rises to 13.5% when only one of the partners are employed.6

Such findings are consistent with the steadily increasing female labour force participation rate
since 1986 indicating that two incomes are increasingly needed to avoid material hardship.

                                       Female Labour Force Participation
                 64
                 62
    Percentage

                 60
                 58
                 56
                 54
                      1986         1990            1995             2000             2005             2010            2019
                                                       Source: Stats NZ HLF035AA

Early Childhood Education

Which then means that the recent debate and concern over the quality, cost and accessibility of
early childhood education is all the more important as the (unpaid) work of caring for children
hasn’t gone away with the increased numbers of women in the paid workforce.7

Ironically, the Early Childhood Education workforce itself – one that is dominated by women –
also has its own pay parity issues as teachers, other than the ones in Kindergartens, are paid less
than Primary School teachers. And to make matters worse, due to the complex devolved
contracting model, the recent funding increase to improve the pay of the lowest paid teachers –
might not end up going to the teachers concerned, contrary to the intent of the government.

5 These settlements seem to be reducing the gap in both the Public and the Private Sector as the original Care and Support claim,
while part of the contracted Public Sector, is classified as Private by Stats NZ.
6 Table 8 https://www.hrc.co.nz/files/8215/7462/2882/In-Work_Poverty_Report_2019.pdf
7 Since 1986 the male labour force participation rate has fallen by 4.3% (from 79.4% to 75.1% in 2019). However, there was a

6.2% fall between 1986 and 1992 which accounts for most of this change.
4                                                                              CTU Monthly Economic Bulletin – July 2020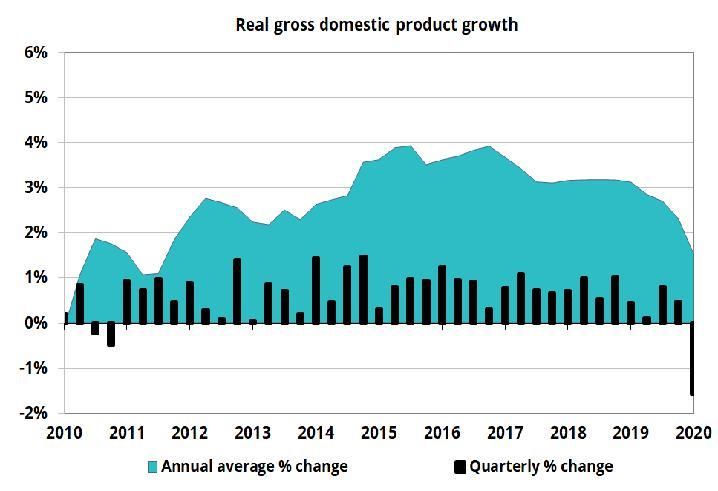
Pay transparency

So the passing of the Bill is a good start. Other things that need to happen are:

    •    removing the – often – opaque barriers to well-paid male dominated occupations8
    •    reducing the cost, increasing the quality and accessibility of early childhood education
         and well as
    •    potentially banning requests for salary history. Such a ban in Massachusetts appears to
         have had an impact on the race and gender wage gap.

Pay transparency, however, is key to making further progress.
As individuals or unions, we are unable to easily uncover the level of the gap attributable to
discrimination without information. And one of the first things that is ever taught in any ECON
101 class is the importance of information in properly functioning markets.
In recent work by the Human Rights Commission, they found that almost half of the participants
had been paid less than someone else doing the exact job. Transparency was very effective in
policing the wage subsidy and as someone under a collective agreement whose pay is currently
transparent to her colleagues, I struggle to see what the issue is with it.

As always, I welcome feedback to andreab@nzctu.org.nz.

Kia Kaha
Andrea

The NZIER consensus forecast was released on 15 June 2020

        Annual Percentage Change (March Year)                          2019/20      2020/21       2021/22       2022/23

        GDP                                                               1.7          -9.0           6.9          4.3

        CPI                                                               2.5           0.2           1.1          1.6
        Private Sector average hourly wage                                3.4           1.3           1.9          2.1
        Employment                                                        1.5          -5.0           3.1          3.1

        Unemployment rate (% of labour force)                             4.2           8.2           7.2          4.2

8 The recent initiative to make some trades and occupations training free is a good example. Many of the trades listed are
traditionally male dominated ones. Without specific initiatives to ensure women and girls equally undertake this training, there is
a risk that this enhances the current occupational segregation with continued consequent effect on the gender wage gap.
5                                                                               CTU Monthly Economic Bulletin – July 2020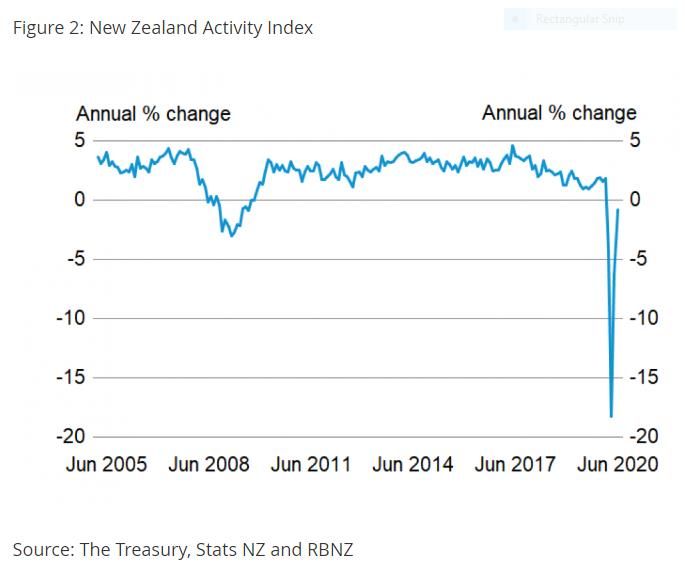
Further Resources
https://women.govt.nz/sites/public_files/Advice%202018.04.10%20Economic%20modeling%20of%20imp
acts%20of%20pay%20equity%20on%20GPG.pdf Economics of pay equity
https://motu.nz/our-work/population-and-labour/individual-and-group-outcomes/parenthood-
and-labour-market-outcomes
https://www.payscale.com/data/racial-wage-gap-for-men
https://treasury.govt.nz/publications/ap/ap-18-03-html#section-6 Ethnic pay gap

http://motu-www.motu.org.nz/wpapers/19_02.pdf Pacific Migrants experience
https://www.mpp.govt.nz/assets/Uploads/Pou-Matawaka-Final-Report-Ethnic-Pay-Gap-March-2019-for-
release-.pdf

http://cevepnz.org.nz/Gender%20pay%20gap/gender-ethnicity.htm CEVEP ethnic wage gap
https://workresearch.aut.ac.nz/__data/assets/pdf_file/0005/350654/Pacific-In-Work-Poverty-Report.pdf
Pasifika in-work poverty

https://treasury.govt.nz/publications/wp/wp-18-02 Gender Budgeting
https://www.rnz.co.nz/news/national/396287/early-childhood-education-standards-too-low-researcher
Bedford, M. (2019). Contractual Model for ECE Governance and Service Provision.

http://www.bu.edu/articles/2016/gender-pay-equity/ Calculating Gender Pay Equity

6                                                             CTU Monthly Economic Bulletin – July 2020

Economic Indicators – July 2020
This month sees the numbers of people on the Jobseeker Support, Covid Income Relief Payment,
as well as the level of wage subsidy plateau, albeit at much higher numbers than last year.
The House Share and Bond markets all continue to rise, in some cases, to levels higher than pre
Covid. All presumably as a result of the low interest rates caused from the quantitative easing by
the Reserve Bank.
The Consumer and Household Living Cost Price indexes fall or tail off largely due to the decrease
in petrol prices. Rent and Food, however, continue to increase in price with the effect that the
price inflation for those on lower incomes also continues to be higher than for those on higher
incomes.

The Stats NZ survey that provides the official data on employment – Household Labour Force
Survey - for June won’t be out until next month. In the meantime, there are several proxies for
the state of the employment market.

Both the new New Zealand Activity index

7                                                           CTU Monthly Economic Bulletin – July 2020
and the weekly employment indicators based on tax data from Inland Revenue show an
employment market, below its peak, but returning to pre lockdown levels. The question,
however, will be what is the outcome once the full effect of the wage subsidy is removed?

1) Claimants of Jobseeker Support and Covid Income Relief Payment

8                                                         CTU Monthly Economic Bulletin – July 2020
The Jobseeker recipients seem to have plateaued at 50,000 people more than last year with an
additional 20,000 recipients of the Covid Income Relief Payment (CIRP). While the Jobseeker
recipients may still have some paid work they do not include anyone who has a partner earning
more than the fulltime minimum wage. CIRP recipients may, however, have a partner earning up
to $102,000 but they can’t be undertaking any paid work themselves.
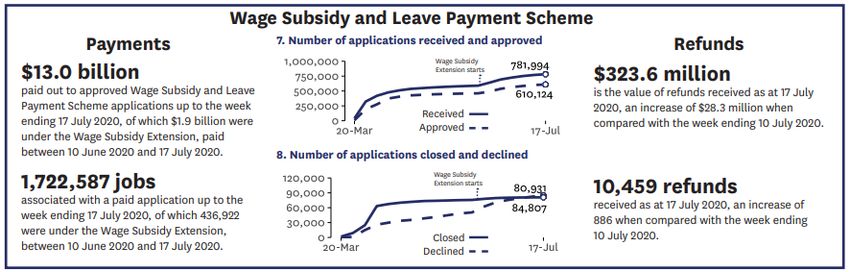
2) Wage Subsidy
This also seems to have plateaued at $13 billion and 1.7 million associated jobs.
3) Rent, Food and CPI.
Annual Change in Cost of Rent and Food v. CPI
8% Rent- flow
Percentage Change on Same Month Previous
Food
6% CPI
4%
Year
2%
0%
-2%
2010M06
2011M06
2012M06
2013M06
2014M06
2015M06
2016M06
2017M06
2018M06
2019M06
2020M06
Source: Stats NZ CPI009AA, CPI045AA and CPI004AA rebased to 2010
The Consumer Price Index fell by 0.5% in the June 20 quarter because of cheaper petrol and
hotel rooms. The last time the CPI was negative was in the December 15 quarter which was also
as a result of a decline in petrol prices.
9 CTU Monthly Economic Bulletin – July 2020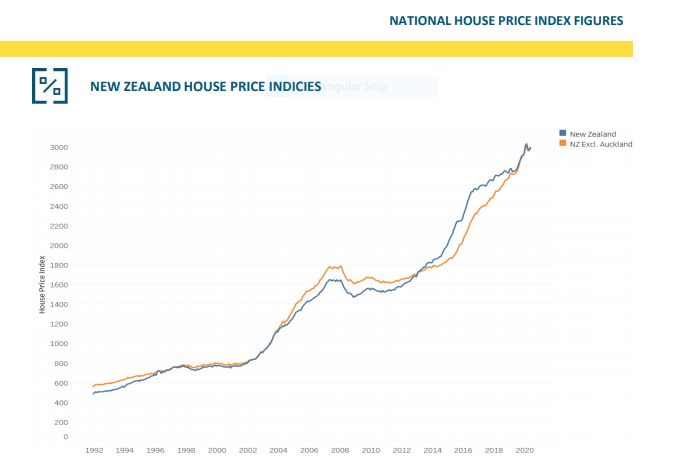
However, the food and rent component of the index still rose with the food index increasing by
0.5% and the rent index (flow) increasing by 0.3% in June 2020.
Rent and Food Indexes v. CPI
145
Rent- flow
Index Rebased Jan 2010 = 100
140
Food
135
CPI
130
125
120
115
110
105
100
2010M06
2011M06
2012M06
2013M06
2014M06
2015M06
2016M06
2017M06
2018M06
2019M06
2020M06
Source: Stats NZ CPI009AA, CPI045AA and CPI004AA rebased to 2010
4) Household Living Cost Price indexes
Consistent with the CPI, the Household Living Cost Price indexes also fell. However also
consistent with the pre-lockdown trend, the cost of living for those on lower incomes continued
to be higher than for those on higher incomes. This is because food and rent which are a higher
proportion of the budget for low income people continued to rise while interest rates and hotel
rooms – a greater proportion of the budget for higher income people – fell.
Annual Change in Household Living-Cost Price Index v. CPI
6% CPI
Percentage Change on Same Quarter
Lowest 20% by income
5%
Highest 20% by income
4%
Previous Year
3%
2%
1%
0%
-1%
2010Q2
2011Q2
2012Q2
2013Q2
2014Q2
2015Q2
2016Q2
2017Q2
2018Q2
2019Q2
2020Q2
Source: Stats NZ CPI009AA and NPI001AA rebased to 2010
10 CTU Monthly Economic Bulletin – July 2020Household Living-Cost Price Index v. CPI
125 CPI
Index Rebased Q1 2010 = 100
Lowest 20% by income
Highest 20% by income
120
115
110
105
100
2011Q2
2012Q2
2013Q2
2014Q2
2015Q2
2016Q2
2017Q2
2018Q2
2019Q2
2020Q2
Source: Stats NZ CPI009AA and HPI001AA rebased to 2010
5) The sharemarket
At 27 July 2020, the sharemarket had almost – 11500 v 12,000 – recovered to its peak in late
February 2020.
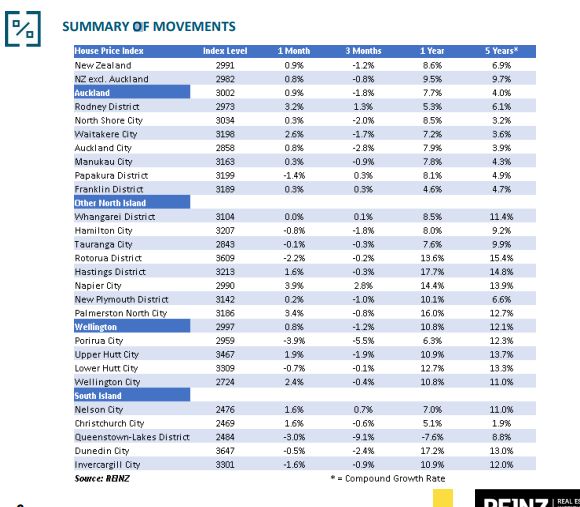
11 CTU Monthly Economic Bulletin – July 20206) Bonds9 Still up. 7) House prices10 Still up over the year but if you squint you can see the 1.2% drop over the lockdown period but with a slight rise of 0.9% again in June. To date there is little sign of any effect of a decline in demand I had hoped for in March when we were initially locked down. 9 For bonds, usually it is the yields that are tracked rather than the price of the bonds and so it can be difficult to find out what is happening to the price. As a proxy I am looking at the exchange traded fund for New Zealand bonds. 10https://www.reinz.co.nz/Media/Default/Statistic%20Documents/2020/June/REINZ%20Monthly%20HPI%20Report%20- %20June%202020.pdf https://treasury.govt.nz/publications/weu/weekly-economic-update-17-july-2020-html 12 CTU Monthly Economic Bulletin – July 2020
13 CTU Monthly Economic Bulletin – July 2020
Notes
This bulletin is available online at http://www.union.org.nz/economicbulletin220. For further information
contact Andrea Black

14                                                              CTU Monthly Economic Bulletin – July 2020
Monthly Economic Review
July 2020

                                              2018/19      2019/20

    Economic Growth                             3.1%         1.5%     Annual average GDP Growth (March year)

    Unemployment                                4.1%         4.2%     Unemployment Rate (March quarter)

    Inflation                                   1.5%         2.5%     Annual Inflation Rate (March year)

    Current Account Deficit                    $10.8b       $8.5b     Current Account Deficit (March year)

    Interest Rates                             1.50%        0.25%     Official Cash Rate (6 July)

Latest data and events
New Zealand’s gross domestic product contracted by 1.6 percent in the March 2020 quarter, the largest quarterly
contraction since the March 1991 quarter. Thirteen of 16 industries recorded a reduction in value-added output in the
quarter. Investment in residential buildings and other fixed assets fell substantially, while the external sector added to
growth (as the volume of imported goods and services fell by a larger degree than exported volumes). Annual average
GDP growth fell to 1.5 percent over the year ended March 2020.

The current account deficit was $1.6 billion in the March 2020 quarter in seasonally adjusted terms. Services export
revenues fell by $460 million in the March quarter, due to a $342 million reduction in spending by international visitors and
students, and an $83 million reduction in transportation export services. The value of goods imported fell by $352 million
in the quarter with a reduction in imported consumer goods, while the value of exported goods rose by $261 million (with
an increase in fruit, milk powder, butter and cheese exports). The annual current account deficit was $8.5 billion (equivalent
to 2.7 percent of gross domestic product).

Tourism spending in May 2020 at $1,057 million was 48 percent lower than the same month a year earlier according to
MBIE. Those Regional Tourism Organisations (RTO) areas with the largest percentage decline in tourism spending in May
2020 compared with May 2019 included Fiordland, Queenstown, along with the Mackenzie and Wellington regions.
Nationally, in the year ended May 2020, tourism spending was 11 percent lower than the previous year.

The Monetary Policy Committee of the Reserve Bank agreed to continue its $60 billion Large Scale Asset Purchase
programme on 24 June. The Committee also decided to keep the official cash rate at 0.25 percent, in line with its
announcement on 16 March to keep the official cash rate at this level “for at least the next 12 months”. The Committee also
announced that it would favour an expansion of the Large Scale Asset Purchase programme rather than further reductions
in the official cash rate if additional monetary policy stimulus was required.

Households have increased their bank deposit holdings as a result of COVID-19, with significant increases in transactional
and savings account balances during the months of March and April. Individuals also paid back their personal consumer
loans with lending institutions during those two months, with the total value of personal loans outstanding falling in March
and April (but these have since risen by 0.5 percent in May).

The Treasury has launched a New Zealand Activity Index, which is a composite index that tracks eight separate indicators
of economic activity. According to the Index, economic activity in May 2020 was 6.5 percent lower than a year earlier. This
was an improvement upon April’s index level, which was 19 percent lower than a year earlier.

Topic of the month: Māori businesses

Parliamentary Library, Research and Information                          July 2020 (latest data as at 6 July 2020)   1
Economic growth
Background
A country’s gross domestic product (GDP) is a measure of economic activity during a period of time, normally reported on
a quarterly and an annual basis. It is the sum of money values of all final goods and services produced in an economy. The
primary indicator used for tracking economic growth over time is known as real gross domestic product, or real GDP. Real
GDP is gross domestic product adjusted for changes in prices. New Zealand’s official gross domestic product figures are
sourced from Stats NZ.
Gross domestic product
Gross domestic product contracted by 1.6 percent in the
March 2020 quarter, the largest quarterly contraction in
economic activity in 29 years, as the economy felt the
initial impacts of COVID-19.
Thirteen of the 16 industry groups recorded a
contraction in economic activity in the March quarter.
The construction industry contracted by 4.1 percent in
the quarter with building sites closing during the
lockdown. Economic activity in the transport, postal,
and warehousing industry contracted by 5.2 percent in
the quarter. This industry was significantly impacted by
the restrictions on travel.
BNZ-Business New Zealand Apr-20 May-20
Annual average GDP growth was 1.5 percent in the Performance of Manufacturing
25.9 39.7
Index
year ended in the March 2020 quarter, compared with
3.1 percent a year earlier. Performance of Services Index 25.7 37.2
Seasonally adjusted. A figure over 50 indicates an expansion in
Other data activity.
The Treasury has launched a New Zealand Activity Source: BNZ-Business New Zealand.
Index which is a composite of eight indicators covering
consumer spending, unemployment, job vacancies, Year ended March 2020 Nominal GDP
traffic volumes (light and heavy traffic), electricity Gross Domestic Product $314,027 million
generation, business outlook and manufacturing GDP per capita $63,504
activity. The index for May was 6.5 percent lower than
Source: Stats NZ.
for May 2019 (having been 19 percent lower in April
than a year earlier).
ANZ Business Outlook Survey May-20 Jun-20
Outlook
Treasury now expects gross domestic product to contract General ‘Business Confidence’ -41.8 -34.4
by around 20 percent in the June quarter (an improvement Own ‘Activity Outlook’ -38.7 -25.9
on the 23 percent contraction forecast in the Budget Net percentage expecting an improvement in 12 months’ time.
Economic and Fiscal Update 2020). The OECD has Source: ANZ Bank, Business Outlook survey.
forecast that the New Zealand economy will
contract by nearly nine percent in 2020, assuming there are no further COVID-19 outbreaks (and contract by ten percent
if there is a second global wave of outbreaks in the fourth quarter of 2020).
GDP growth (%) Mar-19 Jun-19 Sep-19 Dec-19 Mar-20
Annual average (year-on-year) 3.1 2.9 2.7 2.3 1.5
Quarterly (seasonally adjusted) 0.4 0.1 0.8 0.5 -1.6
Source: Stats NZ.
Next Release: Gross Domestic Product: June 2020 quarter. Date: 17 September 2020.
Parliamentary Library, Research and Information July 2020 (latest data as at 6 July 2020) 2Employment and Unemployment
Background
The unemployment rate measures the number of people unemployed as a proportion of those in the labour force. The
labour force is the number of people of working age (15 years and over) who are working for wages or a salary, working
for a family business, or who are unemployed and seeking work. In New Zealand, the official unemployment rate is sourced
from Stats NZ’s quarterly Household Labour Force Survey (produced as part of its Labour Market Statistics).
Labour market
Numbers unemployed and the unemployment rate
New Zealand’s unemployment rate rose 0.2 percentage
180 8
points to 4.2 percent in the March 2020 quarter, with
160 7
116,000 people unemployed (in seasonally adjusted
(%sa)
sa)
terms). The labour force expanded by 0.9 percent in the 140 6
120
quarter, resulting in an increase in unemployment
Unemployment rate
5
Thousands (000s,
100
despite an increase in employment. Growth in part-time 4
80
employment accounted for two-thirds of employment 3
60
growth in the quarter.
40 2
Other data 20 1
The number of filled jobs rose by 0.8 percent in May 0 0
according to Stats NZ’s Employment Indicators. This 2010 2011 2012 2013 2014 2015 2016 2017 2018 2019 2020
followed a 1.6 percent drop in April and 0.2 percent fall Unemployed (left-hand side) Unemployment rate (right-hand side)
in March. Stats NZ noted that filled jobs numbers
included those covered by the wage subsidy scheme.
Stats NZ also mentioned that those aged 15 to 24 years ANZ Business Outlook Survey May-20 Jun-20
were more significantly hit by the job losses in April (and Net % expecting to increase -42.4 -34.7
had a harder time filling jobs in May). employment in their business in
12 months*
The number of those receiving Jobseeker Support was
*equal to the % of respondents expecting an increase minus the %
190,456 on 26 June, up 45,795 from mid-March, but
expecting a decrease. Source: ANZ Bank.
slightly lower than the early June peak of 190,607. For
those receiving Jobseeker Support and are work ready, Quarter Mar-19 Mar-20
the largest percentage increase has been for those
Average ordinary time weekly
aged 20 to 29 years. $1,215.54 $1,257.23
earnings for FTEs (pre-tax) ($)
There has been some improvement in firms’ Labour Cost Index - % change in
employment intentions in the ANZ Business Outlook salary and wage rates (including
+2.0 +2.5
survey over the last two months. However, a net 35 overtime) from the same
percent of firms still expect to reduce employment quarter of the previous year
levels in their firm over the coming 12 months. Source: Stats NZ.
Outlook
The Treasury now expects an unemployment rate of around 7.5 percent in the June 2020 quarter. The unemployment rate
is forecast to peak in either the September or December 2020 quarters, with forecasts from 7.7 percent (ASB), 8 percent
(Westpac), about 9 percent (Treasury), and 10 percent (ANZ and BNZ).
Household Labour Force Survey Mar-19 Jun-19 Sep-19 Dec-19 Mar-20
Unemployment Rate (seasonally adjusted, %) 4.1 4.0 4.1 4.0 4.2
Employment Growth (annual, %)* 1.3 1.4 0.8 0.8 1.6
*change since the same quarter of the previous year based on seasonally adjusted data. Source: Stats NZ.
Next Release: Labour Market Statistics: June 2020 quarter. Date: 5 August 2020
Parliamentary Library, Research and Information July 2020 (latest data as at 6 July 2020) 3Inflation
Background
Inflation is the change in prices of goods and services over a certain period of time. The official rate of consumer inflation
is measured by Stats NZ’s Consumers Price Index (CPI). The CPI tracks the price of a basket of household goods and
services over time on a quarterly basis.
Consumers Price Index
Annual inflation, at 2.5 percent in the year ended in the
March 2020 quarter, was the highest annual inflation
rate recorded since the year ended in the September
2011 quarter (which was impacted by the rise in the
goods and services tax rate from 12.5 percent to 15
percent from 1 October 2010).
Annual inflation was driven by annual non-tradables
inflation (i.e. domestic inflation) which was 3.4 percent
in the year ended in the March 2020 quarter. Stats NZ
said that high domestic inflation was influenced by
“higher prices for rents, cigarettes and tobacco,
construction of new houses, and local authority rates”.
Other data
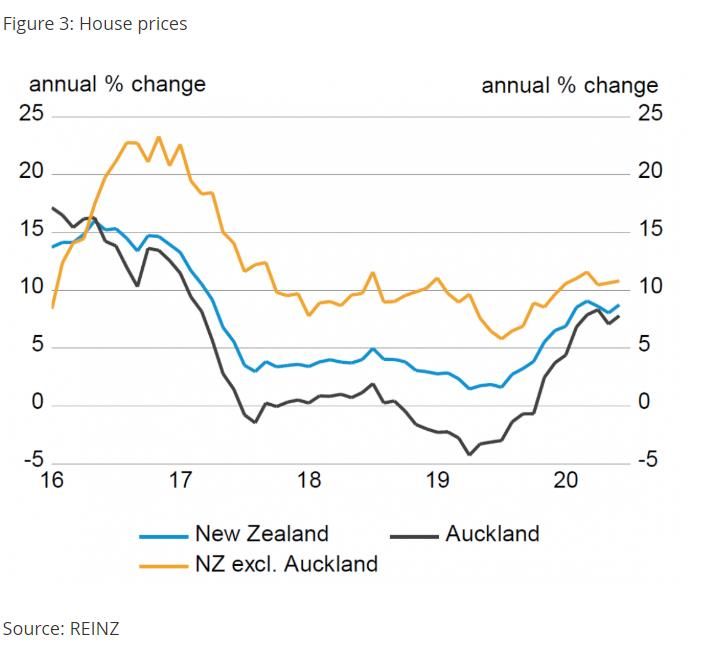
The national median house price was $620,000 in May
according to the REINZ. The REINZ House Price Index Annual Percentage Change (%) Apr-20 May-20
rose by 7.9 percent over the year. There were 3,990 Quotable Value – Residential property
7.1 7.7
properties sold in May, a decline of 46.6 percent over values*
the year earlier, due to Alert Level 3 restrictions during REINZ House Price Index** 8.5 7.9
part of the month making it difficult to sell properties.
Food Price Index** 4.4 2.9
The median number of days taken to sell a property
*change since the same three months ended in the month of the
rose to 58 days in May (compared to 41 days in May
previous year **change since the same month of the previous year.
2019). Sources: Quotable Value; REINZ; Stats NZ.
OneRoof and its data partner Velocity has reported
ANZ Business Outlook Survey May-20 Jun-20
that house prices have fallen by one percent since the
Net % of respondents expecting to
lockdown commenced on 25 March. Prices in the -2.0 -0.3
increase prices in 3 months’ time*
Queenstown Lakes district have fallen by 7.7 percent,
and 5.7 percent on the West Coast region. Inflation expected in 12 months’ time 1.30 1.44
*equal to the % of respondents expecting an increase minus the %
Outlook expecting a decrease. Source: ANZ Bank.
The Reserve Bank has reported that a higher New
Zealand dollar is dampening the outlook for inflation, along with lower domestic and international economic activity. NZIER
Consensus Forecasts has annual inflation declining “sharply over the coming year before recovering in subsequent years”.
Average annual inflation of 0.2 percent has been forecast for the year ended March 2021.
Inflation (%) Mar-19 Jun-19 Sep-19 Dec-19 Mar-20
Consumers Price Index - Annual 1.5 1.7 1.5 1.9 2.5
Tradables inflation -0.4 0.1 -0.7 0.1 1.5
Non-tradables inflation 2.8 2.8 3.2 3.1 3.4
CPI - quarterly 0.1 0.6 0.7 0.5 0.8
Source: Stats NZ.
Next Release: Consumers Price Index: June 2020 quarter. Date: 16 July 2020
Parliamentary Library, Research and Information July 2020 (latest data as at 6 July 2020) 4External
Background
The balance of payments is the record of the receipts and payments between a country’s residents and the rest of the
world, over a given period. The current account is that part of a country’s balance of payments which embraces its
transactions of goods, services, primary income (i.e. international income), and secondary income (i.e. current transfers
such as foreign aid). A “balance of payments deficit” refers to a deficit of the current account.
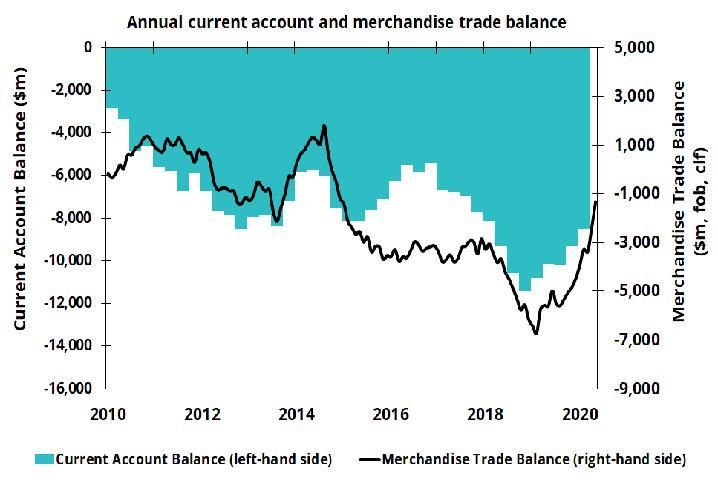
Current account balance
New Zealand’s seasonally adjusted current account
deficit for the March 2020 quarter was $1.6 billion, $372
million lower than the previous quarter. The
improvement in the deficit was driven by a $613 million
improvement in the goods balance. There was an
increase in the value of fruit exports in the quarter
(especially for kiwifruit), while milk powder, butter and
cheese export values also rose. The value of imported
consumption goods fell in the quarter.
The annual current account deficit was $8.5 billion in
the year ended 31 March 2020, equivalent to 2.7
percent of gross domestic product.
Other data Annual Change (%) May-20 Jun-20
New Zealand’s international investment position was
World Commodities Prices* -8.2 -5.2
negatively impacted by the decline in international equity
prices in the March quarter. At 31 March 2020, the net NZ$ Commodities Prices* -1.4 -1.5
liability position was $182 billion, an increase of $10.1 Overseas Visitors** -14.0 (Apr) n/a
billion from the position on 31 December 2019. The *change since the same month of the previous year. **change since the
number of international visitors arriving in April 2020 was previous year-end. Sources: Stats NZ; ANZ.
1,721, compared with 307,409 a year
earlier. Stats NZ estimated that there were approximately 125,000 to 145,000 visitors in New Zealand as at 5 June.
Outlook
The ANZ expects the current account deficit will average around 2.5 percent of GDP over the next couple of years. The
deterioration in international tourism revenues is expected to be offset by lower debt servicing costs due to lower interest
rates, buoyant demand for goods exports (particularly for food products), and weak domestic demand. Higher equity prices
in the June quarter will unwind some of the deterioration in New Zealand’s net liability position.
Balances ($m) Mar-19 Jun-19 Sep-19 Dec-19 Mar-20 Apr-20
Quarterly Current Account (seasonally adjusted) -2,495 -2,346 -2,550 -1,926 -1,554 n/a
Annual Current Account -10,801 -10,164 -10,189 -9,341 -8,506 n/a
Goods -4,564 -3,894 -4,198 -3,895 -3,139 n/a
Services 4,625 4,308 4,181 4,163 4,042 n/a
Primary income (i.e. investment income) -10,559 -10,084 -9,564 -8,946 -8,773 n/a
Secondary income (i.e. current transfers) -303 -494 -608 -662 -637 n/a
Net international investment position (as at date) -163,922 -166,704 -171,170 -171,895 -182,036 n/a
Annual Merchandise Trade Balance (FOB-CIF)* -5,739 -4,987 -5,321 -4,467 -3,383 -1,327
* FOB – Free on board, the value of goods at New Zealand ports before export. CIF – Cost of goods imported, including insurance and
freight to New Zealand. Source: Stats NZ.
Next Release: Balance of Payments: June 2020 quarter. Date: 16 September 2020
Parliamentary Library, Research and Information July 2020 (latest data as at 6 July 2020) 5Finance
Background
The trade weighted index (TWI) is an index of the New Zealand dollar’s value against a basket of 17 overseas currencies,
where each currency is weighted by a combination of the size of the associated country’s bilateral merchandise trade with
New Zealand (including the Euro area) and their gross domestic product. The Official Cash Rate (OCR) is the interest rate
that applies to overnight borrowing and lending between banks and the Reserve Bank. The S&P/NZX 50 is the main share
index of the New Zealand Exchange. It tracks changes in the share prices of the top 50 publicly listed companies by free
float market capitalisation on the NZX market. It is a gross index, so it includes the payout of dividends in its calculation.
Recent trends & data
As per the Reserve Bank’s announcement in March that
it was keeping the official cash rate at 0.25 percent “for
at least the next 12 months”, the Bank’s Monetary
Policy Committee kept the official cash rate at 0.25
percent on 24 June. The Committee also announced
that it was continuing its Large Scale Asset Purchase
programme of purchasing New Zealand Government
Bonds, Local Government Funding Agency Bonds, and
New Zealand Government Inflation-Indexed Bonds.
The size of the programme is currently set at $60 billion.
Both borrower and depositor retail interest rates have
fallen in recent months. While floating mortgage rates
have fallen by 70 - 76 basis points, fixed mortgage
rates have fallen by less. Term deposit rates have also Core Crown borrowing as at 30-Apr-20 30-Apr-20
fallen, with deposit rates for a $10,000 deposit ranging ($m) (%GDP)
from 0.39 percent (one year) through to 2.15 percent Gross sovereign-issued debt * 92,871 29.9
for a term of 18 months or five years. These deposit
Net core Crown debt ** 78,758 25.3
rates are particularly unfavourable (especially net of
tax) when compared with the current annual inflation *Excluding Reserve Bank settlement cash and Reserve Bank bills.
rate of 2.5 percent. ** Excluding NZ Super Fund and other advances. Source: The
Treasury.
Outlook
The Reserve Bank has said that it is willing to provide additional stimulus, such as increasing the size of its asset purchase
programme or using additional monetary policy tools, if necessary. ANZ expects that the size of the asset purchase
programme will rise to $90 billion, while Westpac believes it will be expanded to $100 billion in order to keep interest rates
low. A negative official cash rate has not been ruled out, although ASB believes the Reserve Bank will utilise other monetary
policy tools first. Westpac expects an official cash rate of -0.5 percent next year.
Monthly averages Feb-20 Mar20 Apr-20 May-20 Jun-20
90 Day Bank Bill rate 1.18 0.71 0.39 0.26 0.28
10 Year Government Bond yields (secondary market) 1.28 1.08 0.95 0.64 0.90
Floating mortgage rate* 5.26 4.50 4.50 4.50 n/a
SME overdraft rate* 9.09 8.50 8.53 8.35 n/a
Trade Weighted Index (TWI) exchange rate 71.37 68.77 68.49 68.94 71.60
S&P/NZX50 index 11715 10120 10339 10752 11178
*Last business day of the month. Sources: Reserve Bank; NZX.
Next Official Cash Rate (OCR) decision: 12 August 2020
Parliamentary Library, Research and Information July 2020 (latest data as at 6 July 2020) 6International
Background
New Zealand’s economic growth rate, unemployment rate and central bank interest rates are compared with our main
OECD trading partners. The first table below illustrates the seasonally adjusted quarterly growth rates in economic activity.
The second table below shows the harmonised unemployment rate in each OECD country/area, while the third shows the
main central bank interest rates for various countries (and the Euro).
Economic growth
Quarterly economic growth rates (%) OECD Composite Leading Indicators are pointing to a
Country* Sep-19 Dec-19 Mar-20 sharp slowdown of the global economy, although the
Australia 0.6 0.5 -0.3 Chinese economy is showing initial positive signs. The
Japan 0.0 -1.9 -0.6
OECD mentioned that there was considerable
uncertainty surrounding outlook, given the impact of
NEW ZEALAND 0.8 0.5 -1.6
lockdowns on each country’s economy (and the transition
United Kingdom 0.5 0.0 -2.0 out of lockdowns).
United States 0.5 0.5 -1.3
While noting a high degree of uncertainty around its
Euro area 0.3 0.1 -3.6 forecast, the International Monetary Fund (IMF) expects
OECD Total 0.4 0.2 -1.8 the global economy to contract by 4.9 percent in 2020.
China** 1.4 1.5 -9.8 COVID-19 is having a more negative impact on economic
* Seasonally adjusted growth rate from the previous quarter. ** non- activity than initially forecast. The speed of the economic
OECD. Source: OECD. recovery is also forecast to be more gradual than
previously expected.
Harmonised unemployment rates (%)
Unemployment
Country Apr-20 May-20 Jun-20
The unemployment rate within the OECD is projected to
Australia 6.4 7.1 n/a have risen to around 11.5 percent in mid-2020.
Japan 2.6 2.9 n/a Unemployment levels are forecast to “moderate
NEW ZEALAND 4.2 (qtr) n/a n/a gradually” as economies reopen, but will remain
substantially higher than prior to the outbreak.
United Kingdom 3.8 (Mar) n/a n/a
United States 14.7 13.3 Central banks
11.1
The Australian Reserve Bank Board noted in early June
European Union 6.6 6.7 n/a
that the Bank’s policy package was helping to lower
OECD Total 8.5 n/a n/a funding costs and support the economy. As such, it
Source: OECD. reaffirmed a cash rate target of 0.25 percent, targeting a
yield of 0.25 percent for three-year Government
bonds, and the provision of funding for businesses (especially SMEs) through the Bank’s Term Funding Facility.
Central Bank interest rates (as at 6 July)
Central Bank Key Rate Interest Rate Effective from Direction (Basis
(%) points)
Australia Cash Rate 0.25 20-Mar-20 -25
China Loan Prime Rate 3.85 20-Apr-20 -20
European Central Bank Main Refinance Rate 0.00 16-Mar-16 -5
Japan Uncollateralized overnight rate -0.10 to 0.00 16-Feb-16 -10
NEW ZEALAND Official Cash Rate 0.25 16-Mar-20 -75
United Kingdom Bank Rate 0.10 19-Mar-20 -15
United States Federal Funds Rate 0.00 to 0.25 16-Mar-20 -75
Source: Central Bank interest rates as at the date stated.
Parliamentary Library, Research and Information July 2020 (latest data as at 6 July 2020) 7Topic of the month
Māori businesses
Stats NZ has released Tatauranga umanga Māori – Statistics on Māori businesses, which provides information on Māori
businesses in 2019.
Māori authorities
There were 1,200 Māori authorities in 2019, which are businesses involved in the collective management of assets held by
Māori. Of these, about a third were involved in the non-residential property industry, and around a quarter were involved in
the primary industries. These Māori authorities employed 12,300 employees as at February 2019, which is a head count of
all salary and wage earners.
Proportion undertaking selected business activity (2019, %)
Activity Māori Māori small to
authority medium enterprise
Export sales 27 28
Tourism sales 27 17
Investment expansion 45 36
Research and Development 18 18
Source: Stats NZ. Tatauranga umanga Māori: 2019.
In the 2019 calendar year, Māori authorities exported a total of $741 million, with $354 million of exports going to China.
Fish, crustaceans and molluscs were a significant export commodity for Māori authorities, with exports totalling $365 million
in 2019.
Māori small to medium enterprises
There were 492 Māori small to medium sized enterprises in 2019, which were predominantly located within the
manufacturing; agriculture, forestry and fishing; and business services industries. Māori small to medium sized enterprises
have fewer than 100 employees, and are not Māori authorities. These enterprises had 9,900 employees in 2019.
Māori small and medium sized enterprises exported $202 million worth of commodities in 2019, with $48 million of exports
to Australia. Eighteen percent of Māori small and medium sized enterprises undertook research & development (R&D) in
2019, with the same proportion of Māori authorities also undertaking R&D during the year.
Employee count, number of filled jobs and commodity exports
Business type Employee count Filled jobs (Dec- Commodity exports
(Feb-2019) 2018 quarter) ($m, YE Dec-19)
Māori authority 12,300 12,610 741
Māori small to medium enterprises 9,900 12,780 202
Māori tourism * 11,100 10,490 ..
All New Zealand businesses 2,285,000 2,165,740 59,899
Notes: * Māori tourism businesses may be either Māori authorities or Māori SMEs.
Commodity exports are shown for the year ended 31 December 2019 on a Free on Board basis (the value of goods at NZ ports before
export and include re-exports). Source: Stats NZ. Tatauranga umanga Māori: 2019.
Grant Cleland
Research Services Analyst - Economics
Parliamentary Library, Research and Information
ISSN 1176-5860 (Print) ISSN 1178-1300 (Online)
This work is licensed under the Creative Commons Attribution 4.0 International licence. In essence, you are free to copy, distribute and
adapt the work, as long as you attribute the work to the Parliamentary Service and abide by the other licence terms. To view a copy of this
licence, visit: https://creativecommons.org/licenses/by/4.0/.
Parliamentary
Parliamentary Library, Research
Library, and Information
Research and Information February 2020 (latest
July data
2020as at(latest
11February
data2020)
as at 6 July 2020) 8You can also read


