TERMINALLY CHALLENGED: Addressing the Infrastructure Funding Shortfall of America's Airports - Airports Council ...

 
CONTINUE READING
TERMINALLY CHALLENGED: Addressing the Infrastructure Funding Shortfall of America's Airports - Airports Council ...
2 01 9 -20 2 3   T E R M I N A L LY    CHA LLE N GED :
                 Addressing the Infrastructure Funding Shortfall of America’s Airports
TERMINALLY CHALLENGED: Addressing the Infrastructure Funding Shortfall of America's Airports - Airports Council ...
Table of Contents
                    Executive Summary .  .  .  .  .  .  .  .  .  .  .  .  .  .  .  .  .  .  .  .  .  .  .  .  .  .  .  .  .  .  .  .  .  .  .  .  .  .  .  .  .  .  .  .  .  .  .  .  .  .  .  .  .  .  .  .  .  .  .  . 5

                    ACI-NA Estimate of Airport Infrastructure Needs  .  .  .  .  .  .  .  .  .  .  .  .  .  .  .  .  .  .  .  .  .  .  .  .  .  .  .  .  .  .  . 17

                    Project Development Costs by Location and Type  .  .  .  .  .  .  .  .  .  .  .  .  .  .  .  .  .  .  .  .  .  .  .  .  .  .  .  .  . 25

                    Comparison of ACI-NA and FAA Estimates .  .  .  .  .  .  .  .  .  .  .  .  .  .  .  .  .  .  .  .  .  .  .  .  .  .  .  .  .  .  .  .  .  .  .  .  . 33

                    Conclusion .  .  .  .  .  .  .  .  .  .  .  .  .  .  .  .  .  .  .  .  .  .  .  .  .  .  .  .  .  .  .  .  .  .  .  .  .  .  .  .  .  .  .  .  .  .  .  .  .  .  .  .  .  .  .  .  .  .  .  .  .  .  .  .  .  .  .  . 35

                    Appendix 1: Scope and Methodology .  .  .  .  .  .  .  .  .  .  .  .  .  .  .  .  .  .  .  .  .  .  .  .  .  .  .  .  .  .  .  .  .  .  .  .  .  .  .  .  .  . 37

                    Appendix 2: Background .  .  .  .  .  .  .  .  .  .  .  .  .  .  .  .  .  .  .  .  .  .  .  .  .  .  .  .  .  .  .  .  .  .  .  .  .  .  .  .  .  .  .  .  .  .  .  .  .  .  .  .  .  . 38

                    Appendix 3: How ACI-NA Calculated Infrastructure Development Costs .  .  .  .  .  .  . 39

                    Appendix 4: FAA Definitions of Airport Categories  .  .  .  .  .  .  .  .  .  .  .  .  .  .  .  .  .  .  .  .  .  .  .  .  .  .  .  . 43

                    Appendix 5: About This Report .  .  .  .  .  .  .  .  .  .  .  .  .  .  .  .  .  .  .  .  .  .  .  .  .  .  .  .  .  .  .  .  .  .  .  .  .  .  .  .  .  .  .  .  .  .  .  . 46
TERMINALLY CHALLENGED: Addressing the Infrastructure Funding Shortfall of America's Airports - Airports Council ...
Tables
          Table 1: Airport Infrastructure Cost Estimates by Year and Airport Category  .  .  .  .  .  . 17

          Table 2: Average Annual Cost Estimate from

                           Published ACI-NA Infrastructure Needs Reports . . . . . . . . . . . . . . . . . . . . . . . . 18

          Table 3: Development Costs by Project Location  .  .  .  .  .  .  .  .  .  .  .  .  .  .  .  .  .  .  .  .  .  .  .  .  .  .  .  .  .  .  .  .  . 25

          Table 4: Development Costs by Project Type  .  .  .  .  .  .  .  .  .  .  .  .  .  .  .  .  .  .  .  .  .  .  .  .  .  .  .  .  .  .  .  .  .  .  .  .  . 27

          Table 5: ACI-NA Sample Compared to Industry Total  .  .  .  .  .  .  .  .  .  .  .  .  .  .  .  .  .  .  .  .  .  .  .  .  .  .  .  .  . 39

          Table 6: ACI-NA Sample Infrastructure Development Costs Per Enplanement .  .  . 40

          Table 7: Total Infrastructure Development Costs Estimate

                           for Large, Medium, and Small Hub Airports .  .  .  .  .  .  .  .  .  .  .  .  .  .  .  .  .  .  .  .  .  .  .  .  .  .  .  .  . 40

          Table 8: Total Infrastructure Development Costs Estimate . . . . . . . . . . . . . . . . . . . . . . . 41

          Table 9: ACI-NA Total Costs by Project Type  .  .  .  .  .  .  .  .  .  .  .  .  .  .  .  .  .  .  .  .  .  .  .  .  .  .  .  .  .  .  .  .  .  .  .  .  . 42

Figures
          Figure 1: 5-Year Development Estimates from Published

                             ACI-NA Infrastructure Needs Reports  .  .  .  .  .  .  .  .  .  .  .  .  .  .  .  .  .  .  .  .  .  .  .  .  .  .  .  .  .  .  .  .  .  . 18

          Figure 2: Consumer Price Index (CPI) Indicates Continued Inflation  .  .  .  .  .  .  .  .  .  .  .  .  . 20

          Figure 3: CCI Exceeds CPI Over the Next Five Years .  .  .  .  .  .  .  .  .  .  .  .  .  .  .  .  .  .  .  .  .  .  .  .  .  .  .  .  .  .  . 21

          Figure 4: FAA Projects Continued Strong Growth in Passengers .  .  .  .  .  .  .  .  .  .  .  .  .  .  .  .  .  . 22

          Figure 5: FAA Projects Continued Growth in Air Cargo . . . . . . . . . . . . . . . . . . . . . . . . . . . 23

          Figure 6: Airport Infrastructure Needs by Type of Development .  .  .  .  .  .  .  .  .  .  .  .  .  .  .  .  .  . 26

          Figure 7: Change In Development Cost from 2016/2017 ACI-NA Report .  .  .  .  .  .  .  .  .  . 28
TERMINALLY CHALLENGED: Addressing the Infrastructure Funding Shortfall of America's Airports - Airports Council ...
$128,131,000,000
 Infrastructure needs across America’s airport system through 2023.
TERMINALLY CHALLENGED: Addressing the Infrastructure Funding Shortfall of America's Airports - Airports Council ...
Executive Summary
Airports are Terminally Challenged                                          While passenger and cargo traffic through airport facilities continues
                                                                            to grow at a record pace, our outdated aviation infrastructure is not
America’s airports are a fundamental component of our nation’s              keeping up with demand. As a result, far too many airports around
transportation infrastructure. In 2017, 1.7 billion passengers and          the country are overcrowded and cramped. This survey shows that
31.7 million metric tons of cargo traveled through U.S. airports. With      America’s airports require more than $128 billion in infrastructure
a national economic impact of $1.4 trillion, airports contribute more       upgrades by 2023, with more than 56 percent of the needs inside
than seven percent to the U.S. gross domestic product and support           our aging terminals.
over 11.5 million jobs around the country. To meet the capacity
demands of the future with safe, efficient, and modern facilities           Inadequate airport infrastructure that fails to meet the growing
that passengers and cargo shippers expect, airports need to make            needs of local businesses and tourists puts in jeopardy the
new investments to maintain and modernize our nation’s airport              continued economic growth of American cities, states, and regions.
infrastructure.                                                             From established metropolitan areas to burgeoning growth regions
                                                                            to small communities, sustained economic growth depends on the
                                                                            expansion of, and investment in, local airports. As the U.S. economy
                                                                            recovered from the significant economic downturn experienced
                                                                            during the Great Recession, the national unemployment rate has
            1.7 billion passengers                                          decreased and personal discretionary spending has increased.
                                                                            As such, enplanements nationwide have dramatically improved,
                                                                            growing at a compound annual growth rate of 3.8 percent between
                                                                            2013 and 2017, putting further pressure on our already overloaded
            31.7 million metric tons of cargo                               airport facilities.

                                                                            Airport investment also promotes much-needed competition in
                                                                            the airline industry. New investments in airports can be valuable
   $        $1.4 trillion economic impact
                                                                            tools in helping local communities attract new air carriers, which
                                                                            increases competition and leads to lower airfares for passengers.
                                                                            Airports need additional resources to build the terminals, gates, and
            11.5 million jobs                                               ramps necessary to attract new air carriers and allow existing ones

                                                                         Terminally Challenged: Addressing the Infrastructure Funding Shortfall of America’s Airports   |   5
TERMINALLY CHALLENGED: Addressing the Infrastructure Funding Shortfall of America's Airports - Airports Council ...
to expand service. The traveling public gets more choices and lower                                    Addressing the Infrastructure Funding Shortfall
airfares when airports can build the facilities that provide more airline
options and more service alternatives.                                                                 With America’s airports facing more than $128 billion in new
                                                                                                       infrastructure needs across the system and a debt burden of $91.6
In addition to the impact on local economies, deferred airport                                         billion from past projects, it is time to find the means to rebuild our
investment over the past two decades has challenged the ability of                                     nation’s aviation infrastructure and improve the passenger experience
airports to deal with the evolving threats posed to aviation security.                                 for millions of travelers.
We live in vastly different times than when most U.S. airports were
built, and the airports we have today simply were not designed and                                     It is a common misconception that airports are funded with taxpayer
outfitted for a post-9/11 world that requires us to maximize both                                      dollars or a general tax on all citizens. In reality infrastructure projects
efficiency and security.                                                                               at U.S. airports are funded primarily with federal grants through the
                                                                                                       FAA’s Airport Improvement Program (AIP), a local user-fee called
Airports call on Congress to modernize the outdated federal cap on                                     the Passenger Facility Charge (PFC), and airport-generated revenue
the Passenger Facility Charge (PFC) in order to give airports more                                     from tenant rents and fees. Airports often turn to capital markets to
flexibility to self-finance and leverage private investment without the                                debt-finance projects, using both PFC-revenue and airport-generated
need for additional taxpayer dollars. Air travelers and shippers would                                 revenue to repay the bonds. Traditionally AIP grants – which prioritize
greatly benefit from airports having the ability to generate more                                      safety improvements – have been used on airfield projects, while
local revenue for terminals, gates, runways, and taxiways that would                                   PFC user fees – with greater funding flexibility – have gone towards
increase capacity, stimulate competition, enhance safety and security,                                 terminal, ground-access, and major-runway projects. In the case of
and improve the overall passenger experience.                                                          PFCs, airports often have committed this revenue-stream for years or
                                                                                                       decades into the future to repay past projects, meaning they have no
                                                                                                       new money coming into the system to fund future projects.

6   |   Terminally Challenged: Addressing the Infrastructure Funding Shortfall of America’s Airports
TERMINALLY CHALLENGED: Addressing the Infrastructure Funding Shortfall of America's Airports - Airports Council ...
Thus, under the industry’s current financing-funding model airports
lack stable, predictable funding sources that keep pace with travel
growth, rising construction costs, and inflation for these intensive
capital projects. The PFC cap – last adjusted in 2000 – has seen its
purchasing power eroded by 50 percent in the past two decades. And
federal airport grants through the AIP have been stagnant for nearly
a decade, and will remain so for another five years under the recently
enacted FAA reauthorization legislation. Moreover, many airports         With America’s airports facing more than $128 billion
– even those with sterling credit ratings – have reached their debt
capacity and either cannot finance new projects or have had to phase     in new infrastructure needs across the system and
in their projects over a longer timeframe, increasing the costs and
                                                                         a debt burden of $91.6 billion from past projects,
delaying the benefits for passengers.
                                                                         it is time to find the means to rebuild our nation’s
Fortunately, we can rebuild America’s airports without raising taxes
or adding to deficit spending by modernizing the federal cap on the      transportation infrastructure and improve the
PFC. Modestly adjusting the federal cap on local PFCs would allow
                                                                         passenger experience for millions of travelers.
airports to take control of their own investment decisions and become
more financially self-sufficient. Airports could build the appropriate
facilities – terminals, gates, baggage systems, security checkpoints,
roadways, and runways – to meet the travel demands and customer
expectations of their community.

                                                                                                                                |   7
TERMINALLY CHALLENGED: Addressing the Infrastructure Funding Shortfall of America's Airports - Airports Council ...
It is important to note that PFCs are not taxes – they are local
user fees determined locally and used locally to help pay the
costs of building airport infrastructure that benefits customers
by improving the passenger experience and spurring airline                                             Inadequate airport infrastructure
competition. PFCs are imposed by states or units of local
government that own or operate airports; so they are not collected                                     that fails to meet the growing needs of local
by the federal government, not spent by the federal government,
                                                                                                       businesses and tourists puts in jeapordy the
and not deposited into the U.S. Treasury. Instead, PFCs go directly
to fund local airport projects approved by the FAA with input from                                     continued economic growth of American
airlines and local communities.
                                                                                                       cities, states and regions.
At a time of mounting pressure to reduce federal spending,
modernizing the federal government’s PFC cap is the simplest and
most free-market option for providing airports with the locally
controlled self-help they need to finance vital infrastructure
projects. It would allow airports of all sizes to reduce costs and
start building essential infrastructure projects more quickly to meet
the travel demands of today and challenges of tomorrow.

8   |   Terminally Challenged: Addressing the Infrastructure Funding Shortfall of America’s Airports
TERMINALLY CHALLENGED: Addressing the Infrastructure Funding Shortfall of America's Airports - Airports Council ...
Terminally Challenged: Addressing the Infrastructure Funding Shortfall of America’s Airports   |   9
TERMINALLY CHALLENGED: Addressing the Infrastructure Funding Shortfall of America's Airports - Airports Council ...
Top 10 Projects in 2019-2023
                                                                                                                PROJECT COSTS IN
AIRPORT CODE   HUB SIZE   PROJECT NAME                                                                       BILLIONS IN 2018 DOLLARS

LAX               L       Automated People Mover                                                                        $ 2.60
                          A 2.25 mile elevated guideway with 6 stations to solve the traffic congestion
                          around the airport, part of LAX’s Landside Access Modernization Program (LAMP)

LAX               L       North Terminal Program                                                                        $ 1.81
                          Renovations to Terminal 2, and the demolition and reconstruction of Terminal 3
                          after Delta Air Lines relocated to Terminal 2-3 from Terminal 5-6.

MCO               L       South Terminal Complex - Phase 1 Terminal C                                                   $ 1.72
                          Phase 1 of the new terminal project, adding 19 gates capable of accommodating
                          24 more aircraft

EWR               L       Terminal A Redevelopment - Terminal                                                           $ 1.70
                          Building a 33-gate terminal to replace the existing Terminal A to accommodate an
                          anticipated 13.6M annual passengers by 2027

LAX               L       Midfield Satellite Concourse                                                                  $ 1.55
                           A new 1.6-billion concourse addition to the Tom Bradley International Terminal
                          (TBIT) featuring 12 aircraft gates as well as a Baggage Optimization Project
PROJECT COSTS IN
AIRPORT CODE   HUB SIZE   PROJECT NAME                                                                                    BILLIONS IN 2018 DOLLARS

EWR               L       Rehabilitation of Taxiway W                                                                                             $ 1.47
                          And Portions Of Taxiways A and B
                          Renewing and maintaining the Taxiways in a state of good repair and ensuring
                          efficient, safe and secure operations

LGA               L       Construction of Air Train                                                                                               $ 1.40
                          A 1.5-mile-long people mover system and elevated railway to connect LGA with
                          the NYC’s subway and Long Island Rail Road (LIRR)

SFO               L       Terminal 1 Program                                                                                                      $ 1.36
                          The redevelopment of the 50-year-old Harvey B. Milk Terminal (Terminal 1) to
                          meet the needs of modern travelers and revolutionize the guest experience

SLC               L       SLC Terminal Redevelopment Program North Concourse                                                                      $ 1.36
                          Adding 30 gates to replace the aging facility and accommodate the traffic that is
                          more than double its design capacity

LAX               L       LAMP-Consolidated Rent-A-Car (ConRAC)                                                                                   $1.30
                          A P3 project to relocate over 20 existing rental car locations scattered around the
                          airport area to a 5.3-million-sqaure-feet facility, part of the LAMP

                                                              Terminally Challenged: Addressing the Infrastructure Funding Shortfall of America’s Airports   |   11
RESULTS IN BRIEF
The ACI-NA total estimate of airports’ infrastructure needs for 2019                                    the healthy U.S. economy and increasing traffic demand, and airline
through 2023, adjusted for inflation1, is $128.1 billion or $25.6 billion                               consolidation and concentration on hub operations.
annualized.2 About 65.9 percent of the development is intended
to accommodate growth in passenger and cargo activity, and 27.8                                         The ACI-NA total estimate includes all airport improvements that
percent is intended to rehabilitate existing infrastructure, maintain                                   are planned within the next five years including those not eligible
a state of good repair, and keep airports up to standards for the                                       for AIP grants. Commercial-service airports4, which accounted
aircraft that use them.                                                                                 for 99.8 percent of passenger enplanements in 2017, account for
                                                                                                        $113.7 billion (88.7 percent) of the total $128.1 billion for planned
This estimate is a 28.3 percent increase over the 2017 estimate                                         investments, while non-commercial-service airports with 0.2 percent
of $99.9 billion or $20 billion annualized for 2017 through 2021.                                       of the 2017 enplanements account for $14.5 billion (11.3 percent) of
The estimate for large, medium and small hubs only3 is a 34.0                                           the total $128.1 billion. Within the commercial-service airports:
percent increase over the last estimate. For non-hub, non-primary
commercial service, reliever and general aviation airports, ACI-NA
relied on the FAA National Plan of Integrated Airport System (NPIAS)
                                                                                                        Q large hub airports
2017 estimate for development costs, which are expected to increase                                             72.0% of all enplanements, $81.1 billion of all total needs
by 4.3 percent from the last report completed in 2016.

The $25.6 billion in average annual funding needs for U.S. airports
                                                                                                        Q medium hub airports
is significantly higher than the funding available through annual                                               16.2% of all enplanements, $17.5 billion of all total needs
AIP grants, PFC collection, and airport generated net income. It
is clear that the existing funding system cannot meet U.S. airport
infrastructure needs for modernizing and expanding airport capacity
                                                                                                        Q small hub airports
which is critical for a safe, efficient and globally competitive aviation                                       8.3% of all enplanements, $9.4 billion of all total needs
system.

ACI-NA attributes the increase in airport infrastructure needs to
                                                                                                        Q non-hub airports
several factors, including the need to upgrade aging infrastructure,                                            3.4% of all enplanements, $5.7 billion of all total needs

12   |   Terminally Challenged: Addressing the Infrastructure Funding Shortfall of America’s Airports
Commercial service airports reported a significant increase in            Most small hubs reported moderate increases in infrastructure needs.
infrastructure needs, with an overall increase of 34.0 percent while      Major developments at Albany, Huntsville, Reno, Madison, Fresno,
non-commercial service airports had a 4.9 percent increase. All           Sarasota, Palm Springs and Savannah resulted in an increase of over
airport categories showed growth from the previous estimate.              50 percent in their infrastructure improvement programs.
Medium hubs reported the most significant increase at 49.5 percent
followed by large hubs with a 34.3 percent increase.                      The overall increase shows that, as a result of the healthy economy
                                                                          and increasing traffic demand, coupled with airline consolidation and
Medium hubs reported an increase of 49.5 percent, from                    their strategic shift to focus on hub operations, large and medium
$11.7 billion to $17.5 billion, and increased their share of total        hub airports have a particular need to invest in major infrastructure
development by 2 percent from the 2016/17 survey. Significant             improvement projects. Despite a decrease in flights at many small
development was identified at Burbank, Pittsburgh, San Jose, Austin,      airports, additional funding is still needed at these airports for
Indianapolis, Omaha, Southwest Florida, Jacksonville, Milwaukee           upgrading aging infrastructure, meeting federal mandates, and
and Dallas Love Field, with more than a 50 percent increase as these      improving the passenger experience.
airports undertake major infrastructure improvement programs.

Large hubs reported an increase of 34.4 percent, from $60.4 billion
to $81.1 billion, and increased their share of total development          1   ACI-NA used a 1.5 percent inflation adjustment.

needs by close to 3 percent. Significant development was identified       2   The ACI-NA total estimate of airports’ infrastructure development needs for the
at New York John F. Kennedy, Newark Liberty and LaGuardia, Denver,            period 2019 through 2023, in 2018 constant dollars, not adjusted for inflation, is
Washington Dulles, Tampa, Las Vegas, Baltimore/Washington,                    $122.5 billion or $24.5 billion annualized.
Orlando, and Charlotte with more than a 50 percent increase
                                                                          3   Development costs for large, medium and small hubs are based on ACI-NA
as these airports undertake major infrastructure improvement                  Survey data. Development costs for non-hub, non-primary commercial service,
programs. In addition, Los Angeles International Airport alone                reliever and general aviation airports are based on FAA 2019-2023 NPIAS
reported over $13 billion in infrastructure needs between 2019                report.
and 2023, primarily for terminal and concourse redevelopment
                                                                          4    ACI-NA used the FAA definitions for categories of airports. See Appendix 4.
and renovation, landside access modernization, and intermodal
transportation and consolidated rental car facilities.

                                                                       Terminally Challenged: Addressing the Infrastructure Funding Shortfall of America’s Airports   |   13
Top 5 Terminal Projects in 2019 - 2023
                                                                                                                                            PROJECT COSTS IN
AIRPORT CODE                HUB SIZE                  PROJECT NAME                                                                       BILLIONS IN 2018 DOLLARS

LAX                               L                   North Terminal Program                                                                       $ 1.81
                                                      Renovations to Terminal 2, and the demolition and reconstruction of Terminal 3
                                                      after Delta Air Lines relocated to Terminal 2-3 from Terminal 5-6.

MCO                               L                   South Terminal Complex - Phase 1 Terminal C                                                  $ 1.72
                                                      Phase 1 of the new terminal project, adding 19 gates capable of accommodating
                                                      24 more aircraft

EWR                               L                   Terminal A Redevelopment                                                                     $ 1.70
                                                      Building a 33-gate terminal to replace the existing Terminal A to accommodate an
                                                      anticipated 13.6 million annual passengers by 2027

LAX                               L                   Midfield Satellite Concourse                                                                 $ 1.55
                                                       A new 1.6-billion concourse addition to the Tom Bradley International Terminal
                                                      (TBIT) featuring 12 aircraft gates as well as a Baggage Optimization Project

SFO                               L                   Terminal 1 Program                                                                           $1.36
                                                      The redevelopment of the 50-year-old Harvey B. Milk Terminal (Terminal 1) to
                                                      meet the needs of modern travelers and revolutionize the guest experience

14   |   Terminally Challenged: Addressing the Infrastructure Funding Shortfall of America’s Airports
Top 5 Airside Projects in 2019 - 2023
                                                                                                                                   PROJECT COSTS IN
AIRPORT CODE   HUB SIZE   PROJECT NAME                                                                                       MILLIONS IN 2018 DOLLARS

EWR               L       Rehabilitation of Taxiway W (From Rm To U) And Portions                                                             $ 1,473
                          Of Taxiways A and B
                          Renewing and maintaining the Taxiways in a state of good repair and ensuring
                          efficient, safe and secure operations

BWI               L       Airfield Reconstruction                                                                                             $ 524
                          Airfield improvements on runways and taxiways, aircraft maintenance and
                          support facilities to meet FAA standards, enhance airfield safety and efficiency,
                          and accommodate existing and anticipated demand

ORD               L       Taxiway G Relocation                                                                                                $ 478
                          Part of the massive runway relocation project to increase the airside capacity

CLT               L       Fourth Parallel Runway                                                                                              $ 357
                          Part of the master plan to enhance the airfield capacity, including two end around
                          taxiways and the relocation of portions of West Boulevard and Old Dowd Road

EWR               L       Terminal A Redevelopment – Airside                                                                                  $ 277
                          Demolition and redevelopment of the existing Terminal A satellites, adjacent
                          airfield system and all associated infrastructure

                                                              Terminally Challenged: Addressing the Infrastructure Funding Shortfall of America’s Airports   |   15
Top 5 Access To Terminal Projects
                                    in 2019 - 2023
                                                                                                                                               PROJECT COSTS IN
AIRPORT CODE                HUB SIZE                  PROJECT NAME                                                                          BILLIONS IN 2018 DOLLARS

LAX                               L                   Automated People Mover:                                                                        $ 2.56
                                                      A 2.25 mile elevated guideway with 6 stations to solve the traffic congestion
                                                      around the airport, part of LAX’s Landside Access Modernization Program (LAMP)

LGA                               L                   Construction of Air Train:                                                                     $ 1.40
                                                      A proposed 1.5-mile-long people mover system and elevated railway to connect
                                                      LGA with the NYC’s subway and Long Island Rail Road (LIRR)

LAX                               L                   LAMP-Consolidated Rent-A-Car (ConRAC):                                                         $ 1.30
                                                      A P3 project to relocate over 20 existing rental car locations scattered around the
                                                      airport area to a 5.3 million-sqaure-feet facility, part of the LAMP

JFK                               L                   JFK Redevelopment:                                                                             $ 0.75
                                                      Infrastructural improvements to enhance the roadways on and off the airport

SAN                               L                   Airport Development Plan – Landside:                                                           $ 0.57
                                                      A duel-level roadway and curbfront separating the departing and arriving traffic
                                                      and a new on-airport entry roadway to divert traffic from the east

16    |   Terminally Challenged: Addressing the Infrastructure Funding Shortfall of America’s Airports
Terminally Challenged: Addressing the Infrastructure Funding Shortfall of America’s Airports   |   17
ACI-NA ESTIMATE OF AIRPORT
INFRASTRUCTURE NEEDS

Table 1: Airport Infrastructure Cost Estimates by Year and Airport Category

Millions of Current Year Dollars

Airport Category                         2019                       2020                      2021                 2022                   2023             2019-2023               Percent

Large hub                             $20,129                    $16,776                   $16,549              $13,982                 $13,630                81,066                63.3%

Medium hub                             $3,142                     $2,705                     $3,313              $3,441                 $4,935                  17,537               13.7%

Small hub                              $2,385                      $1,999                    $1,651              $2,043                   $1,319                9,398                 7.3%

Non-hub                                $1,099                       $1,115                   $1,132               $1,149                 $1,166                 5,660                4.4%

Other*                                $2,809                       $2,851                   $2,893               $2,937                  $2,981                 14,471               11.3%

Total                                $29,563                     $25,446                   $25,539               $23,551               $24,032                 128,131              100.0%

Source: ACI-NA Survey and FAA NPIAS Report.
*Note: “Other” includes non-commercial service airports and 7 proposed airports based on FAA NPIAS report (2019-2023).

                                                                                                        As shown in Table 1, total infrastructure needs for each year from
                                                                                                        2019 through 2023 range from $23.6 billion in 2022 to $29.6 billion in
                                                                                                        20195, with average annual needs of $25.6 billion as shown in Table 2.

                                                                                                        5   See appendix 3 for an explanation of how ACI-NA calculated airports’
                                                                                                            infrastructure development costs.

18   |   Terminally Challenged: Addressing the Infrastructure Funding Shortfall of America’s Airports
Figure 1: 5-Year Total Airport Industry Infrastructure Needs
                                                                           Estimates from Published ACI-NA Infrastructure Needs Reports

                                                                           Billions of Current Year Dollars
Table 2: Average Annual Cost Estimate from Published
                                                                                     150
ACI-NA Infrastructure Needs Reports

Millions of Current Year Dollars
                                                                                     120
Estimate                     Average Annual          Percent Change
Period                    Infrastructure Needs        from Previous
                                                         Report
                                                                                       90
2019-23                            $25,626                28.3%

2017-21                            $19,974                31.9%

2015-19                            $15,148                6.3%
                                                                                       60
2013-17                            $14,254                -11.0%

2011-15                            $16,015                -15.1%

                                                                                                         2013 - 2017

                                                                                                                        2015 - 2019

                                                                                                                                       2017 - 2021

                                                                                                                                                             2019 - 2023
Source: ACI-NA Survey.                                                                 30

Table 2. Large hub airports account for the majority of these costs                     0
with 63.3 percent of the total followed by medium hub airports and                                                                                   Source: ACI-NA Survey.

non-commercial service/new airports.
                                                                           Figure 1 shows a significant increase in airport infrastructure needs
                                                                           estimated for 2019-2023 in 2018, in response to the increasing travel
                                                                           demand and the need to upgrade aging infrastructure.

                                                                      Terminally Challenged: Addressing the Infrastructure Funding Shortfall of America’s Airports         |   19
Figure 2: Consumer Price Index (CPI) Indicates Continued Inflation

                                 300       Base Year is 1982 - 1984 = 100                                                                                            Year          Average Growth
                                                                                                                                                                  2006-2011                1.8%
                                                                                                                                                                  2012-2017                1.7%
     Consumer Price Index

                                                                                                                                                               		                    FAA Forecast
                                 250
                                                                                                                                                                  2017-2018                1.9%
                                                                                                                                                                  2019-2023               2.2%
                                                                                                                                                                 2018-2028                2.4%
                                                                                                                                                                 2018-2038                2.4%
                                 200

                                                                                                                                                               Source: Actual Consumer Price Index from the
                                                                                                                                                               US Dept. of Labor, Bureau of Labor Statistics (All
                                                                                                      Actual		               Forecast
                                                                                                                                                               items in U.S. city average, all urban consumers,
                                                                                                                                                               not seasonally adjusted). Forecast from the FAA
                                 150
                                              2008

                                                     2009

                                                            2010

                                                                   2011

                                                                          2012

                                                                                 2013

                                                                                        2014

                                                                                               2015

                                                                                                      2016

                                                                                                             2017

                                                                                                                    2018

                                                                                                                           2019

                                                                                                                                   2020

                                                                                                                                          2021

                                                                                                                                                 2022

                                                                                                                                                        2023
                                                                                                                                                               2018 Forecast Report, Table 2, based on IHS
                                                                                                                                                               Global Insight 30-Year Forecast.

ACI-NA adjusted its infrastructure development cost estimate by 1.5                                                               Compounding the general inflationary trend is the inflation rate
percent to account at least partially for inflation. As shown in Figure 2,                                                        for construction materials and components. As shown in Figure
inflation is projected to continue in the 2019 through 2023 development                                                           3, the “ENR Construction Cost Index (CCI)”6 data shows significant
cost estimate period.                                                                                                             construction cost escalation in recent years reaching above 4%
                                                                                                                                  in 2018. For the period 2019-2023, the predicted growth rate
                                                                                                                                  according to IHS Global Insight averages 2.0 percent.7

20             |            Terminally Challenged: Addressing the Infrastructure Funding Shortfall of America’s Airports
Figure 3: Construction Cost Experienced Significant Increase in Recent Years                                                                                            Year               % Change
                                                                                                                                                                        2008                   4.3
                            1.6
                                                                                                                                                                        2009                    3.1
                                  Base Year 2007 = 1
                                                                                                                                                                        2010                    2.7
                            1.5                                                                                                                                          2011                   3.1
                                                                                                                                                                        2012                    2.6
                                                                                                                                                                        2013                    2.6
                            1.4
                                                                                                                                                                        2014                    2.7
  Construction Cost Index

                                                                                                                                                                        2015                    2.3
                            1.3                                                                                                                                         2016                    3.0
                                                                                                                                                                        2017                    3.9

                            1.2
                                                                                                                                                                     Forecast
                                                                                                                                                                        2018                    4.1
                            1.1
                                                                                                      Actual		                       Forecast                           2019                    2.8
                                                                                                                                                                        2020                    2.3
                            1.0                                                                                                                                         2021                    1.8
                                    2008

                                           2009

                                                  2010

                                                         2011

                                                                2012

                                                                       2013

                                                                              2014

                                                                                     2015

                                                                                            2016

                                                                                                   2017

                                                                                                          2018

                                                                                                                 2019

                                                                                                                          2020

                                                                                                                                     2021

                                                                                                                                            2022

                                                                                                                                                   2023
                                                                                                                                                                        2022                    1.2
                                                                                                                                                                        2023                    1.8
                                     Source: Engineering News-Record/IHS Global Insight.

As FAA points out in the 2019-2023 NPIAS report, airport
infrastructure development needs are driven by current and
                                                                                                                                 6     ENR Construction Cost Index, U.S. 20 City Average, Engineering
forecasted traffic; use and age of facilities; and changing aircraft                                                                   News Record.
technology that requires airports to update or replace equipment
and infrastructure.8                                                                                                             7      IHS Global Insight Non-residential Construction Cost Index
                                                                                                                                       forecast as of March 2018.

                                                                                                                                 8     Executive Summary, FAA 2019-2023 NPIAS report.

                                                                                                                        Terminally Challenged: Addressing the Infrastructure Funding Shortfall of America’s Airports   |   21
Figure 4: FAA Forecasts Continued Strong Growth in Passengers                                                                                                                         Year        Enplanements
                                                                                                                                                                                      		            in Millions
                                                                                                                                                                                      2010             712.1
                                                      1000
     Scheduled Passenger Enplanements in Millions

                                                                                                                                                                                       2011            731.1
                                                       900                                                                                                                             2012           736.7

                                                       800                                                                                                                             2013           739.5
                                                                                                                                                                                      2014            757.0
                                                       700
                                                                                                                                                                                       2015           786.5
                                                       600                                                                                                                             2016            819.6

                                                       500                                                                                                                            2017E           840.4

                                                       400
                                                                                                                                                                                      		           FAA Forecast
                                                       300                                                                                                                             2018           879.9

                                                       200                                                                                                                             2019           908.7

                                                                                                                     Actual		                  Forecast                               2020            923.2
                                                       100
                                                                                                                                                                                       2021            934.1
                                                          0                                                                                                                           2022            947.8
                                                                 2008

                                                                        2009

                                                                               2010

                                                                                       2011

                                                                                              2012

                                                                                                     2013

                                                                                                            2014

                                                                                                                   2015

                                                                                                                          2016

                                                                                                                                 2017

                                                                                                                                        2018

                                                                                                                                                   2019

                                                                                                                                                          2020

                                                                                                                                                                 2021

                                                                                                                                                                        2022

                                                                                                                                                                               2023
                                                                                                                                                                                      2023            963.5
                                                                                                                                                                                      2026            1,013.7
                                                                  Source: FAA FY 2018-2038 Aerospace Forecasts, Table 5.                                                              2038            1,283.7

                                                                                                                                                   The demand for passenger and cargo service will continue to grow,
                                                                                                                                                   resulting in a corresponding increase in airport infrastructure development
                                                                                                                                                   costs. The FAA’s Aerospace Forecast Fiscal Years 2018-2038 predicts that
                                                                                                                                                   U.S. airlines will reach the one billion passengers-per-year mark by 2026.
                                                                                                                                                   The industry is expected to grow from 840.4 million passengers in 2017 to
                                                                                                                                                   1.3 billion in 2038, as shown in Figure 4; and more than double the cargo
                                                                                                                                                   traffic as measured by revenue ton miles, as shown in Figure 5.

22                        |                         Terminally Challenged: Addressing the Infrastructure Funding Shortfall of America’s Airports
Figure 5: FAA Forecasts Continued Growth in Air Cargo                                                                                                                                Year           Revenue Ton Miles
                                                                                                                                                                                  		                      in Millions
                                                                                                                                                                                     2010                   35,888
                                             $60,000
                                                                                                                                                                                      2011                  37,277
  Air Cargo Revenue Ton Miiles in Millions

                                                                                                                                                                                     2012                   36,557
                                             $50,000                                                                                                                                 2013                   34,818
                                                                                                                                                                                     2014                    35,169
                                             $40,000                                                                                                                                 2015                   35,801
                                                                                                                                                                                     2016                   35,483

                                             $30,000                                                                                                                                2017E                    39,172

                                                                                                                                                                                  		                    FAA Forecast
                                             $20,000
                                                                                                                                                                                     2018                   42,580
                                                                                                                                                                                     2019                   44,722
                                             $10,000
                                                                                                               Actual		              Forecast                                        2020                   46,658
                                                                                                                                                                                     2021                   48,768
                                                  0                                                                                                                                  2022                   50,783
                                                       2008

                                                              2009

                                                                     2010

                                                                            2011

                                                                                   2012

                                                                                          2013

                                                                                                 2014

                                                                                                        2015

                                                                                                                2016

                                                                                                                       2017

                                                                                                                              2018

                                                                                                                                       2019

                                                                                                                                              2020

                                                                                                                                                     2021

                                                                                                                                                            2022

                                                                                                                                                                   2023
                                                                                                                                                                                     2023                   52,774
                                                                                                                                                                                     2028                    62,551
                                                       Source: FAA FY 2018-2038 Aerospace Forecasts, Table 19.                                                                       2033                   75,065
                                                                                                                                                                                     2038                   89,629

                                                                                                                                       Terminally Challenged: Addressing the Infrastructure Funding Shortfall of America’s Airports   |   23
24   |   Terminally Challenged: Addressing the Infrastructure Funding Shortfall of America’s Airports
PROJECT DEVELOPMENT COSTS BY
LOCATION AND TYPE
To help provide a broad perspective on the various infrastructure                           Development Costs by Location9
development projects that airports are considering for 2019 through
2023, ACI-NA asked respondents to provide information on project                            As shown in Table 3, for 2019 through 2023, terminal projects
costs by location and type. Project location indicates whether                              represent 55.9 percent of the total infrastructure development costs
projects are for the airside, terminal, or ground access areas of                           for responding airports10, followed by airside projects that represent
the airport. Project type indicates whether projects are for access                         22.2 percent of total costs and ground access projects that represent
to terminal, airfield capacity, airfield standards, terminal building                       22.0 percent of total costs. Compared to the 2016/17 estimates,
development, environmental projects, airfield reconstruction, safety,                       terminal projects continue to represent over half of airports’
security, or construction of a new airport.                                                 infrastructure needs.

Table 3: Development Costs by Project Location

Project location                    Percentage for all                   Percentage for large             Percentage for medium                          Percentage for small
                                    hub respondents                       hub respondents                    hub respondents                              hub respondents

Terminal                                   55.9%                              58.2%                                  48.3%                                        44.9%

Airside                                    22.2%                              20.2%                                  26.7%                                         38.6%

Ground Access                             22.0%                                21.6%                                  25.1%                                        16.5%

Total*                                     100%                               78.7%                                   16.3%                                         5.0%

Source: ACI-NA Survey.
*Note: Summary excludes projects without a specified location code.

9		Includes all projects in this location. For example, projects located in terminal   10 See Appendix 5 for a full list of airport respondents.
   include all those in the terminal building including security projects.

                                                                                        Terminally Challenged: Addressing the Infrastructure Funding Shortfall of America’s Airports   |   25
Development Costs by Project Type                                                                       Figure 6: Airport Infrastructure Needs by Type of
                                                                                                        Development
Figure 6 shows that terminal building projects account for
37.1 percent of the total development needs of all airports for
2019 through 2023. Such projects are needed to accommodate
more passengers and larger aircraft, implement new security                                                         Access to Terminal			         Terminal Building
requirements, facilitate increased competition among airlines, and
enhance the passenger experience. Surface projects to improve
access options and relieve ground access congestion make up                                                                                                           ■
15.6 percent of all projected airport developments.
                                                                                                                                                                      ■
                                                                                                                                                                      ■
     n     Terminal Building 37.1%                                                                                                                                    ■
                                                                                                Reconstruction
     n     Access to Terminal 15.6%                                                                                                                                   ■
     n     Reconstruction 13.5%                                                                                                                                       ■
     n     Airfield Capacity 9.2%
                                                                                                                                                                      ■
     n     Standards 8.7%
                                                                                                                                                                      ■
     n     Other 6.4%
                                                                                                Airfield Capacity                                                     ■
     n     New Airports 4.0%
                                                                                                                                                                      ■
     n     Safety 2.8%

     n     Environment 1.6%
                                                                                                                    Standards
     n     Security 1.2%

                                                                                                                    Source: ACI-NA Survey.

26   |   Terminally Challenged: Addressing the Infrastructure Funding Shortfall of America’s Airports
As shown in Table 4, for 2019 through 2023 for large hub                                   For medium hub airport respondents, terminal building projects
airports, terminal building projects are the dominant project                              are also the dominant project type, representing 33.1 percent of all
type representing 46.1 percent of all projects, followed by access                         projects followed by reconstruction projects at 16.7 percent. New
to terminal projects at 21.0 percent and capacity projects at 9.4                          Orleans and Burbank reported having a long-term infrastructure
percent. Additionally, Salt Lake City reported having a terminal                           development plan that includes airport redevelopment categorized
redevelopment program categorized as “new airport” to replace                              as “new airport”. Small hub airport respondents reported that their
existing terminal facilities that were constructed 30 to 50 years ago                      dominant project type is terminal building projects at 36.3 percent,
and have reached the end of their useful life.                                             followed by capacity projects at 16.9 percent.

Table 4: Development Costs by Project Type

Airport Safety Security Reconstruction Standards Environment Capacity Terminal                                                       Access to          New         Other           Total
Category							                                                       Building                                                       Terminal         Airports

Large hub         1.9%          1.3%             6.6%              1.9%             1.3%              9.4%            46.1%             21.0%           4.4%         6.1%           100%

Medium hub       6.0%          0.8%             16.7%              2.0%             0.9%              9.5%            33.1%             10.1%           7.1%        13.7%           100%

Small hub        3.7%          3.2%             14.8%              3.2%             6.0%              16.9%           36.3%              8.1%           0.0%         7.7%           100%

Non-hub           6.1%         0.4%             34.7%              38.2%            2.2%              3.2%             11.7%            2.7%            0.0%        0.8%            100%

Other            2.3%          0.2%             38.8%              47.0%            0.8%              5.0%             1.5%              1.5%           2.1%        0.8%            100%

Total            2.8%           1.2%            13.5%              8.7%             1.6%              9.2%            37.1%             15.6%           4.0%        6.4%            100%

Sources: Large, Medium and Small- ACI-NA Survey and Non-hub and Others-FAA NPIAS.

                                                                                     Terminally Challenged: Addressing the Infrastructure Funding Shortfall of America’s Airports    |   27
Figure 7: Change in Development Cost                                                                          Billions of Dollars

from 2016/2017 ACI-NA Report

                                                                                                        $10

                                                                                                                    $20

                                                                                                                                    $30

                                                                                                                                          $40

                                                                                                                                                $50
                                                                                             0
Figure 7 shows that all projects except
                                                                        Terrminal Building
security have increased. Additionally, the
FAA 2019-2023 NPIAS report identifies seven
proposed airports that are anticipated to                              Access to Terminal
be developed over the five-year period,
including two new primary airports and five
                                                                            Reconstruction
non-primary airports.

                                                                                   Capacity
     n    2017 -2021
     n    2019 - 2023
                                                                                 Standards

                                                                                      Other

                                                                               New Airport

                                                                                      Safety

                                                                              Environment

                                                                                    Security

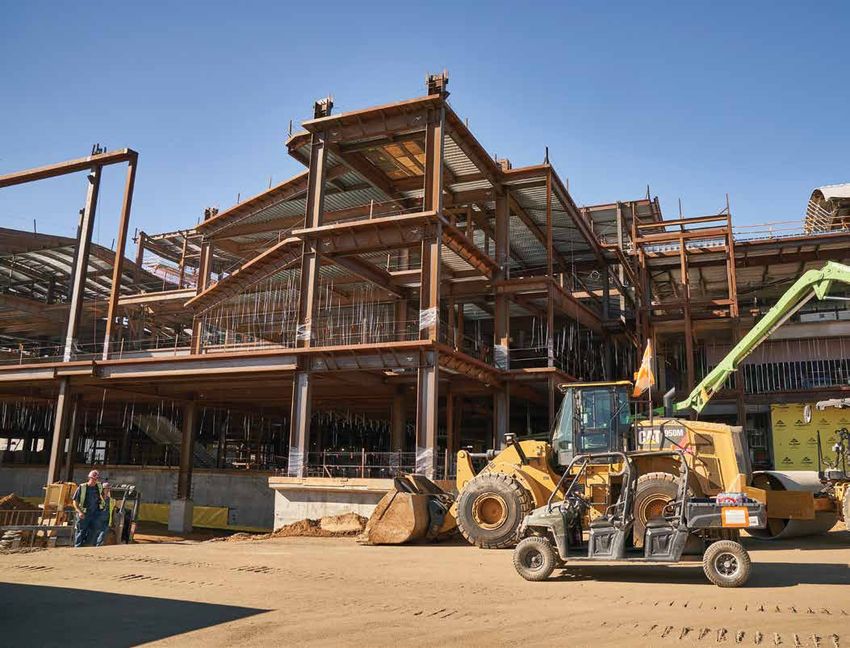
28   |   Terminally Challenged: Addressing the Infrastructure Funding Shortfall of America’s Airports
Project Spotlight:
SA N FR A NC I S C O I NT E R NATION AL AIR POR T

                                                                                                              Passenger Growth

                  IATA Code: SFO
                  2017 Enplanements: 55,822,129                                                                60

                  Hub Size: Large

                                                                                                               50

                                                                                     Millions of Passengers
                                                                                                               40
San Francisco International Airport (California)

San Francisco International Airport is redeveloping Terminal 1, The
                                                                                                               30
Harvey B. Milk Terminal, one of its oldest terminals, to expand capacity
to meet the needs of modern travelers and revolutionize the guest
experience. Terminal 1 was built in the early 1960s and over time
                                                                                                               20
has become less able to accommodate the millions of passengers
that it handles each year. The $2.4 billion project includes design and
construction of the pre-security concourse; post-security concourse                                            10
improvements with better passenger circulation and integrated

                                                                                                                      2010

                                                                                                                             2011

                                                                                                                                    2012

                                                                                                                                           2013

                                                                                                                                                  2014

                                                                                                                                                         2015

                                                                                                                                                                2016

                                                                                                                                                                       2017
technology to facilitate the passenger journey; new boarding areas
and passenger loading bridges; new concessions; new mezzanine with                                              0
connections to the AirTrain, public transit, and the Central Parking
Garage; and new post-security corridors connecting to other terminals
at the airport.

                                                                           Terminally Challenged: Addressing the Infrastructure Funding Shortfall of America’s Airports       |   29
Project Spotlight:
J OH N GL E NN C O L UM B US IN TE R N ATION AL AIR POR T

                                                                                                                                 Passenger Growth
                         IATA Code: CMH
                         2017 Enplanements: 7,576,592                                                                             8

                         Hub Size: Medium
                                                                                                                                  7

                                                                                                                                  6

                                                                                                        Millions of Passengers
John Glenn Columbus International Airport (Ohio)                                                                                  5

The John Glenn Columbus International Airport has developed
                                                                                                                                  4
a multibillion dollar redevelopment program – dubbed the “One
International Gateway” project – that includes a new terminal, a new
                                                                                                                                  3
rental car facility, and increased airport parking. These key elements will
greatly improve the overall traveler experience. The project also marks
a bold new chapter in the region’s future as it will fuel new economic                                                            2
growth and solidify the region’s position as a key global gateway for
Ohio. A year ago airport officials said they hoped a new terminal could                                                           1

                                                                                                                                         2010

                                                                                                                                                2011

                                                                                                                                                       2012

                                                                                                                                                              2013

                                                                                                                                                                     2014

                                                                                                                                                                            2015

                                                                                                                                                                                   2016

                                                                                                                                                                                          2017
be built in 15 to 18 years, but the current lack of available funding has
pushed that date further back. The current terminal turned 60 earlier                                                             0
this year.

30   |   Terminally Challenged: Addressing the Infrastructure Funding Shortfall of America’s Airports
Project Spotlight:
DES M O I NE S I NT E R NA T I ON AL AIR POR T

                                                                                                               Passenger Growth
                  IATA Code: DSM
                  2017 Enplanements: 2,578,308
                                                                                                                3.0
                  Hub Size: Small

                                                                                                                2.5

                                                                                      Millions of Passengers
                                                                                                                2.0
Des Moines International Airport (Iowa)

The Des Moines International Airport has prepared a Terminal Area
                                                                                                                1.5
Concept Plan in support of needed improvements to its aging and
overcrowded airport-terminal complex. The existing terminal building
was first built in 1948, and although it has been subject to upgrades and
                                                                                                                1.0
improvements over the years to keep up with demand, it has reached
the end of its useful economic life. The overall program calls for a new
terminal with expanded ticketing, security checkpoints, and gates, as                                           0.5
well as improvements to the airfield and ground-access to the airport.

                                                                                                                       2010

                                                                                                                              2011

                                                                                                                                     2012

                                                                                                                                            2013

                                                                                                                                                   2014

                                                                                                                                                          2015

                                                                                                                                                                 2016

                                                                                                                                                                        2017
The airside improvements include runway and taxiway modifications,
relocation of general aviation facilities, and expanding cargo and                                              0.0
aircraft-maintenance facilities. The landside improvements include a
complete overhaul of the roadway loop, modifications to existing parking
and rental car facilities, and a new parking structure to better connect
the new terminal to the remaining parking area.

                                                                            Terminally Challenged: Addressing the Infrastructure Funding Shortfall of America’s Airports       |   31
32   |   Terminally Challenged: Addressing the Infrastructure Funding Shortfall of America’s Airports
COMPARISON OF ACI-NA AND FAA ESTIMATES
The ACI-NA Infrastructure Needs Survey is far more comprehensive                         • Airport-funded air traffic control facilities and airport or
than the FAA NPIAS survey, which is also issued every two years. It                        TSA-funded security projects such as the in-line checked
is critical to understand the differences between the ACI-NA and FAA                       baggage screening system;
estimates because of the importance of the data in both surveys in
developing federal policy for funding airport development.                      n Second, the FAA estimate includes only those projects that do
                                                                                     not yet have an identified funding source, whereas the ACI-NA
The ACI-NA estimate of $128.1 billion is greater than the FAA NPIAS                  estimate includes all projects, whether or not they have an
estimate of $35.1 billion for several reasons:11                                     identified funding source. This results in current projects with
                                                                                     approved PFC collections not being included in the NPIAS
n First, the ACI-NA estimate includes all future projects, while the                 report;12
   FAA estimate includes only future AIP-eligible projects. Thus,
   the ACI-NA estimate captures projects not included in the NPIAS              n Third, the ACI-NA estimate uses more recent data than that
   report, such as:                                                                  used by the FAA;

      • Development eligible under the PFC program but ineligible               n Fourth, the ACI-NA estimate is adjusted for inflation, while the
        under the AIP grant program, such as terminal areas                          FAA estimate is not; 13 and
        related to the movement of passengers and their baggage,
        but leased by airlines (holdrooms, baggage claim, baggage               n Fifth, the ACI-NA estimate includes contingency costs (the
        makeup, etc.);                                                               common practice of provisioning for increases in costs based
                                                                                     on changes in design or construction uncertainty) while the
      • AIP-ineligible projects, including parking facilities, hangars,              FAA estimate does not.14
        cargo buildings, the revenue producing portions of
        passenger terminals, and certain improvements to highway                For example, the cost for projects at large hub airports in the
        and transit airport access systems;                                     NPIAS totals $8.3 billion while the ACI-NA estimate totals $81.1
                                                                                billion. Within this category, the NPIAS totals $1.4 billion for
      • AIP-eligible projects that airports did not report to the FAA           terminal building type projects while the ACI-NA estimate totals
        because the airport believes there is a low probability of              $37.4 billion. The difference in this case is because the NPIAS
        obtaining additional AIP discretionary grants; and                      generally does not include gates and related areas, or the

                                                                          Terminally Challenged: Addressing the Infrastructure Funding Shortfall of America’s Airports   |   33
revenue generating portions of terminals such as development
of facilities for non-aeronautical revenue. Additionally, even
though FAA estimates that about 50 to 60 percent of the overall
costs of terminal projects are eligible for AIP grants, airports
do not typically report terminal projects to FAA due to the low
probability of getting federal grants for such projects.

The ACI-NA and FAA estimates are the two main sources for
Congress and other stakeholders to review in considering the
funding necessary for airport infrastructure development going
forward. As in the past, decisions on funding reach well beyond
the actual authorization period and impact the infrastructure
improvements that can be achieved to address aviation
demand. Additionally, these decisions have a direct and
long-term bearing on the ability of communities to generate
jobs and commerce as well as ensure our nation’s competitive
position in the global economy.

11 Both the ACI-NA and the FAA estimates are for 2019 through 2023. The
   ACI-NA survey was completed in 2018 and stated in current year dollars
   and the FAA estimate is based on airport master and state system
   planning documents available through FY2017 in 2017 constant dollars.

12 See page iv of the FAA NPIAS Report 2019-2023 and page vii of the FAA
   NPIAS Report 2015-2019.

13 See page iv of the FAA NPIAS Report 2019-2023.

14 See page iv of the FAA NPIAS Report 2019-2023.

34   |   Terminally Challenged: Addressing the Infrastructure Funding Shortfall of America’s Airports
CONCLUSION
The infrastructure development cost estimate for 2019-2023 shows
an increase of 34.0 percent from the estimate for 2017-2021 for
large, medium, and small hub airports combined, and a 4.3 percent
increase for non-hubs and non-commercial service airports. The
improving economic environment, increasing passenger travel, and
aging infrastructure have caused airports to plan or begin additional
infrastructure projects that were previously postponed or canceled.

Airport infrastructure development needs are driven by current
and forecasted aviation activity; use and age of airport facilities and
the need to modernize aging infrastructure; and changing aircraft
technology that requires airports to update or replace equipment and
infrastructure. Airport infrastructure needs are not only correlated with
passenger and cargo activity levels, but are also affected by how airlines
                                                                                                 The existing funding
use airport infrastructure. Airport operators have a responsibility to
make needed investments in modernizing aging airport facilities so that                          system fails to meet
they can ensure efficient, safe and secure operations for aeronautical
users and the traveling public as well as facilitate airline competition.                        U.S. airport infrastructure
Failure to make adequate investments in infrastructure will diminish
the ability of airports to fully serve as growth engines for the public and
communities across the United States.                                                            needs for modernizing
It is important to understand that the existing funding system fails to                          and expanding airport
meet U.S. airport infrastructure needs for modernizing and expanding
airport capacity. Failure to meet the future infrastructure needs
of airports will impair the ability of the U.S. economy to grow and
                                                                                                 capacity.
compete globally.

                                                                              Terminally Challenged: Addressing the Infrastructure Funding Shortfall of America’s Airports   |   35
Infrastructure Needs 2019 - 2023
                                                                                                        Top 5 Large Hubs by Infrastructure Needs

                                                                                                        Airport Code                             Total Need 2019-2023
                                                                                                                                                              In Billions
                                                                                                        LAX . . . . . . . . . . . . . . . . . . . . . . . . .  $ 13.02
                                                                                                        EWR. . . . . . . . . . . . . . . . . . . . . . . . .  $ 5.46
                                                                                                        JFK. . . . . . . . . . . . . . . . . . . . . . . . . .  $ 5.34
Top 10 Airports by Infrastructure Needs                                                                 SFO. . . . . . . . . . . . . . . . . . . . . . . . .  $ 4.68
                                                                                                        MCO. . . . . . . . . . . . . . . . . . . . . . . .  $ 3.66
Airport Code                             Total Need 2019-2023
                                                      In Billions
                                                                                                        Top 5 Medium Hubs by Infrastructure Needs
LAX . . . . . . . . . . . . . . . . . . . . . . . . .  $ 13.02
EWR. . . . . . . . . . . . . . . . . . . . . . . . .  $ 5.46
                                                                                                        Airport Code                             Total Need 2019-2023
JFK. . . . . . . . . . . . . . . . . . . . . . . . . .  $ 5.34
                                                                                                                                                              In Billions
SFO. . . . . . . . . . . . . . . . . . . . . . . . .  $ 4.68
                                                                                                        AUS. . . . . . . . . . . . . . . . . . . . . . . . .  $ 2.10
MCO. . . . . . . . . . . . . . . . . . . . . . . .  $ 3.66
                                                                                                        SJC. . . . . . . . . . . . . . . . . . . . . . . . . .  $ 2.09
LGA. . . . . . . . . . . . . . . . . . . . . . . . .  $ 3.50
                                                                                                        BNA. . . . . . . . . . . . . . . . . . . . . . . . .  $ 1.61
ORD . . . . . . . . . . . . . . . . . . . . . . . .  $ 3.32
                                                                                                        PIT. . . . . . . . . . . . . . . . . . . . . . . . . .  $ 1.39
SLC . . . . . . . . . . . . . . . . . . . . . . . . .  $ 3.05
                                                                                                        BUR. . . . . . . . . . . . . . . . . . . . . . . . .  $ 1.21
ATL . . . . . . . . . . . . . . . . . . . . . . . . .  $ 2.67
BWI. . . . . . . . . . . . . . . . . . . . . . . . .  $ 2.57
                                                                                                        Top 5 Small Hubs by Infrastructure Needs

                                                                                                        Airport Code                           Total Need 2019-2023
                                                                                                                                                            In Millions
                                                                                                        MEM. . . . . . . . . . . . . . . . . . . . . . . .  $ 584
                                                                                                        DSM . . . . . . . . . . . . . . . . . . . . . . . .  $ 428
                                                                                                        RNO . . . . . . . . . . . . . . . . . . . . . . . .  $ 380
                                                                                                        CHS. . . . . . . . . . . . . . . . . . . . . . . . .  $ 366
                                                                                                        GEG. . . . . . . . . . . . . . . . . . . . . . . . .  $ 272
36   |   Terminally Challenged: Addressing the Infrastructure Funding Shortfall of America’s Airports
APPENDIX 1: SCOPE AND METHODOLOGY
The 2018 ACI-NA Survey was based on the 2016/17 survey                     Committed projects included those projects for which financing was
instrument that was developed with input from the FAA and the              secured or was expected to be secured, and environmental and
GAO. This included the various definitions in the survey, such as          other required approvals had been obtained or were expected to be
project type codes.                                                        obtained. These are projects that airlines supported or will not block
                                                                           through such actions as Majority in Interest (MII) veto/disapproval.
ACI-NA surveyed all of its airport members in the United States.
Eighty-six (86) airports responded. ACI-NA staff followed up with          Uncommitted projects included projects in airport master, layout, or
respondents as necessary to answer questions about the survey              capital plans that are essential to meet current or future air traffic
and ensure the accuracy of respondents’ answers.                           growth and facility demand, but that could not proceed due to
                                                                           inadequate funding. Respondents were specifically asked to include
Respondents were asked to identify all infrastructure                      only projects they expected the airlines would support or would not
development projects and associated costs for calendar                     block through such actions as MII disapproval, and for which they
years 2019 through 2023, and to report these costs in 2018                 expected to obtain all environmental and other approvals.
constant year dollars. Costs included interest, construction and
management costs, architectural and engineering costs, and                 For both committed and uncommitted projects, respondents were
contingency costs. Costs for multi-year projects were listed in the        asked to identify projects by location and type. Location codes
year when the money was expected to be spent.                              included whether a project was airside, terminal, or ground access.
                                                                           Type codes included whether a project was access to terminal,
Information on costs for infrastructure development projects               airfield capacity, airfield standards, environment, new airport,
were divided into two sections: committed and uncommitted.                 airfield reconstruction, safety, terminal, or security. To ensure the
For each section, airports were requested to list the ten largest          ACI-NA data was fully comparable with the FAA, ACI-NA used the
projects in terms of costs and list the rest of the project costs as       same definitions for project type as the FAA uses in its NPIAS. In
“all other projects.”                                                      cases where multiple codes applied for either project location or
                                                                           type, respondents were asked to provide the cost percentage for
                                                                           each code.

                                                                       Terminally Challenged: Addressing the Infrastructure Funding Shortfall of America’s Airports   |   37
APPENDIX 2: BACKGROUND
Airports Council International-North America (ACI-NA) regularly
updates its estimate of infrastructure development needs for the
airports that comprise the national airport system of the United
States, as defined by the Federal Aviation Administration (FAA).

The national airport system is composed of 3,328 airports,
ranging from the largest commercial service airports to small
general aviation airports. Development projects at these airports
generally fall within five categories: (1) expanding an airport’s
capacity beyond its current design to meet growth in demand for
aviation services; (2) upgrading infrastructure to accommodate
the introduction of different aircraft types; (3) reconstructing
aging airport infrastructure; (4) bringing an airport up to
FAA-mandated design standards to achieve full productivity of
aircraft using the airport; and (5) addressing safety, security, and
environmental concerns.

ACI-NA conducts its assessment using the FAA’s airport
classifications. Definitions of the FAA’s airport classifications used
in this report are included in Appendix 4.

38   |   Terminally Challenged: Addressing the Infrastructure Funding Shortfall of America’s Airports
APPENDIX 3: HOW ACI-NA CALCULATED
INFRASTRUCTURE DEVELOPMENT COSTS
ACI-NA calculated airports’ infrastructure development needs                   The total infrastructure development costs for large, medium, and
using the ACI-NA survey and the FAA NPIAS. Specifically, ACI-NA                small hub airports were based on responses from 30 large hub, 26
used its survey data to calculate costs for large, medium, and                 medium hub, and 30 small hub airports. As shown in Table 5, this
small hub airports and used the FAA NPIAS data to calculate costs              represents 100 percent of all passengers enplaned at large hubs,
for non-hub, commercial service, reliever, and general aviation                87.3 percent of all passengers enplaned at medium hubs, and 51
airports. ACI-NA also used FAA 2017 enplanement data, which is                 percent of all passengers enplaned at small hubs in 2017.
the latest available information, to make calculations.

Table 5: ACI-NA Sample Compared to Industry

Airrport  Number of                   Total Number of            Respondents                       Respondents Percentage                             Respondents
Category Respondents                   Airports in the          Percentage of all                 of Total 2017 Enplanements                       Percentage of Total
		                                        Category          Airports in the Category                    in the Category                            2017 Enplanements

Large hub                   30              30                       100%                                        100%                                       72.0%

Medium hub                  26               31                      83.8%                                      87.3%                                       14.1%

Small hub                   30              72                       41.6%                                      50.5%                                       4.2%

Non-Hub                         2           247                        -                                           -                                           -

Other                           -          2,941                       -                                           -                                           -

Total                       86             3,321*                      -                                           -                                         90.3

*Note: From FAA NPIAS Report.

                                                                           Terminally Challenged: Addressing the Infrastructure Funding Shortfall of America’s Airports   |   39
Table 6: ACI-NA Sample Infrastructure Development Costs Per Enplanement                                                       As shown in Table 6, ACI-NA
                                                                                                                              then calculated the total
Airrport                      Total Costs for 2019-2023                           Total 2017                 Cost per         infrastructure development
Category                         in Millions of 2018                            Enplanement             Enplanement in 2018   costs per 2017 enplanement for
                                  Constant Dollars                               by Category              Constant Dollars    the respondent large, medium,
                                                                                                                              and small hub airports.
Large hub                                 77,767                                  617,598,283                  125.9

Medium hub                                14,596                                   121,346,294                 120.3

Small hub                                 4,556                                    35,852,306                  127.1

Source: ACI-NA Survey.

Table 7: Total Infrastructure Development Costs Estimate for Large, Medium, and Small Hub Airports

Airrport                      Total Number of Airports                Total 2019 - 2023 Infrastructre       Percentge         As shown in Table 7, this cost
Category                       by Category in National                Development Costs in Millions          of Total         per enplanement in 2018
                                   Airport System                        of 2018 Constant Dollars
                                                                                                                              constant dollars was then used
Large hub                                   30                                       77,767                    63.5%
                                                                                                                              as the unit cost to estimate the
                                                                                                                              infrastructure development costs
Medium hub                                  31                                        16,713                   13.6%
                                                                                                                              for all medium and small hub
Small hub                                   72                                        9,019                    7.4%           airports. No estimate was needed
Non-hub                                    247                                        5,332*                   4.4%           for large hubs with 100 percent
                                                                                                                              response rate.
Other                                      2941                                      13,631*                   11.1%

Total                                      3,321                                     122,462                  100.0%

Source: ACI-NA Survey.

40   |   Terminally Challenged: Addressing the Infrastructure Funding Shortfall of America’s Airports
Table 8: Total Infrastructure Development Costs Estimate (In 2018 Constant Dollars)                                        Table 8 shows the total
                                                                                                                           infrastructure development costs
Airrport               Total Number of Airports by   Total 2019-2023 Infrastructure          Percentage                    for all airports in the national airport
Category                  Category in National       Development Costs in Millions             of Total                    system in 2018 constant dollars
                              Airport System            of 2018 Constant Dollars                                           using the ACI-NA estimate for large,
                                                                                                                           medium, and small hub airports and
Large hub                          30                            77,767                          63.5%
                                                                                                                           the FAA NPIAS data for non-hub,
Medium hub                         31                            16,713                           13.6%                    commercial service, reliever, and
Small hub                          72                            9,019                            7.4%                     general aviation airports. ACI-NA
                                                                                                                           used the NPIAS data due to the small
Non-hub                           247                            5,332*                           4.4%
                                                                                                                           number of non-hub, commercial
Other                             2941                           13,631*                          11.1%                    service, reliever, and general aviation
Total                             3,321                         122,462                         100.0%                     airports in the ACI-NA survey sample.

*Note: From FAA NPIAS Report

Taking the escalation of construction costs into consideration,                  Besides calculating the total developments costs, ACI-NA also
ACI-NA made a 1.5 percent inflation adjustment to the total                      calculated development costs by project type. To do this ACI-NA
estimate in 2018 constant dollars to reflect total infrastructure                first determined the percentage distribution by project type using
needs in current year dollars. As shown in Table 1, total industry               ACI-NA survey results for large, medium, and small hub airports
infrastructure needs are estimated to be $128.1 billion in current               and using the NPIAS data for non-hub and all other airports. As
year dollars. Average annual infrastructure needs for the years                  shown in Table 9, the project type percentage distribution was
2019 through 2023 as shown in Table 2 are 28.3 percent higher                    then multiplied by the total industry estimate for each category of
than for the years 2017-2021 estimated in the ACI-NA survey done                 airport to determine the total costs by project type.
almost two years ago.

                                                                           Terminally Challenged: Addressing the Infrastructure Funding Shortfall of America’s Airports   |   41
Table 9: ACI-NA Total Costs by Project Type

Airport Safety Security Reconstruction Standards Environment Capacity Terminal Access   New                                                Other   Total     Percent
Category							                                                       Building		      Airports

Large Hub           1,549         1,075              5,359                 1,523              1,045     7,601    37,377   17,040   3,541   4,956   81,066     63.3%

Med. Hub            1,037          130               2,940                 334                 148      1,669    5,852    1,778    1,241   2,408   17,537     13.7%

Small Hub            349           303               1,387                 304                 567      1,588    3,413     758      2       727    9,398      7.3%

Non-hub              346           20                1,962                2,164                122       183      663      155       -      46     5,660      4.4%

Other                335           24                 5,612               6,805                117       718      224      218     299      119    14,471     11.3%

Total               3,615         1,552              17,260               11,130              1,999     11,758   47,530   19,948   5,083   8,256   128,131   100.0%

Percent             2.8%          1.2%               13.5%                 8.7%               1.6%      9.2%     37.1%    15.6%    4.0%    6.4%    100.0%

Millions of Current Year Dollars
Source: ACI-NA Survey and FAA NPIAS Report.

42   |   Terminally Challenged: Addressing the Infrastructure Funding Shortfall of America’s Airports
APPENDIX 4: FAA DEFINITIONS
OF AIRPORT CATEGORIES
FAA defines airports by categories of airport activities, including commercial service, primary, reliever, and general aviation airports:

Airport Classifications                                                     Hub Type: Percentage of                                         Common Name
                                                                            Annual Passenger Boardings

Commercial Service:                    Primary:                             Large: 1% or more                                               Large Hub

Publicly owned airports that           Have more than 10,000

have at least 2,500 passenger          passenger boardings                  Medium: At least 0.25%,                                         Medium Hub

boardings each calendar                each year                            but less than 1%

year and receive scheduled             §47102(11)

passenger service                                                           Small: At least 0.05%,                                          Small Hub

§47102(7)                                                                   but less than 0.25%

                                                                            Non-hub: More than 10,000,                                      Non-hub Primary

                                                                            but less than 0.05%

                                       Nonprimary                           Non-hub: At least 2,500                                         Nonprimary

                                                                            and no more than 10,000                                         Commercial Service

Nonprimary                                                                  Not Applicable                                                  Reliever §47102(18)

(Except Commercial Service)

                                                                             Terminally Challenged: Addressing the Infrastructure Funding Shortfall of America’s Airports   |   43
Definition of Airport Categories                                                                                    calendar year 2001 data are used for fiscal year 2003
                                                                                                                    since the fiscal year began 9 months after the end of that
                                                                                                                    calendar year. The table below depicts the formulae used
1          Commercial Service Airports                                                                              for the definition of airport categories based on statutory
                                                                                                                    provisions cited within the table, including Hub Type
           Commercial Service Airports are publicly owned airports                                                  described in 49 USC 47102.
           that have at least 2,500 passenger boardings each calendar
           year and receive scheduled passenger service. Passenger                                      2       Reliever Airports
           boardings refer to revenue passenger boardings on an
           aircraft in service in air commerce whether or not in                                                Reliever Airports are airports designated by the FAA to relieve
           scheduled service. The definition also includes passengers                                           congestion at Commercial Service Airports and to provide
           who continue on an aircraft in international flight that                                             improved general aviation access to the overall community.
           stops at an airport in any of the 50 States for a non-traffic                                        These may be publicly or privately-owned.
           purpose, such as refueling or aircraft maintenance rather
           than passenger activity. Passenger boardings at airports
           that receive scheduled passenger service are also referred                                   3       General Aviation Airports
           to as Enplanements.
                                                                                                                General Aviation Airports are the largest single group of
            1.   Nonprimary Commercial Service Airports are                                                     airports in the U.S. system. The category also includes
                 Commercial Service Airports that have at least 2,500 and                                       privately owned, public use airports that enplane 2500
                 no more than 10,000 passenger boardings each year.                                             or more passengers annually and receive scheduled
                                                                                                                airline service.
            2.   Primary Airports are Commercial Service Airports
                 that have more than 10,000 passenger boardings each                                    Please note that in this report, ACI-NA defines airport category based
                 year. Hub categories for Primary Airports are defined                                  on FAA calendar year 2017 enplanements, while the latest FAA NPIAS
                 as a percentage of total passenger boardings within the                                report for 2019-2023 categorized airports based on FAA Calendar
                 United States in the most current calendar year ending                                 Year 2016 enplanements.
                 before the start of the current fiscal year. For example,

44   |   Terminally Challenged: Addressing the Infrastructure Funding Shortfall of America’s Airports
You can also read