UKCS Decommissioning Cost Estimate 2021 - July 2021 - Oil and Gas Authority
←
→
Page content transcription
If your browser does not render page correctly, please read the page content below
UKCS Decommissioning
     Cost Estimate 2021

                   July 2021
Front cover image: ©Shetland Flyer Aerial Media / Licensed by Lerwick Port Authority
Contents
1. Executive Summary                            4
2. Introduction                                 6
  2.1 Context                                   6
  2.2 Cost Estimate and Target Status           7
3. Cost Breakdown                              10
  3.1 Progress (2017–2020)                     10
  3.2 Progress and Outlook (2021 +)            13
  3.3 Class Changes and Probabilistic Impact   21
4. Well Decommissioning                        23
  4.1 Scope                                    23
  4.2 Cost Analysis                            27
5. Cost Opportunities and Risks                30
6. OGA Actions and Next Steps                  31
Appendices                                     32

                                                    3
UKCS Decommissioning Estimate – 2021

    1. Executive Summary
    The total cost of decommissioning UKCS offshore oil and gas infrastructure has reduced to £46bn1 equating
    to a projected saving of nearly £14bn (23%) since the 2017 cost reduction target2 was first established. The
    substantial saving already achieved is good news for both industry and the Exchequer.

    The £2bn (4%) reduction in the 2021 estimate is the result of           The costs of completed decommissioning projects are
    continuous improvement and reductions in:                               approximately 20% lower than initially forecast, tracking the
                                                                            downward trajectory of the overall cost estimate.
    • W
       ell decommissioning costs, driven by reductions predominantly
      in subsea well decommissioning costs across both Central North        There are positive signs that operators are embracing lessons
      Sea (CNS) and West of Shetland (WOS)                                  learned from across the industry whilst also embedding a culture
    • Cost estimating uncertainty and associated cost risk                  of continuous improvement and setting ambitious best in class
                                                                            performance targets. This is helping drive the downward cost
    An average annual cost reduction of 6% has been delivered over the      trajectory and, more will be needed to meet the target. At the
    past four years. If this average is maintained the 35% target remains   same time however there remain some real inconsistencies in cost
    achievable by end-2022.                                                 performance, reducing the overall improvement of the basin.
    Expenditure in 2020 was impacted by Covid-19 and the low                The majority of decommissioning cost is forecast to be incurred over
    commodity price, contributing to a continuation of a plateau in the     the coming two decades and the window of opportunity to identify
    rate of cost reduction reported last year. While short-term forecasts   and embed the necessary changes to drive the next step change in
    show a recovery from this slowdown, commercial transformation           cost efficient decommissioning is immediate.
    remains key to meeting the cost reduction target.

    1
        Costs shown in 2016 prices, for expenditure in 2017 and after
    2
        Basis of 2017 estimate, 2016 Annual OGA Stewardship survey
4
UKCS Decommissioning Estimate – 2021

The Oil and Gas Authority’s updated Decommissioning Strategy3
sets out the commercial transformation and strategic objectives
required to deliver cost efficiency and achieve the UKCS cost
reduction target of greater than 35%.
Significant opportunity and value still exist to drive the required cost
reduction including:
• D
   ecommissioning at scale: The value of campaigning is proven
  but not yet consistently established or mainstream to be able to
  fully capture its benefits
• S
   ustainable and stable supply chain: Increased visibility of key
  decommissioning data, including through Energy Pathfinder4
• L
   essons learned: Transfer of knowledge plus good practices
  through improved communication, engagement and stewardship
Key threats and uncertainties with the potential to increase costs
include operator commercial misalignment, lack of collaboration,
delayed late life planning and execution and oil-sector inflation.
The UKCS full portfolio estimate stands at £48bn5 including £2bn for
planned but as yet unsanctioned/not-built projects.

3
  Oil and Gas Authority: Decommissioning Strategy - 2021 - Publications - News & publications (ogauthority.co.uk)
4
  Energy Pathfinder provides a real time view of energy projects on the UKCS
  https://app.powerbi.com/view?r=eyJrIjoiZTU3MmFmMDktMDI0Ni00MzllLTg1MTQtMDQxZmQzNWUxZTc5IiwidCI6ImU2ODFjNTlkLTg2OGUtNDg4Ny04MGZhLWNlMzZmMWYyMWIwZiJ9&pageName=ReportSection
5
   All costs are in 2020 prices, based on forecast expenditure in 2021 and after, unless otherwise stated
                                                                                                                                                                                    5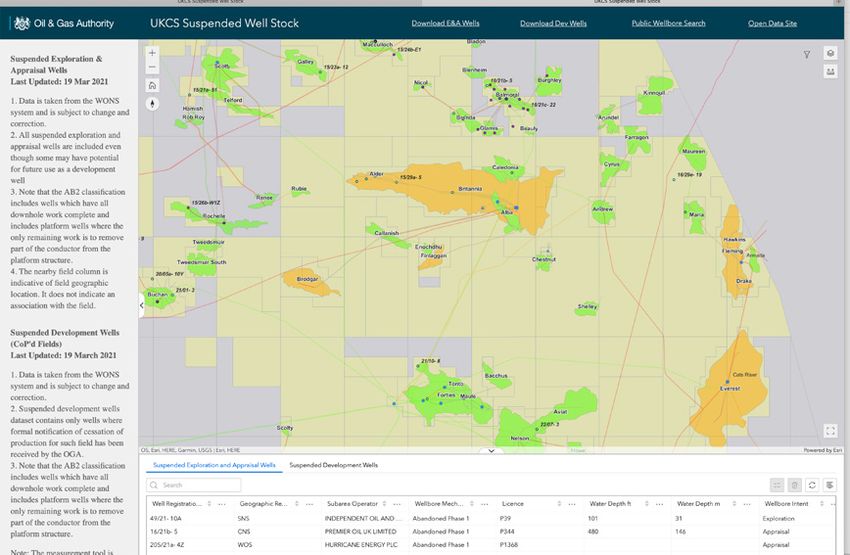
UKCS Decommissioning Estimate – 2021

    2. Introduction
    2.1 Context

    The revised OGA Strategy sets out a range of obligations on the oil and gas industry to meet its commitments,
    including reducing greenhouse gas emissions, supporting Carbon Capture and Storage (CCS) projects and
    working collaboratively with its supply chain.

    With intensifying decommissioning activity in the UKCS, increasing                                             Based on the information provided by infrastructure owners through
    commodity price6 and an accelerating energy transition, the                                                    the annual UKCS Stewardship Survey, the OGA takes a probabilistic
    importance of ensuring that decommissioning is carried out in                                                  approach8 (Appendix 2) to estimating total UKCS decommissioning
    a timely and cost-effective manner not only helps value creation                                               costs considering uncertainties inherent in cost estimation. Two cost
    from the UKCS, but also demonstrates industry’s commitment to                                                  estimates are reported:
    responsibly managing the UK’s petroleum legacy.
                                                                                                                   • Like-for-like estimate9: Cost reductions are measured against the
    The updated Decommissioning Strategy supports the OGA                                                             £59.7bn baseline calculated in the 2017 report
    Strategy7 through four complementary areas of focus, driving                                                   • F
                                                                                                                      ull portfolio estimate10: Addresses changes in the remaining,
    delivery of the ambitious target to reduce decommissioning cost                                                  to-be-decommissioned, portfolio since 2017 baseline
    estimates by 35% by end-2022:
                                                                                                                   Decommissioning activity is forecast to take place over the coming
    • Planning for decommissioning                                                                                 four decades with the majority of activity, and hence cost, expected
    • Commercial transformation                                                                                    to be incurred in the next two decades.

    • Supporting energy transition from late life into decommissioning                                             Decommissioning activity and plans were impacted in 2020 by
                                                                                                                   Covid-19 and low commodity prices. Progress reported here in
    • Technology, processes and guidance
                                                                                                                   the Cost Estimate Report 2021 is in this context.

    6
         Brent spot oil price $77/bbl @ 6th July 2021
    7
         OGA Strategy ref. https://www.ogauthority.co.uk/news-publications/publications/2021/the-oga-strategy/
    8
         Decommissioning Cost Estimate Report 2017,2018,2019,2020 - https://www.ogauthority.co.uk/decommissioning/cost-estimate/
    9
         Costs shown in 2016 prices, for expenditure in 2017 and after
    10
         All costs are in 2020 prices, based on forecast expenditure in 2021 and after, unless otherwise stated
6
UKCS Decommissioning Estimate – 2021
Oil and gas is expected to remain an important part of the UK’s 2.2 Cost Estimate and Target Status
energy mix for the foreseeable future and the basin remains an
attractive investment proposition. As a dynamic market, Mergers
The 2021 like-for-like estimate stands at £46bn (Figure 1) which
and Acquisitions (M&A) remain an inherent feature impacting on
reflects a cumulative reduction of nearly £14bn (23% reduction) since
late-life and decommissioning plans which may present risks and
2017 baseline. The full portfolio estimate stands at £48bn including
opportunities to future decommissioning estimates and costs.
£2bn for planned but as yet unsanctioned/not-built projects.
Figure 1: Like-for-Like and Full Portfolio Cost Trends
Cost Estimate vs Time Like-for-Like (Probabilistic) Cost Estimate vs Time Full Portfolio (Probabilistic)
Fraction of Baseline (2017) Estimate Like-for-Like Scope Comparison2
160% 160%
Fraction of Baseline (2017) Estimate Like for Full Portfolio Comparison6
P10 P50 P90 Target P10 P50 P90
£83bn £83bn
140% 140%
£77bn
£73bn
120% 120%
£67bn £66bn
£64bn
£62bn £61bn
£59.7bn £59.7bn
100% £58bn 100% £58bn
£56bn
£49bn £51bn £51bn
£48bn £48bn
80% £44bn £46bn 80% £45bn
£43bn £44bn
£39bn £39bn industry target £40bn £40bn
£38bn
£38bn
60% 60%
40% 40%
20% 20%
0% 0%
2017 2018 2019 2020 2021 2022 2023 2017 2018 2019 2020 2021 2022 2023
Cost
CostReport Year
Report Year Cost Report
Cost ReportYear
Year
7UKCS Decommissioning Estimate – 2021
Decommissioning cost estimates continue to fall and have reduced build on the successes and continuous improvement achieved to-
by a further 4% in 2021 (Figure 2), giving an average annual cost date, by capturing large, remaining opportunities from collaborative
reduction of 6% over the past four years. behaviours and aligned, incentivised contracting.
If this average is maintained the 35% target will be achieved by Despite the reduced rate of cost reduction there remains
end-202211. However, the reductions have begun to slow. If the considerable opportunity (Appendix 6) for future cost improvements
estimate trajectory continues at the reduced levels seen over the to meet the targeted UKCS cost reduction target of greater than
past two years, the target will not be achieved. Hence the need to 35% (to levels below £39bn).
Figure 2: Decommissioning Cost Reductions Towards 35% Target (Like-for-Like)
Progression Towards 35% Target (Probabilistic, bn) Decommissioning Estimate Change (Probabilistic, bn)
£70 £70
£60 £60 58
7% 51 51
48
Decommissioning Costs (£bn)
Decommissioning Costs (£bn)
£50 £50
10% 2%
4%
£40 £40
12%
59.7
£30 59.7 £30
56
46.1 49 48 46
£20 39 £20
£10 £10
£0 £0
2017 2018 2019 2020 2021 2021 Remainder Industry 2017 2018 2019 2020 2021
Estimate Estimate Estimate Estimate Estimate Estimate to achieve Target Estimate Estimate Estimate Estimate Estimate
Reduction Reduction Reduction Reduction 35% Target
Full portfolio increment (Adjusted for post-2017 inventory changes, inflation, and spend to date
2017 Like-for-Like (2017 inventory portfolio, period range, and prices)
11
2022 Stewardship survey; 2023 OGA Decommissioning cost estimate report
8UKCS Decommissioning Estimate – 2021
Around 11% of the “like-for-like” cost estimate has been liquidated
over the period 2017–2020, with significant decommissioning
expenditure forecast to be incurred in the following 20 years in the
range of circa £1.5bn–£2.5bn per year (Figure 3). A summary of the
decommissioning scope is provided within Appendix 4.
Figure 3: Annualised Decommissioning Cost Profile
Projected Annual UKCS Decommissioning Costs, 2021+ Full Portfolio
2.5
2.0
– 2021 Unsanctioned
– 2021 Sanctioned
£ billion (2020 prices)
– 2020 Estimate
1.5
1.0
0.5
0.0
2021
2022
2023
2024
2025
2026
2027
2028
2029
2030
2031
2032
2033
2034
2035
2036
2037
2038
2039
2040
2041
2042
2043
2044
2045
2046
2047
2048
2049
2050
2051
2052
2053
2054
2055
2056
2057
2058
2059
2060
2061
2062
2063
2064
2065
2066
9UKCS Decommissioning Estimate – 2021
3. Cost Breakdown
3.1 Progress (2017–2020)
Over the four year period (2017–2020), reductions in the range of 25–35% have been achieved across three of
the largest cost categories (well decommissioning, removals and subsea infrastructure) while post-Cessation of
Production (CoP) running costs have predominantly remained flat over the same period.
Well decommissioning and removals Figure 4a: 2017 to 2021 Estimate Changes (Like-for-Like13)
account for nearly 70% of total cost
estimate, with well decommissioning
£70
being the largest single cost category Well Decommissioning Removals Owners Cost Subsea Recycling site rem & monitoring
consistently representing around 45% of
£60
the total decommissioning cost estimate
Decommissioning Costs (£bn)
6%
6%
and providing the largest individual cost £50
10%
9%
reduction opportunity. These two cost 13%
6%
6%
9% 7%
categories alone contribute more than £40
14% 9%
9%
14%
£10bn12 of the cost savings to date. The 14%
15%
25%
distribution of UKCS decommissioning £30
25%
26% 25%
costs by geography reflects a similar 25%
pattern, with well decommissioning being £20
dominant across all geographical areas
45% 46%
(Appendix 3). £10 45% 46% 44%
£0
2017 2018 2019 2020 2021
Estimate Estimate Estimate Estimate Estimate
12
Class Change and Probabilistic Impact included in relevant work breakdown structures
13
Costs shown in 2016 prices, for expenditure in 2017 and after
10UKCS Decommissioning Estimate – 2021
Figure 4b: 2017 to 2021 Cost Estimate Waterfall by Category
(Like-for-Like – Applying Class Change Across Cost Categories)
£65
£60 59.7
Decommissioning Costs (£bn)
£55
-6.6
£50
-3.5
-2.2 46.1
-0.3
£45 -1.0
£40
2017 Decom Cost Well Removals Subsea Post-CoP Other WBS 2021 Decom Cost
Estimate Probabilistic Decom Infrastructure Running Costs Adjustments Estimate Probabilistic
11UKCS Decommissioning Estimate – 2021
For decommissioning scopes completed over the period 2017– Figure 5: Completed Projects (Initial vs Latest Costs)
2020 there is clear and encouraging evidence of actual (out turn)
Completed Projects from UK Stewardship Survey
decommissioning costs being in the order of 20% lower than
initial forecast, tracking the downward trajectory of the overall cost
estimate14. Lessons learned from completed projects are now
being used by operators as an input and basis for updates to future
estimates. Additionally, decommissioning lessons learned and good Initial Costs
£3.9bn
practices are shared with the industry including through the OGA ~20% reduction
website15. against initial
cost estimates
The forecast expenditure for assets currently on the OGA
Decommissioning Glidepath16 (i.e. those with an estimated CoP
date within 6 years) amounts to approximately £9bn (around 20% Latest Costs
£3.1bn
of the full portfolio decommissioning estimate), with 80% of this
being distributed over 7 operators. While the operator is the entity
executing the scope, the decommissioning financial liability is usually
jointly borne by respective Joint Venture owners.
14
Completed Scopes from Wells, Removals and Subsea Infrastructure Categories, total costs up to 2020, Source: UKCS Stewardship Survey
15
https://www.ogauthority.co.uk/lessons-learned/
16
Stewardship Expectation 10: Cost Effective Decommissioning (https://www.ogauthority.co.uk/media/5904/oga_se10_cost_effective_decommissioning_july_2019.pdf)
12UKCS Decommissioning Estimate – 2021
3.2 Progress and Outlook (2021+)
Compared with the 2020 like-for-like cost estimate, there has been a further £2bn reduction (Figure 6), due to a decrease in forecast and
executed activity costs and reduced risk in the operator cost estimates.
Figure 6: 2020 to 2021 Decommissioning Cost Estimate Reductions
(Like-for-Like, Probabilistic, £bn)
£50
£49
48.2
£48
Decommissioning Costs (£bn)
£47
-1.1 46.1
£46
-0.9
£45
£44
£43
£42
£41
£40
2020 Decom Change in Class Change 2021 Decom
Cost Estimate Survey Totals and Probabilistic Cost Estimate
Probabilistic Impact Probabilistic
13UKCS Decommissioning Estimate – 2021
While substantial reductions in decommissioning cost estimates are reported by several operators, the value of these are partially offset by
material increases elsewhere leading to a more modest net reduction (Figure 7).
Figure 7: 2020–2021 Estimate Change by Operator
Estimate Change (Deterministic (2021+), excluding adjustments)
£400
Difference in Decom Costs 2021-2020 (£million)
£200
£0
-£200
-£400
-£600
-£800
Operator (anonymised)
14UKCS Decommissioning Estimate – 2021
Actual decommissioning expenditure in 2020 was £420m lower (Figure 8) than estimated the previous year, in comparison to £170m reduction
in 2019 and £432m in 2018. The reductions in expenditure in 2020 were in line with expectations as a result of Covid-19 and the low commodity
price. Over the next four years (2021–2024) spend is forecast to rebound and increase, reflecting a recovery from 2020 slowdown.
Figure 8: Deferral and Forecast Analysis
2020 Estimate vs 2020 Actual Costs 2020 to 2024 Profile/Cost Recovery Trajectory
(Deterministic, excluding adjustments) (Deterministic, excluding adjustments)
£1.6 £2.0
Total Decommissioning Costs – Deterministic (£bn)
£1.8
£1.4
Decommissioning Costs £bn
£420MM 28% £1.6
£1.2
£1.4
£1.0 £1.2
£0.8 £1.0
£0.8
£0.6
£0.6
£0.4
£0.4
£0.2 £0.2
£0.0 £0.0
2020 2021 2022 2023 2024
Stewardship Survey 2019 Stewardship Survey 2020
15UKCS Decommissioning Estimate – 2021
Consistent with the four-year trend of cost reductions, forecast well decommissioning costs have reduced substantially with marginal reductions
in cost estimates also being evident across the remaining cost categories, with the exception of post-CoP running costs where cost estimates
have increased for the second year running (Figure 9). Incidences of accelerated CoP have and will likely continue to occur. Failure to adequately
manage the risk of accelerated CoP, through contingency planning plus proactive and timely late life decommissioning execution, particularly well
decommissioning, will have a significant resulting cost impact.
Figure 9: 2020 to 2021 Decommissioning Cost Estimate Reduction Categories
2020 to 2021 Cost Estimate Waterfall by Category (Like-for-Like, probabilistic, £bn)
£50
£49
48.2
£48
Decommissioning Cost £bn
0.4 0.2 0.2
£47
-1.3 46.1
-0.3
£46 -0.3 -0.9
£45
WBS Changes other class
£44
£43
£42
£41
£40
2020 Decom Cost Well Removals Subsea Post-CoP Other WBS Other Class Change & 2021 Decom Cost
Estimate Probabilistic Decom Infrastructure Running Costs Categories Adjustments Probabilistic Impact Estimate Probabilistic
16UKCS Decommissioning Estimate – 2021
Well Decommissioning Removals and Subsea Infrastructure
While well decommissioning costs are the largest contributor to the Continuous improvement in expertise and project management
2021 cost estimate reduction, this is influenced by material shifts in that enables flexible scheduling of work is driving a steady
estimates by a small proportion of operators. reduction in topsides and substructure removal costs. Top quartile
performance has been achieved in the area of topsides removals.
Further details of well decommissioning and associated cost
The contributory factors underpinning these achievements should
insights are provided in pages 23-29.
be captured and shared as lessons learned across the industry.
Operators and the supply chain are demonstrating collaborative
Post-CoP Running Costs behaviours which in turn is fostering innovation and leading to
reductions in actual costs and estimates. However, the supply
The increase of post-CoP costs reported (2021 cost estimate) is
chain needs greater visibility of, and confidence in, future work to
largely due to two factors:
anchor the progress achieved to date and continue to improve
• F
ields ceasing production earlier than planned leading to a competitiveness. Energy Pathfinder is improving the visibility of
longer period of warm-phase asset management than previously forthcoming work scopes by providing a one-stop shop for future
forecast, with increases in costs UKCS work and collaborative opportunities.
• R
eclassification of costs across WBS cost categories for fields
planning to decommission in the medium-term (2030’s)
A concerted effort by industry to address post CoP running
costs is required. This will be supported through enhanced
decommissioning stewardship (Appendix 5) including:
• F
urther sharing of lessons learned and best practice examples
for efficient and timely transition from warm to cold phase, and
• D
evelopment of greater understanding and reduction of cost
risks associated with earlier CoP
17UKCS Decommissioning Estimate – 2021
East Irish Sea Decommissioning Campaign Enables
Life Extension of the Morecambe Area
The Achievement
A campaign-based decommissioning programme has succeeded in consolidating the
Morecambe offshore asset footprint from eight to six platforms, and the number of gas
processing and export terminals onshore from two to one. This has been a major factor
in materially reducing asset OPEX, hence enabling life extension across the Morecambe
Hub area.
The multi-faceted technical and environmental challenges encountered both with the unique
slant wells and legacy infrastructure have required several industry firsts to overcome.
The supply chain has been widely engaged to develop solutions and a long-term, hub-wide
contracting strategy has significantly reduced the cost to the taxpayers and operator.
Multiple new UK entrants and service lines to the decommissioning sector have been
enabled and integrated together with established UK and international suppliers to safely
and efficiently deliver the programme.
OGA Decom Team Comments Key Facts
This is a good example of how • D
uring the work phase, 37,000 tonnes of
innovative thinking, supply chain infrastructure has been decommissioned
engagement and implementation across two subsea tie-backs, two drilling
platforms and a major onshore gas terminal.
of campaigns are all valuable
tools to achieve decom cost • T
he full long-term, area-wide
efficiencies and ultimately fulfil the decommissioning and contracting
OGA Strategy. strategies integrate circa 120,000 tonnes of
infrastructure creating significant economies
of scope and scale.
18UKCS Decommissioning Estimate – 2021
Campaigns and Collaboration Technology17
The OGA believes that commercial transformation based on While there is evidence of the successful application of technology
collaborative working and delivering projects through the campaign to enable cost effective decommissioning (e.g. single lift vessels),
approach offers significant opportunity to achieve further cost technology development targeted at decommissioning of both
efficiencies. wells and facilities consistently shows limited funding support from
operators while the supply chain continues to incrementally develop
While industry has experience of working collaboratively and
and deploy (decommissioning) technology. If this trend persists,
delivering projects through the campaign approach, they are yet to
the deployment at scale of technology options required to deliver
become mainstream ways of working. Decommissioning campaigns
performance improvement and help reduce decommissioning
have typically been limited to those which individual operators can
costs could be limited within the time window of high
assemble within their own portfolio.
decommissioning activity.
Industry is demonstrating a positive move toward broader
Analysis of operator Technology Plans, submitted under the 2020
collaboration opportunities and the OGA is engaging with
Annual Stewardship Survey, and industry engagement including
infrastructure owners to share lessons learned and promote joint
through the Technology Leadership Board, Net Zero Technology
operator campaigns with an expectation that campaign approaches
Centre and other Energy Integration Project stakeholders,
will become standard practice.
highlight two key enabling technologies to support the delivery
To date the two areas that have seen greatest focus and support for of decommissioning cost efficiencies:
campaigning are well decommissioning and subsea infrastructure
• R
igless abandonment (e.g. alternative P&A barriers, through
removals.
tubing cement evaluation)
• S
ubsea decommissioning (e.g. cutting and lifting, inspection
technology for repurposing)
17
Oil and Gas Authority: Technology Insights Report - 2020 - Publications -https://www.ogauthority.co.uk/technology/oga-technology-survey-insights/technology-insights-2020-summary-findings/
19UKCS Decommissioning Estimate – 2021
Contracting and Supply Chain18 Repurposing
Decommissioning presents an opportunity for the offshore oil and The potential repurposing of offshore oil/gas infrastructure to play
gas industry to coalesce behind a common objective, working a useful role in the transition to a low carbon economy is an area
collaboratively with its supply chain to drive out inefficient practices of increased focus. Emerging sectors which can potentially benefit
and achieve successful decommissioning to the benefit of all parties. from access to this infrastructure include Carbon Capture and
Storage (CCS), hydrogen and renewables (e.g. offshore wind).
Novel but proven contracting models delivering best in class
decommissioning cost outcomes exist but uptake across the With limited technical experience and evolving regulatory and
industry is inconsistent. Collaborative working offers a compelling commercial frameworks the overall decommissioning cost impact
opportunity to create value (by reducing cost and risk to both client of the energy transition plus any potential repurposing is uncertain
and contractor), creating the solid foundation for a capable, efficient and expected to remain so for the next 2–5 years. In some cases,
and motivated supply chain. to-date there have been minor cost increases, as additional work is
done when infrastructure or wells are preserved or decommissioned
to a different standard.
The potential cost effect of such repurposing of infrastructure
is, with some minor exceptions, not reflected in the 2021
decommissioning cost estimate.
18
Oil and Gas Authority: Stewardship Expectation 12 - Supply Chain Collaboration and Cooperation - 2021 - Publications - News & publications (ogauthority.co.uk)
20UKCS Decommissioning Estimate – 2021
3.3 Class Changes and Probabilistic Impact
The balance of the 2021 estimate reduction (£0.9bn) is due to changes in operators’ decommissioning cost estimate classifications with a
corresponding reduction in probabilistic cost impacts.
Figure 10: Decommissioning Cost Distribution by Estimate Quality
Class estimate improvement
class 5 class 4 class 3 class 2 class 1 Actuals
£50
Class 5 Class 4 Class 3 Class 2 Class 1 Actuals
4% 3%
£45 1%
4%
4%
4% 6%
Decommissioning Cost deterministic £bn
£40 2%
20% 10%
4%
2% 12%
£35 8%
3% 3%
11% 3%
43%
£30 15%
£25
43%
92% 38%
£20 72% 89%
40%
79%
£15 74%
67%
46%
£10
36% 36%
£5 27%
£0
2017 2018 2019 2020 2021
21UKCS Decommissioning Estimate – 2021
The OGA’s expectation is that, for 90% of expenditure within the
Figure 11: Estimate Quality for Spend in 2021-2023 and
coming three years, cost estimation quality should be of AACE
Comparison to OGA Key Performance Indicator
Class 3 or better (see Appendix 1 for AACE definitions). Based
Estimate maturity for spend 2021-2023 on the 2020 OGA Annual Stewardship survey, 79% of three-year
forecast expenditure met this expectation, an increase from the
previous years’ survey, where the equivalent value was 69%.
Several operators have improved their cost estimate classification
by applying continuous improvement principles, where lessons
learned from decommissioning execution are fed back into a
cost estimation model. Operators are also adopting a strategy of
ambitious goal setting and best in class decommissioning cost
21% targets.
However, the material variance in annual estimates and allocation
of costs across WBS categories, highlights the potential for
inconsistency across the industry in the way that cost estimates
are prepared and reported. The OGA will look to clarify existing
79% definitions to improve consistency of cost classification and
estimate certainty.
Class 1, 2 & 3 Class 4 & 5
22UKCS Decommissioning Estimate – 2021
4. Well Decommissioning
4.1 Scope
Currently, the UKCS has a well portfolio in excess of over 4000 wells which will require decommissioning.
Suspended Inactive19 Wells Figure 12: Number of Suspended Inactive Wells
The UKCS has 758 inactive suspended platform and subsea
20
wells. In the next five years, a similar number of wells are forecast 2026
to become inactive and available for decommissioning leading to a
total of 1553 (Figure 12) inactive suspended wells by 2026 if no well
decommissioning takes place.
1553
2021
758
19
Suspended Well guidance https://www.ogauthority.co.uk/news-publications/publications/2018/guidance-for-applications-for-suspension-of-inactive-wells/
20
Data as of March 2021
23UKCS Decommissioning Estimate – 2021
In November 2020 the OGA published the UKCS Suspended Exploration and Appraisal (E&A) Wells
Well Stock interactive app21 (Figure 13) which consolidates
Of the 758 inactive suspended wells, 181 are suspended open
already publicly available data into a central source of information
water Exploration & Appraisal (E&A) wells. Presently, E&A wells are
on inactive suspended wells. The data allows supply chain and
normally abandoned immediately after rig operations are complete.
operators to identify wells that are available for decommissioning,
However, this has not always been the case and there is a legacy
providing greater visibility of decommissioning work and enhancing
of open water wells that have been suspended on the UKCS. The
the opportunity for collaboration.
OGA has recently actively engaged the industry to promote and
agree upon decommissioning plans for all legacy E&A wells in line
Figure 13: Suspended Wells Map Viewer with the published suspended well guidance, and this remains a
high priority for the OGA.
Well Decommissioning Progress
There have been high levels of well decommissioning activity22 post
2017, with 130 and 132 wells decommissioned in 2018 and 2019
respectively. Only 84 wells were decommissioned in 2020 as a result
of deferment of work predominantly due to Covid-19. Consistent
with the short-term recovery and increased forecast, an increased
rate of medium-term well decommissioning is foreseen, with an
average of 185 wells per year forecast by the mid-2020’s (Figure
14). Coordination and resource levelling of the well decommissioning
profile provides the opportunity to create an efficient and stable
schedule of activity.
21
Oil and Gas Authority: Interactive maps and tools - Data centre (ogauthority.co.uk)
22
Well decommissioning progress (2018/19) includes data for fully abandoned (AB3) and wells which have been abandoned to phase 2 status (AB2)
24Wells/Year
0
50
100
150
200
250
300
350
20
09
20
1
20 0
11
20
1
20 2
13
20
1
20 4
15
20
1
20 6
17
20
1
20 8
19
20
2
20 0
21
20
2
20 2
23
Figure 14: Annual Well Abandonment by Type
20
2
20 4
25
20
2
20 6
27
20
2
20 8
29
20
3
(As reported in Decom and Wells section of the Stewardship Survey)
20 0
31
20
3
20 2
33
20
3
20 4
35
20
3
20 6
37
20
3
20 8
39
20
4
20 0
41
20
4
20 2
43
20
4
20 4
45
20
4
20 6
47
20
4
20 8
49
20
5
20 0
51
20
5
Subsea Wells
Platform Wells
20 2
53
20
5
20 4
55
20
5
20 6
57
20
5
20 8
Suspended E&A Subsea Wells
59
20
60
UKCS Decommissioning Estimate – 2021
25UKCS Decommissioning Estimate – 2021
Large-scale well decommissioning is still a relatively new activity on the UKCS. With the main volume of activity still to come (Figure 15), there
are significant opportunities to increase efficiencies and lower costs. Aggregating scope to create campaigns could provide the opportunity to
enhance efficiency through shared mobilisation/de-mobilisation costs, lessons learned and reduced time and cost of well operations.
Figure 15: Cumulative Well Abandonment Profile
(As reported in Decom and Wells section of the Stewardship Survey)
4500
Suspended E&A Subsea Wells
4000
3500
Subsea Wells
Cumulative well total
3000
2500 Platform Wells
2000
1500
1000
500
0
20 9
20 0
20 1
20 2
20 3
20 4
20 5
20 6
20 7
20 8
20 9
20 0
20 1
20 2
20 3
20 4
20 5
20 6
20 7
20 8
20 9
20 0
20 1
20 2
20 3
20 4
20 5
20 6
20 7
20 8
20 9
20 0
20 1
20 2
20 3
20 4
20 5
20 6
20 7
20 8
20 9
20 0
20 1
20 2
20 3
20 4
20 5
20 6
20 7
20 8
20 9
60
0
1
1
1
1
1
1
1
1
1
1
2
2
2
2
2
2
2
2
2
2
3
3
3
3
3
3
3
3
3
3
4
4
4
4
4
4
4
4
4
4
5
5
5
5
5
5
5
5
5
5
20
26UKCS Decommissioning Estimate – 2021
4.2 Cost Analysis Figure 16: Decommissioning Estimate by Cost Category24
(Probabilistic, 2021+ Full Portfolio)
Well decommissioning costs are an aggregation of:
Recycling site rem & monitoring
• Platform development well costs
3.6 Subsea
• Subsea development well costs 4.6
Owners Cost
Removals
• Open water suspended Exploration 7.0 Well Decommissioning
& Appraisal well costs 11.8
20.5
Since establishing the 2017 baseline, well
decommissioning costs have decreased by
£0 £5 £10 £15 £20 £25
£6.6bn23, these nonetheless continue to IS
represent a significant percentage (~43%) of Decommissioning CostsIS£bn SNS
the decommissioning cost estimate (2021+) IS
SNS
WoS
and hence provide greatest opportunity for SNS
WoS
Figure 17: Well Decommissioning Cost Distribution by
NNS
Geography & Type24
future cost reductions (Figure 16). WoS
NNS
CNS
(Probabilistic, 2021+
NNS Full Portfolio)
It is clear that substantial further well CNS
£0 £2 £4 £6
CNS
decommissioning cost reduction opportunities £0 £2 £4 £6 Decommissioning
£8 Cos
£
Decommissioning Costs (£bn)
still remain, from ‘levelling up’ operator cost
£0 £2 £4 £6 £8 £10 £12
Well Decommissioning (Platform) Well Decommissi
IS Decommissioning Costs (£bn)
performance and large volume, incentivised Well Decommissioning (Platform) Well Decommissioning (Subsea) Well Decommissio
contractual arrangements. SNS Well Decommissioning (Platform) Well Decommissioning (Subsea) Well Decommissioning (E&A wells)
WoS
NNS
CNS
£0 £2 £4 £6 £8 £10 £12
Decommissioning Costs (£bn)
23
Adjustment for cost estimate classification Well Decommissioning (Platform) Well Decommissioning (Subsea) Well Decommissioning (E&A wells)
24
Calculation basis: Scaling factor applied to subcategories. Scaling factor determined by Probabilistic Total/Deterministic Total
27UKCS Decommissioning Estimate – 2021
Reductions in well decommissioning costs are seen Figure 18: 2020 vs 2021 Well Decommissioning
across all well types and UKCS sectors with the Estimate Change
largest contraction seen in subsea well costs and in
(2021-2020) by Area (Probabilistic, Full Portfolio)
the Central North Sea (CNS) (Figure 18). Pockets of
best in class cost performance are evident however,
there remain substantial cost differences between SNS
the highest and lowest estimates. Well complexity
IS
and scope are two key drivers of cost and the OGA
is committed to working with industry to provide NNS
additional clarity and granularity of costs to reflect
WoS
these differences.
CNS
Large variances in well decommissioning estimates
-£1.2 -£1.0 -£0.8 -£0.6 -£0.4 -£0.2 -£0.0
exist between operators. OGA stewardship is
focussed on working with industry to develop a Decommissioning Costs £bn
greater understanding of reasons for such variances
and seeking to influence industry to improve cost (2021-2020) by Type (Probabilistic, Full Portfolio)
performance to align with the levels achieved by the
top quartile performers in the UKCS. Promoting best
practices and sharing of lessons learned both from
E&A
within the UKCS and other sectors/regions remains
a key component of continuous improvement and
driving the necessary cost efficiencies. Platform
The CNS fraction of the overall well decommissioning
cost estimate (2021 forward estimate excluding Subsea
actuals) remains high (~50%), due to the remaining
portfolio of high well decommissioning unit-cost -£1.8 -£1.6 -£1.4 -£1.2 -£1.0 -£0.8 -£0.6 -£0.4 -£0.2 -£0.0
subsea wells in the sector. Decommissioning Costs £bn
28UKCS Decommissioning Estimate – 2021
Understanding the condition of wells, prior to offshore mobilisation,
is key to developing robust execution plans, cost estimates and
managing execution and cost escalation risk. However, poor
historical well data continues to be a factor impacting planning and
execution and hence cost.
The concentration of the wells in terms of ownership and
geographical distribution highlights the potential for significant
efficiencies, and the OGA is engaging with operators to promote
an efficient liquidation of the scope through industry collaboration
and execution of well decommissioning through campaigns. OGA
initiatives and actions in support of furthering collaboration and
campaigns include:
• R
elaunching Energy Pathfinder to create transparency of scope
including visibility of future rig and service demand profiles
• S
haring of experience, and learning from decommissioning
execution
• F
acilitating engagements between well operators/owners where
decommissioning synergies are evident and cost savings could
be realised
29UKCS Decommissioning Estimate – 2021
5. Cost Opportunities and Risks
Significant and compelling opportunities exist to drive increased execution efficiency and cost reductions
The headline opportunities are: The risks to decommissioning cost escalation have been assessed,
with the primary risks deemed to be as follows.
• Industry mainstream adoption of campaign and collaborative
contracting models • Operator commercial misalignment/lack of collaboration
• C
reation of an environment and culture of stability and • Poor execution performance
certainty including increased visibility of work-scopes and
decommissioning milestones • Delayed activity planning
• Increased sharing and transfer of lessons learned plus good • Lack of real-time visibility of decommissioning during execution
practices through improved communication engagement and • Insufficient decommissioning skills or resources
stewardship
• Oil sector cost inflation
• Cost-effective late life operating models
30UKCS Decommissioning Estimate – 2021
6. OGA Actions and Next Steps
The OGA Decommissioning Strategy25 sets out the commercial transformation that is required to achieve cost
efficient delivery and meet the target to reduce the total UKCS decommissioning cost estimate by 35% by
end-2022. Consistent with the strategy the OGA priorities in 2021–22 are focused on:
OGA Decommissioning Priorities 2021–22
Stewardship engagement including:
lanning for
P
Decommissioning • Gather/share knowledge and learning from executing and delivering decommissioning
• Strategy for decommissioning including “right assets-right hands”
• Plan for decommissioning including review of cost estimate classification
• Plans for well decommissioning including campaigning
Commercial • Promote collaboration throughout stakeholder engagement
Transformation • Improve visibility of future decommissioning work including through Energy Pathfinder
• Work with operators, supply chain and trade bodies to establish well decommissioning campaign(s)
upport Energy
S • Development of a framework for industry to help assess repurposing opportunities
Transition
• Stewardship engagement to be widened to include repurposing opportunities
echnology, Process
T • Explore opportunities for trialling and deploying new and emerging technologies
and Guidance • Continue to promote, clarify and implement a robust regulatory process on well decommissioning
• Collaborate with regulators to ensure regulatory processes support the delivery of cost-efficient decommissioning
25
Oil and Gas Authority: Decommissioning Strategy - 2021 - Publications - News & publications (ogauthority.co.uk)
31UKCS Decommissioning Estimate – 2021
Appendix 1: Glossary of terms and definitions
2017 base line: AACE – Association for the Advancement of Cost Engineering
2016 OGA Annual Stewardship survey and portfolio formed basis
CNS – Central North Sea
of 2017 decommissioning cost estimate
CoP – Cessation of Production
Like-for-Like estimate: E&A – Exploration & Appraisal
Adjusted for inflation and aligned on a like-for-like basis with the
original portfolio IS – Irish Sea
M&A – Mergers and Acquisitions
Full Portfolio:
NNS – Northern North Sea
The remaining decommissioning cost for the updated full portfolio
(i.e. the latest view of remaining inventory, as from the beginning of NZTC – Net Zero Technology Centre
each report year)
OGA – Oil & Gas Authority
P&A – Plug & Abandon
SNS – Southern North Sea
UKCS – UK Continental Shelf
WBS – Work Breakdown Structure
WoS – West of Shetland
32UKCS Decommissioning Estimate – 2021
Appendix 2: Methodology
The OGA’s 2020 UKCS Stewardship Survey was used as the Figure 19: AACE Classification of Estimates (Simplified)
data source, with decommissioning cost inputs provided by all
operators for all current and proposed offshore facilities, pipelines,
Expected Accuracy Range
development wells, suspended open water exploration and Typical variation in Low and High ranges
appraisal wells and onshore terminals. Data was collected using Estimate at an 80% confidence interval
Class
the Oil & Gas UK Work Breakdown Structure (WBS).
Low High
The OGA’s approach, unchanged from previous years, has been to
develop a probabilistic cost estimate which takes into account the Class 5 -20% to -50% +30% to 100%
wide range of uncertainties in estimates submitted by operators.
Estimate classes in the survey were requested with reference to the
Association for the Advancement of Cost Engineering26 and AACE Class 4 -15% to -30% +20% to +50%
guidance followed for selecting the values from these ranges
(Figure 19). Class 3 -10% to -20% +10% to +30%
The estimate is comprised of various elements, where not all
components have the same level of estimate definition. The estimate Class 2 -5% to -15% +5% to +20%
classification was requested from the operators responding to the
UKCS Stewardship Survey and no adjustments were made to these Class 1 -3% to -10% +3% to +15%
operator self-assessments.
26
AACE Recommended Practice No. 18R-97 (simplified)
33UKCS Decommissioning Estimate – 2021
Figure 19 is a simplified version of the AACE classification. • Topsides Preparation
For purposes of the probabilistic calculation, the narrower
• Topsides Removal
downside (Low) range value was used. e.g. class 5 estimates
were given an expected accuracy range of -20% / +100%. This • Substructure Removal
is a computationally conservative option, as it will, if anything,
• Topsides and Substructure Onshore Disposal
result in a slight overstatement of total cost. This decision is to
address the possibility of estimating optimism from operators for • Subsea Infrastructure27
decommissioning scope.
• Site Remediation
The estimate raw data has been collected using the Oil & Gas UK
• Post-Decommissioning Monitoring
Decommissioning Work Breakdown Structure (WBS) which has the
following categories: Where required, deflation factors have been taken from the “GDP
deflators at market prices, and money GDP Statement”, published
• Project Management
by HM Treasury from data provided by the Office for National
• Post-CoP Running Costs Statistics (ONS) and Office for Budget Responsibility (OBR)28.
Values are taken from the Spring statement each subsequent year.
• Well Decommissioning
• 2019–2020 deflation factor29: 2.00%
• Facilities/Pipelines Permanent Isolation & Cleaning
27
incl. subsea structures, pipelines, mattresses, etc
28
https://www.gov.uk/government/collections/gdp-deflators-at-market-prices-and-money-gdp
29
Average from the last 3 years of GDP deflation factor (Source: HM Treasury)
34UKCS Decommissioning Estimate – 2021
Appendix 3: WoS
Figure 20: Geographical sector distribution of scope/cost30
NNS
■ Owners Cost
■ Well Decommissioning
■ Removals CNS
■ Subsea
■ Recycling, Site Rem and Monitoring
UK
7%
15%
10%
IS
25%
43%
SNS
30
Size of pie chart represents proportion of total decommissioning costs for UKCS
35UKCS Decommissioning Estimate – 2021
Appendix 4: Scope
The scope of the cost estimate is based
upon the decommissioning of all UKCS UKCS Decommissioning Scope31
infrastructure including:
• F
acilities and development wells still in
place and yet to be decommissioned >4000 wells
• A
ll infrastructure and development wells
currently undergoing decommissioning,
excluding work performed prior to 2017
>320 platforms to be re-used/removed
• All sanctioned facilities and wells not
yet in place
• Proposed project developments,
not yet sanctioned or built >2,000,000Te’s topsides
• All intra-field pipelines and export lines
• Suspended open water exploration
and appraisal wells >1,000,000Te’s substructures
• Onshore terminals
>75,000Te’s subsea structures
>20,000kms pipelines to be re-purposed/removed
31
Estimated scope as at Dec-2020
36UKCS Decommissioning Estimate – 2021
Appendix 5: Stewardship review process
The OGA’s stewardship process is central to meeting the strategic The OGA’s Decommissioning Strategy plus Stewardship
objective and priorities set out in the updated Decommissioning Expectation SE-10 including ‘Glidepath for success’ (Figure 21) set
Strategy. It provides a focal point to review decommissioning out the framework for successful planning and execution of cost-
readiness and a forum to consider individual infrastructure owner’s effective decommissioning.
strategies and plans for delivering decommissioning.
Figure 21: OGA Decommissioning Stewardship Glidepath
Late Life Operation
L O N G G L I D E P A T H
≥ 6yrs to 3yrs before CoP ≥ 3yrs before CoP
Strategy (corporate and UKCS)
Benchmarking and cost forecast dashboard
Learning/knowledge review and implementation
Technology assessment
Plan for decommissioning
Scope aggregation opportunities
Evaluate asset condition Contracting/Execution strategies (SCAP development)
Potential for re-use/re-purposing Implement decommissioning preparations and activities
Stewardship expectation
37UKCS Decommissioning Estimate – 2021
Appendix 6: Opportunity cost saving
Figure 22: Achieving the 35% Reduction
2017 baseline: £59.7bn Target: 35% reduction to £39bn by end 2022
Progress
Cost Category 2017 Baseline Reduction Target
to 2021
Well
Decommissioning 46% £27bn 35-65% £9-18bn 25%
Removals 26% £15bn 15-30% £2-5bn 24%
Subsea
Infrastructure 10% £6bn 30-50% £2-3bn 35%
Post CoP Running
Costs 7% £4bn 20-40% £1-2bn 6%
38Contact us at:
oga.correspondence@ogauthority.co.uk
OGA Headquarters
AB1 Building
48 Huntly Street
Aberdeen
AB10 1SH
OGA London Office
4th Floor
21 Bloomsbury Street
London
WC1B 3HF
www.linkedin.com/company/oil-and-gas-authority
twitter.com/ogauthority
Copyright © Oil and Gas Authority 2021
Oil and Gas Authority is a limited company registered in England and Wales with registered number 09666504 and
VAT registered number 249433979. Our registered office is at 21 Bloomsbury Street, London, United Kingdom, WC1B 3HF www.OGAuthority.co.ukYou can also read