Progress towards UNICEF South Asia's Headline and Complementary Results (2018-2021) - ReliefWeb
←
→
Page content transcription
If your browser does not render page correctly, please read the page content below
Progress towards UNICEF
South Asia’s Headline and
Complementary Results
(2018–2021)

                            1
Foreword

    Approximately 616 million, or one in four children                           3. 10 million previously out-of-school children
    worldwide, live in South Asia. Children under the age                           enrolled in school by 2021.
    of 18 years represent one third of all South Asians from                     4. 500,000 child marriages among girls and boys
    Afghanistan, Bangladesh, Bhutan, India, Maldives, Nepal,                        averted by 2021.
    Pakistan and Sri Lanka. Given its large child population,                    5. No new polio cases by the end of 2021 and 3.3
    South Asia is of pivotal importance to UNICEF and                               million additional children fully immunized by
    contributes significantly towards the organization’s global                     2021 with a focus on the most marginalized.
    targets and goals.                                                           6. 210 million fewer individuals practise open
                                                                                    defecation by 2021.
    UNICEF’s Regional Office for South Asia (ROSA) and the
    eight UNICEF country offices are working in partnership                  The Progress towards UNICEF South Asia’s Headline
    to advance the rights and well-being of every child in                   and Complementary Results (2018–2021) report
    South Asia. To achieve our shared goals, the UNICEF                      captures UNICEF’s progress across South Asia towards
    South Asia region identified six strategic priority areas                achieving the ambitious regional headline results.
    – Headline and Complementary Results – to focus                          Monitoring the progress in South Asia remains a
    on delivery of greater results for children. These were                  challenge due to the reliance on national household
    formulated as specific targets and are central to the                    survey data for several of the indicators. Given that
    UNICEF Regional Office Management Plan (ROMP)                            these surveys are generally conducted every three
    (2018–2021), aligned with the Global Strategic Plan. The                 to five years makes it challenging to track annual
    six Headline and Complementary Results are:                              progress. However, ROSA has managed to identify
                                                                             relevant and reliable data sources, proxy indicators
       1. Reduce newborn deaths from 28 per 1,000                            and complementary results to track relevant regional
          live births in 2016 to 21 per 1,000 live births                    progress. This report is the first systematized effort to
          by 2021. This will save an estimated 500,000                       analyse progress and covers the first half of the ROMP
          newborns.                                                          (2018–2019); where available, 2020 figures have also
       2. 10 million fewer children with stunted growth                      been included. The report was completed in the middle
          by 2021.                                                           of the response of the COVID-19 pandemic. Therefore,

2   Progress towards UNICEF South Asia’s Headline and Complementary Results (2018–2021)
it refers to some figures related to the impact of COVID     Zhang and his team in Data & Analytics who, in close
where data are available.                                    coordination with the Programme & Planning Team in
                                                             ROSA, the Regional Advisors and custodians of the
The report shows we have made tangible progress in           Headline and Complementary Results, made the report
several areas, including ending open defecation, saving      a reality.
newborn lives and averting child marriages. It also
highlights some of the areas where more actions and          This report is a powerful advocacy and monitoring
acceleration are needed, including polio eradication and     product for the region, and it will be updated in 2021. It
bringing children back to school, especially at secondary    is my hope that you will use these data accordingly and
level. It also shows some of the persistent data gaps        uphold your commitment to invest in the acceleration
and the need to strengthen data collection systems,          areas of the Headline and Complementary Results in
including administrative data sources. The COVID-19          order to foster equitable results for children in the region.
pandemic has severely impacted the lives of children and
families in the region and has deepened the inequalities;
it has also impacted UNICEF’s ability to monitor
children’s lives and contexts. This document will serve as
a benchmark to the progress made prior to the onset of
COVID-19 and will help us quantify the socioeconomic
and health impacts of the global pandemic in our region
as we develop the next update of progress in 2021.

This publication would not have been possible without
the support and commitment of many people. I
especially want to acknowledge the support received
from the Data, Analytics, Planning and Monitoring
Division at UNICEF headquarters under the leadership                                                     Jean Gough
of Vidhya Ganesh. My special appreciation to Yanhong                              Regional Director UNICEF South Asia

                                                                                                                  Foreword   3
4 Progress towards UNICEF South Asia’s Headline and Complementary Results (2018–2021)
Important progress has been
made for children – but what more
needs to be done?

Today, one out of three people living in South Asia      UNICEF’s Regional Office for South Asia recognizes
is a child. Children younger than 18 account for         the importance of supporting children from the
about 616 million of the region’s growing population     time they are newborns through adolescence and
of 1.86 billion, which encompasses eight countries:      youth. We are working to ensure every child grows
Afghanistan, Bangladesh, Bhutan, India, Maldives,        up in an environment that maximizes the chances
Nepal, Pakistan and Sri Lanka.                           of a healthy future and a long, productive life, as
                                                         reflected in our six Headline and Complementary
This statistical snapshot presents key available         Results for 2018–2021, which are referenced
data on the lives of South Asian children today,         throughout these pages. These targets also aim to
divided into five sections. We examine essential         take into account the unique needs of girls in South
elements to their well-being through the lens of         Asia.
health and physical development; outcomes in
school; exposure to violence, exploitation and           The publication of this brochure takes place amid
harm; access to clean and safe environments; and         the COVID-19 global crisis. The far-reaching impacts
progress in reducing poverty.                            of the pandemic on children have yet to be seen.
                                                         But we do know this unpredictable and dramatic
These data do not address all the issues affecting       time will carry many worrisome short- and long-
children in South Asia. Rather, they illustrate the      term consequences for children. This document
urgent need to prioritize children’s rights from a       provides an important baseline in understanding
broad range of perspectives. The information and         where South Asian children stood as the pandemic
brief analysis in this publication are meant to inform   dawned, and will serve as vital guidance as we
and guide further progress to address gaps in            navigate their evolving needs.
the lives of these children, while recognizing the
diversity of their needs across countries.

                                                                                                    Introduction   5
Over the last 30 years, we have seen rapid
    Goals for 2021                                                                 economic growth in South Asia. Remarkable
    A bold commitment to                                                           improvements have been made in the
    children’s rights                                                              socioeconomic situation of children. But massive
                                                                                   disparities still prevent millions of children from
                                                                                   living in dignity and reaching their full potential.
                                                                                   Too many children are not afforded the right to
                                                                                   make choices about their own future.

                                                                                   The region’s Headline and Complementary
                                                                                   Results for 2018–2021 recognize the urgency of
                                                                                   renewed focus and revitalized targets to tackle
                                                                                   pertinent development challenges and achieve
                                                                                   the Sustainable Development Goals (SDGs).
                                                                                   Concerted action is needed to close the huge
                                                                                   equity gaps and realize the rights of millions of
                                                                                   children across South Asia.

6   Progress towards UNICEF South Asia’s Headline and Complementary Results (2018–2021)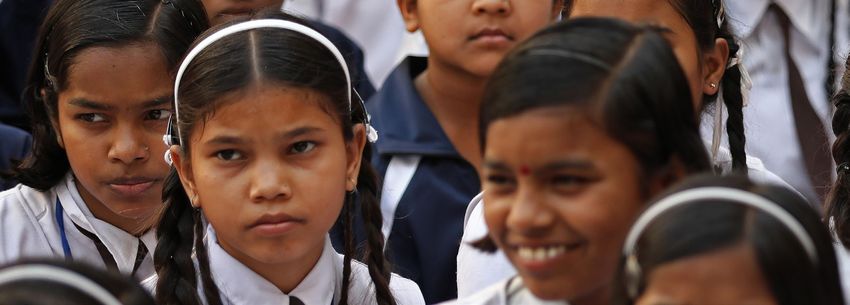
FIGURE 1. Headline and Complementary Results (2018–2021), UNICEF South Asia Regional Office

                                                   SAVE                                                               STOP
                                                 NEWBORNS                                                           STUNTING
                                   • 500,000 additional newborn lives saved                                 • 10 million fewer children
                                     by 2021                                                                    with stunted growth and
                                   • Neonatal mortality rate reduced from 26.8                                  development by 2021
                                     deaths per 1,000 live births in 2017 to 20.6
                                     deaths per 1,000 live births by 2021

                                                                Six headline results for
                                                                children in South Asia
          STOP OPEN                                           In partnership with governments, academia, civil society,                                 EVERY CHILD
                                                              media, private sector, foundations, individuals, and                                        LEARNS
          DEFECATION                                          communities, UNICEF South Asia has made the bold
• 210 million fewer people practising                         commitment to improve chidren’s rights in six key areas.                    • 10 million previously out-of-school children
  open defecation by 2021                                                                                                                   enrolled in pre-primary, primary and secondary
• 75 million people have access to                                                                                                          by 2021
  climate-resilient water facilities                                                                                                      • All UNICEF country offices have developed
                                                                                                                                            specific strategies to enhance teaching and
                                                                                                                                            learning by 2021

                                                 END CHILD                                              ERADICATE POLIO | FULLY
                                                 MARRIAGE                                                 IMMUNIZED CHILD
                                       • 500,000 child marriages among girls                          • No new polio cases by 2021
                                          and boys averted by 2021                                    • 3.3 million additional children fully
                                                                                                         immunized by 2021, with a focus on the most
                                                                                                         marginalized

                                                                                                                  Goals for 2021: A bold commitment to children’s rights               7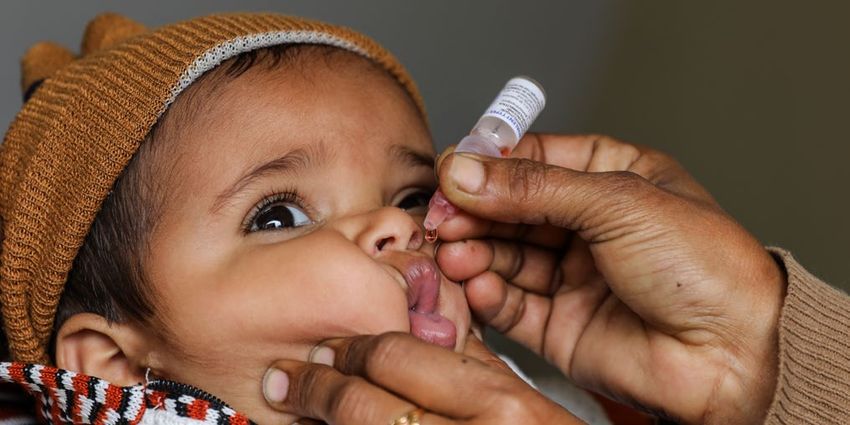
How healthy are South Asian children and their
    Every child survives                                                           mothers today? How are children under 5 years
                                                                                   of age doing? The answers provide important
    and thrives                                                                    insight into the overall health and development
                                                                                   of the region as a whole. This section considers
                                                                                   several vital aspects of children’s physical
                                                                                   well-being, including trends in nutrition,
                                                                                   immunization, and HIV. We also examine the
                                                                                   potentially disastrous impacts of COVID-19-
                                                                                   related changes to health care on the lives of
                                                                                   mothers and young children.

8   Progress towards UNICEF South Asia’s Headline and Complementary Results (2018–2021)
Child population

Population growth has slowed considerably across South Asia since the 1990s

Trends in child                               FIGURE 2A. Trends of child population (aged 0–17 years), by country (1990–2020)
populations vary
across the region: In                                   600

Afghanistan, the child
                                                        500
population almost
tripled over the last                                   400

30 years, but other
                                             Millions

countries have seen                                     300

much slower growth.                                     200
Bhutan and Sri Lanka
show a shrinking child                                  100

population, and, though
                                                          0
India is home to the                                              1990      1995                     2000                 2005                       2010                          2015                    2020
most children in the
                                              Source: United Nations Population Division, World Population Prospects 2019, online edition, rev. 1.
world, their number
increased by only 13
                                              FIGURE 2B. Trends of child population (aged 0–17 years), by country, without India (1990–2020)
per cent over the last
                                                        180
30 years.
                                                        160

                                                        140

                                                        120
                                             Millions

                                                        100

                                                         80
      Afghanistan
                                                         60
      Bangladesh
      Bhutan                                             40
      India
                                                         20
      Maldives
      Nepal                                                   0
      Pakistan                                                    1990       1995                    2000                 2005                       2010                          2015                    2020
      Sri Lanka
                                              Source: United Nations Population Division, World Population Prospects 2019, online edition, rev. 1.

COVID-19, child health and birth registration

An estimated 35 million children will be born in South Asia in 2020

With many services across South Asia non-operational                                          FIGURE 3. Projected number of births, by country (2020)
during the COVID-19 lockdowns, and the impacts of
fear and limited mobility of parents, both supply and
demand sides of immunization and birth registration
were impacted. We estimate more than 8.8 million
babies were born during the first 12 weeks of COVID-19
prevention lockdown. The birth, registration and                                              2020

immunization of these newborns were compromised
by parents’ limited mobility during lockdowns, parents’
fear of contracting COVID from health facilities and the
redeployment of staff responsible for essential MNH
services to the COVID response.                                                                      0             5        10                15              20              25          30                 35
                                                                                                                                                   Millions

Source: United Nations Population Division, World                                                        Afghanistan             Bangladesh                        Bhutan                      India
                                                                                                         Maldives                Nepal                             Pakistan                    Sri Lanka
Population Prospects 2019, online edition, rev. 1.

                                                                                                                                                                   Every child survives and thrives               9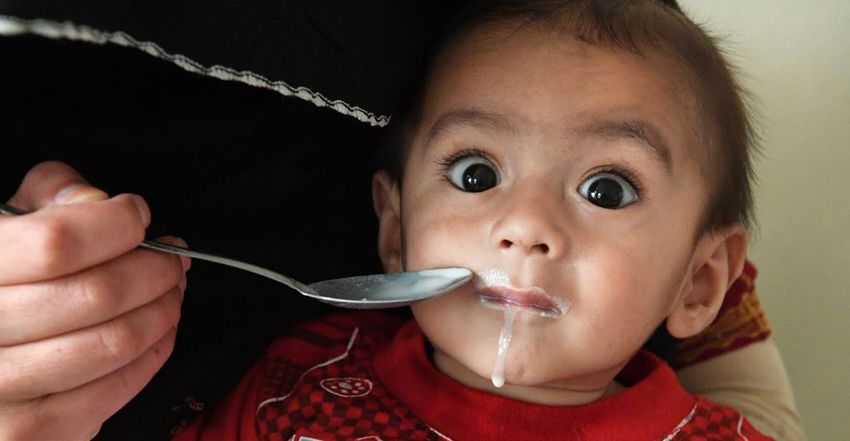
Economic growth and birth and death rates

     Most South Asian countries are currently in the early-dividend phase

     Demographic dividend is the                                    FIGURE 4. Demographic dividend type over time, by country (1990–2085)
     potential economic growth due
     to a decline in birth and death                                Sri Lanka
     rates and the resulting change
     in age structure. Sri Lanka                                    Maldives
     and Maldives are the only two
     South Asian countries in the                                 Bangladesh

     late-dividend period; all others
     are in the pre- or early-dividend                                    India

     stage. Time is running out
     for two countries to reap the                                    Bhutan

     economic benefits as they will
     transition to late dividend in the                                   Nepal

     next 10 years. Afghanistan is
     South Asia’s only pre-dividend                                  Pakistan

     country.
                                                                  Afghanistan

     Source: UNICEF analysis based on United Nations
     Population Division, World Population Prospects 2019,                        1990     2000            2010      2020           2030     2040       2050          2060          2070        2080   2085

     online edition, rev. 1.
     Note: Methodology of demographic dividend type
                                                                                             Pre-dividend                   Early dividend          Late dividend               Post-dividend
     adapted from World Bank, Global Monitoring Report
     2015–2016, 2016.

     Under-five mortality

     Under-five mortality rates
                                                                                           Afghanistan            62.3
     are high in the region, with
     Afghanistan and Pakistan lagging
     behind other countries                                                                                                                                    Nepal         32.2
     FIGURE 5. Under-five mortality rate (deaths per
     1,000 live births), by country (2018)                                                                                                                                          Bhutan        29.7
     Two of the region’s eight countries,
     Afghanistan and Pakistan, must
     redouble efforts if they are to meet
                                                                                     Pakistan       69.3
     the SDG under-five mortality target
     (25 or fewer deaths per 1,000 live
     births) by 2030. Two countries,                                                                                                                                          Bangladesh 30.2
     Maldives and Sri Lanka, have already
     met the target and the remaining four
     (Bangladesh, Bhutan, India and Nepal)                                                                                                                          India     36.6
     are on track.
                                                                                            >65

                                                                                            55–65
     Source: United Nations Inter-agency Group for Child Mortality
     Estimation (UN IGME), 2019.                                                            45–55

                                                                                            35–45
     Note: This map is stylized and not to scale. It does not reflect a
                                                                                            25–35
     position by UNICEF on the legal status of any country or territory                                                                                           Sri
     or the delimitation of any frontiers. The dotted line represents                        25                    Maldives           8.6                                     7.4
                                                                                                                                                               Lanka
     approximately the Line of Control in Jammu and Kashmir agreed                          Non-priority
                                                                                            country
     upon by India and Pakistan. The final status of Jammu and
     Kashmir has not yet been agreed upon by the parties.

10   Progress towards UNICEF South Asia’s Headline and Complementary Results (2018–2021)
South Asia has made progress in reducing its under-five mortality rate in the last 30 years; for instance,
India’s rate declined by 71 per cent from 1990 to 2018
Despite gains, the level of under-five mortality is still high in of life. High levels of neonatal mortality must be addressed
South Asia. In the region, more than 60 per cent of deaths to meet the SDG by 2030.
among children younger than 5 occur during the first month
FIGURE 6A. Under-five mortality rate, by country and region (1990–2018) FIGURE 6B. Under-five deaths, by country and region (1990–2018)
200 4,000,000
180 3,500,000
U5MR (deaths per 1,000 live births)
160
3,000,000
Number of deaths
140
2,500,000
120
100 2,000,000
80 1,500,000
60
1,000,000
40
500,000
20
0 0
1990 1992 1994 1996 1998 2000 2002 2004 2006 2008 2010 2012 2014 2016 2018 1990 1992 1994 1996 1998 2000 2002 2004 2006 2008 2010 2012 2014 2016 2018
Afghanistan Bangladesh Bhutan India Maldives Afghanistan Bangladesh Bhutan India Maldives
Nepal Pakistan Sri Lanka South Asia Nepal Pakistan Sri Lanka South Asia
Source: United Nations Inter-agency Group for Child Mortality Estimation (UN IGME), 2019. Source: United Nations Inter-agency Group for Child Mortality Estimation (UN IGME), 2019.
Fewer newborns are dying today than in 1990 – in India, by a degree of 65 per cent
The Regional Office headline results aim to reduce the number of newborn deaths, intensified efforts are needed to
number of newborn deaths between 2018 and 2021 by achieve this headline result.
500,000. While significant declines have been recorded in the
FIGURE 7A. Neonatal mortality rate, by country and region (1990–2018) FIGURE 7B. Neonatal deaths, by country and region (1990–2018)
80 1,800,000
70 1,600,000
1,400,000
60
Deaths per 1,000 live births
Number of deaths
1,200,000
50
1,000,000
40
800,000
30
600,000
20 400,000
10 200,000
0 0
1990 1992 1994 1996 1998 2000 2002 2004 2006 2008 2010 2012 2014 2016 2018 1990 1992 1994 1996 1998 2000 2002 2004 2006 2008 2010 2012 2014 2016 2018
Afghanistan Bangladesh Bhutan India Maldives Afghanistan Bangladesh Bhutan India Maldives
Nepal Pakistan Sri Lanka South Asia Nepal Pakistan Sri Lanka South Asia
Source: United Nations Inter-agency Group for Child Mortality Estimation (UN IGME), 2019. Source: United Nations Inter-agency Group for Child Mortality Estimation (UN IGME), 2019.
SAVE
NEWBORNS
• 500,000 additional newborn lives saved by 2021
• Neonatal mortality rate reduced from 26.8 deaths
per 1,000 live births in 2017 to 20.6 deaths per
1,000 live births by 2021
Every child survives and thrives 11Maternal deaths
Maternal mortality rates vary greatly in South Asia, with Afghanistan among the countries with the
highest rates globally
Maternal mortality refers to deaths FIGURE 8. Number of maternal deaths per 100,000 births, by country, region and globally
(2000–2017)
due to complications from pregnancy
or childbirth. From 2000 to 2017, 1,600
South Asia’s maternal mortality ratio 1,400
declined by 59 per cent, from 395
1,200
deaths per 100,000 per live births to
163 deaths per 100,000 live births.
Maternal deaths
1,000
In South Asia, all countries except 800
Afghanistan fall below the global
600
average of 211 deaths per 100,000
live births. 400
200
0
2000 2005 2010 2015 2017
Source: WHO, UNICEF, UNFPA, World Bank
Group and United Nations Population Division, Afghanistan Bangladesh Bhutan India Maldives
Nepal
Maternal Mortality: Levels and trends 2000 to 2017, 2019. Pakistan Sri Lanka South Asia World
COVID-19 and under-five and maternal deaths
Countless lives have been upended by COVID-19 – South Asia’s 600 million children are at increased
risk of death in the face of potential intervention disruptions
The effects of COVID-19 on delivery of preventative and that if the worst case scenarios become reality, more than
curative measures across South Asia have yet to show 880,000 additional under-five deaths and 36,000 maternal
their full impact. Different scenarios developed to project deaths could occur in just one year.
these impacts on the mortality of children and women show
FIGURE 9A. Additional under-five deaths due to assumed reductions FIGURE 9B. Additional maternal deaths due to assumed reductions in
in intervention coverage and increase in wasting prevalence for 3 intervention coverage for 3 scenarios in South Asia
scenarios in South Asia
1,000,000 40,000
900,000
35,000
800,000
30,000
700,000
Under-five deaths
25,000
Maternal deaths
600,000
500,000 20,000
400,000
15,000
300,000
10,000
200,000
5,000
100,000
0 0
SCENARIO 1 SCENARIO 2 SCENARIO 3 SCENARIO 1 SCENARIO 2 SCENARIO 3
3 months 6 months 12 months 3 months 6 months 12 months
Source: Roberton, Timothy, et al., ‘Early Estimates of the Indirect Effects of the COVID-19 Source: Roberton, Timothy, et al., ‘Early Estimates of the Indirect Dffects of the COVID-19
Pandemic on Maternal and Child Mortality in Low-income and Middle-income Countries: A Pandemic on Maternal and Child Mortality in Low-income and Middle-income Countries: A
modelling study’, The Lancet Global Health, 12 May 2020. modelling study’, The Lancet Global Health, 12 May 2020.
12 Progress towards UNICEF South Asia’s Headline and Complementary Results (2018–2021)Nutrition
Stunting rates are on the decline in South Asia but acceleration of progress is essential if the region
is to achieve the headline result
FIGURE 10A. Percentage of stunted, overweight and wasted children under age 5, in South Asia (2000–2019) There has been progress
60 towards realizing the
51.3 regional headline result
50
of reducing the number
40
of children with stunted
growth by 10 million
Percentage
30
33.2 between 2016 and 2021:
20
The number of stunted
children declined by 4.2
10 million, going from 60.3
2.4
2.5 14.8%
14.8% million in 2016 to 56.1
0
2000 2019 2000 2019 2019
million in 2019. This is
Stunted Overweight Wasted promising, but also below
what is needed to achieve
Source: UNICEF, WHO, International Bank for Reconstruction and Development/The World Bank, Levels and Trends in Child Malnutrition: Key findings of the regional target by 2021.
the 2020 edition of the Joint Child Malnutrition Estimates, 2020.
Furthermore, nearly 15 per
cent of children in South
Asia are wasted and thus
Globally, 144 million children are stunted – 56 million of them, or nearly face an increased risk of
two in five, live in South Asia death in the short term.
FIGURE 10B. Number of stunted, overweight and wasted children under age 5, in South Asia (2000, 2019)
100
90
80
Number (millions)
70
60
50 90.1
40
30
56.1
20
25.1
10 4.2 4.2
7.7
0
2000 2019 2000 2019 2019
Stunted Overweight Moderately wasted Severely wasted
Source: UNICEF, WHO, International Bank for Reconstruction and Development/The World Bank, Levels and Trends in Child
Malnutrition: Key findings of the 2020 edition of the Joint Child Malnutrition Estimates, 2020.
STOP
STUNTING
• 10 million fewer children with stunted growth
and development by 2021
Every child survives and thrives 13Vitamin A supplementation
More than a third of children in need are not receiving the life-saving benefits of vitamin A
supplementation in South Asia
Vitamin A supplementation is a FIGURE 11. Vitamin A supplementation two-dose coverage, by country (2018)
proven, low-cost intervention that
saves children’s lives. But this key
child survival activity only reached
59 per cent of children in need
in South Asia in 2018. Efforts are
59%
needed to ensure that more children
are protected and coverage does South Asia
not drop in countries that relied
on supplementary immunization
activities for polio as a delivery
platform.
≥80%
60–79%
Source: UNICEF global nutrition database, 2020, based
on administrative reports from countries for the 2018 40–59%
calendar year. 20–39%
Note: This map is stylized and not to scale. It does not ≤20%
reflect a position by UNICEF on the legal status of any No data
country or territory or the delimitation of any frontiers. Non-priority
country
The dotted line represents approximately the Line of
Control in Jammu and Kashmir agreed upon by India and
Pakistan. The final status of Jammu and Kashmir has not
yet been agreed upon by the parties.
Infant and young child feeding
Adopting optimal feeding practices is fundamental to a child’s survival, growth and development,
but too few children benefit
Despite the potential life-saving FIGURE 12. Per cent of children put to breast within 1 hour (2019), exclusively breastfed (2019),
benefits, only one in two newborns introduced to solid foods (2019), continued breastfeeding (2019), by country and region
in South Asia are put to the breast
100
within the first hour of life and less
than three in five infants aged 0–5
80
months are exclusively breastfed.
And, more than two in five infants
aged 6–8 months are not yet eating 60
Percentage
solid foods, posing a threat to their
growth and development. 40
20
0
Source: UNICEF global databases on infant and young child Early initiation of breastfeeding Exclusive breastfeeding (0–5 months) Introduction to solids, Continued breastfeeding (12–23 months)
semi-solids, soft foods (6–8 months)
feeding, 2020.
Note: Each dot represents prevalence at the country level. Afghanistan Bangladesh Bhutan India Maldives
Nepal Pakistan Sri Lanka South Asia
The bar represents the regional aggregate.
14 Progress towards UNICEF South Asia’s Headline and Complementary Results (2018–2021)Immunization
ERADICATE POLIO | FULLY
IMMUNIZED CHILD
• No new polio cases by 2021
• 3.3 million additional children fully immunized by
2021, with a focus on the most marginalized
Polio immunization rates have significantly improved during the previous three decades, with near
universal coverage achieved in Bangladesh, Bhutan, Maldives and Sri Lanka
FIGURE 13A. Coverage of Polio3 and IPV1, in South Asia FIGURE 13B. Coverage of Polio3 (%), South Asia is the only
(1990–2019) by country (2019) region in the world where
100
Country Polio3
polio is still endemic.
88
Pockets of populations
81
Afghanistan 73
75 objecting to vaccination
Bangladesh 98
and highly mobile, cross-
Coverage (%)
Bhutan 97
50
border populations have led
India 90 to the continued spread of
25
Maldives 99 the virus. A key goal in the
Nepal 92 region is to achieve zero
0
1990 1995 2000 2005 2010 2015 2019 Pakistan 75 transmission of the virus.
Polio3 IPV1 Sri Lanka 99
Source: WHO/UNICEF estimates of national immunization coverage, Source: WHO/UNICEF estimates of national
2019 revision. immunization coverage, 2019 revision.
Despite vaccinating more children than ever before, sustained efforts are needed to maintain high
DTP3 and MCV1 coverage levels in South Asia amid COVID-related immunization service disruptions
FIGURE 14A. Number of un- and undervaccinated infants FIGURE 14B. Coverage of DTP3 and MCV1, in Regionally, coverage rates
children to protect against diphtheria, tetanus, and South Asia and globally (1990–2019) for DTP3 and MCV1 have
pertusis (DTP) and measles, by country (1990–2019)
increased by more than
20.0
DTP3 DTP3 30 and 40 percentage
100
88 points, respectively, since
Number of un− and undervaccinated infants (millions)
15.0 85
75
1991; in the same period,
10.0
50 the number of vaccinated
5.0
25
children grew by more than
0.0
10 million and nearly 15
Coverage (%)
20.0
MCV1
0
million for DTP3 and MCV1,
MCV1
100
15.0
91 respectively. But not all
10.0 75 85
countries have achieved
5.0
50
and maintained the Global
0.0 Vaccine Action Plan target
1990 1995 2000 2005 2010 2015 2019 25
of 90 per cent coverage
Afghanistan Bangladesh India Nepal Pakistan
0 for DTP3. COVID-related
1990 1995 2000 2005 2010 2015 2019
impacts are introducing
Source: WHO/UNICEF estimates of national immunization coverage, 2019 South Asia Global
revision; United Nations Population Division, World Population Prospects 2019,
new challenges to maintain
online edition, rev. 1. coverage and reduce
Note: ValuesHIV
Prevalence rates are low, but in highly populous South Asia, 15,000 became infected with HIV in 2019
alone
In 2019, 8,000 (4,300 – 12,000) FIGURE 15. Number of children and adolescents aged 0–19 years living with HIV, by country (2019)
children were infected with
HIV during pregnancy, birth or Number of children and adolescents aged 0–19 years
Country
breastfeeding. South Asia’s living with HIV
transmission rate is still at 30.8, Pakistan 8,600 (6,300 – 12,000)
far above the global rate of Nepal 1,700 (1,500 – 2,100)
11.4, and PMTCT coverage is
only at 54 per cent. Substantial Afghanistan 720 (Gains have been made in prevention of mother-to-child transmission (PMTCT), but almost half of
pregnant mothers living with HIV in the region do not receive treatment
FIGURE 17. Percentage of pregnant women living with HIV receiving antiretroviral medicines and PMTCT coverage increased
number of children under 5 infected with HIV for every 100 pregnant women living with HIV, in from less than 1 per cent in
South Asia (2010–2019)
2010 to 54 per cent in 2019.
However, the mother-to-child-
100 50
transmission rate remains
90 45 at 30.8 (21.5 – 36.2) per 100
80 40 pregnant women living with
HIV, higher than the global rate
Mother-to-child HIV transmission rate
70 35
PMTCT coverage (%)
of 11.4 (9.1 – 14.2).
60 30
50 25
40 20
30 15
20 10
10 5Every child learns Education is the cornerstone of a child’s cognitive
and socioemotional development, personal
empowerment and prospects for the future. This
includes quality education in a safe environment
conducive to learning. In South Asia, 12.4 million
primary school-age children and 16.5 million children
of lower secondary age are out of school. Millions
of children complete primary education without
mastering foundational basic numeracy and reading
skills.
18 Progress towards UNICEF South Asia’s Headline and Complementary Results (2018–2021)Completion rates
Completion rates in India are higher than for most countries in South Asia and are elevating the regional
averages
In South Asia, primary education FIGURE 18. Completion rate of primary, lower secondary and upper secondary education, by country,
region and globally (2010–2018)
completion rates have gone up in
recent years. In contrast, upper 100
secondary completion rates stand at 90
41 per cent, below the global figure
80
(44 per cent). Across the region,
there is strong variation: Afghanistan 70
and Bhutan show lower completion 60
rates, while those in India are higher.
50
With its large population, India highly
influences the regional average 40
upwards.
30
20
10
0
Afghanistan Bangladesh Bhutan India Nepal Pakistan South Asia World
Primary Lower secondary Upper secondary
Source: www.data.unicef.org, 2020.
Learning and access
The majority of countries in South Asia lack data on reading proficiency
While data are scarce at all three FIGURE 19. Proportion of students having reached minimum reading proficiency, in South Asia
levels – between 50 and 75 per (2000–2019)
cent of countries have no data 8 0 0 0
– for the few that do have data,
7 2 2
the picture is very bleak. For
3
example, at the Grade 2–3 level,
6 0
fewer than 50 per cent of students 1
have reached minimum reading
5
proficiency in the four countries
Number of countries
1
with available data. 4
3 6
5
4
2
1
0
Grade 2–3 Primary Lower secondary
No data Less than 25% 25–50% 50–75% Greater than 75%
Source: UNESCO Institute for Statistics database, 2019.
Every child learns 19School environment
In countries where data are available, basic services are generally present
Across South Asia, countries FIGURE 20. Proportion of primary and secondary schools with basic services, in South Asia (2010–2019)
report higher proportions of
Portable water Electricity Single-sex toilets Trained teachers
basic service coverage in upper 8
secondary schools than in
7
primary schools. Data suggest 3 3
the highest coverage of trained 6 4 4
teachers: Seven countries report 5 5
6
Number of countries
5
over 75 per cent coverage in 1 7
primary education and six report 4 2
over 75 per cent coverage in 1 1
3 2
secondary education. But only 1
three report school coverage of 2 2
single-sex toilets higher than 75 1 3 3 3
1 2 2
per cent in primary education.
1 1 1
0
Primary Secondary Primary Secondary Primary Secondary Primary Secondary
No data Less than 25% 25–50% 50–75% Greater than 75%
Source: UNESCO Institute for Statistics database, 2019.
EVERY CHILD
LEARNS
20 Progress towards UNICEF South Asia’s Headline and Complementary Results (2018–2021)Out-of-school children (OOSC)
The number of children out of school in South Asia decreased sharply until 2015; progress has since
slowed
FIGURE 21A. Rate of OOSC, in South Asia (1999–2018) In 1999, over 150 million children
80 in South Asia were out of school.
From 1999 to 2015, OOSC rates
70
from primary through upper
60
secondary dropped significantly;
50 however, in 2018, the rates for
primary and lower secondary
OOSC rate
40
were similar to those of 2015.
30
In 2018, over 90 million children
20 were still out of school in the
region, most of whom should
10
have been attending upper
0
1999 2000 2001 2002 2003 2004 2005 2006 2007 2008 2009 2010 2011 2012 2013 2014 2015 2016 2017 2018 secondary education.
Primary education Lower secondary education Upper secondary education
Source: UNESCO Institute for Statistics database, 2019.
FIGURE 21B. Number of OOSC, in South Asia (1999–2018)
90
80
70
60
50
Millions
40
30
20
10
0
1999 2000 2001 2002 2003 2004 2005 2006 2007 2008 2009 2010 2011 2012 2013 2014 2015 2016 2017 2018
Primary education Lower secondary education Upper secondary education
Source: UNESCO Institute for Statistics database, 2019.
EVERY CHILD
LEARNS
• 10 million previously out-of-school children
enrolled in pre-primary, primary and secondary
by 2021
• All UNICEF country offices have developed
specific strategies to enhance teaching and
learning by 2021
Every child learns 21Every child Every child has the right to feel safe and
protected and to reach her or his full potential.
is protected Child marriage is a gross violation of this right,
a practice that is still prevalent in many South
from violence,
Asian countries, as the data in this section
show. India, for instance, is home to one in
three of the world’s child brides. This section
exploitation and also explores birth registration, a critical first
step in ensuring lifelong protection by the law
harmful practices and a prerequisite for exercising many rights.
22 Progress towards UNICEF South Asia’s Headline and Complementary Results (2018–2021)Child marriage
Levels of child marriage vary greatly across South Asia – the highest prevalence is seen in Bangladesh,
where half of young women were married during childhood
Over the past decade, FIGURE 22. Percentage of women aged 20 to 24 years who were first married or in union before age 15
and before age 18, by country (2010–2019)
the proportion of young
women married as children 100
decreased by more than a 90
third, from one in two to 80
70
approximately one in three.
Percentage
60 51
Though substantial progress
50 40
has been made – particularly 40 28 27
in India and Maldives – 30
26
18
further acceleration is 20
10
needed to reach the SDG 10 2
target of eliminating child 0
Bangladesh Nepal Afghanistan India Bhutan Pakistan Sri Lanka Maldives
marriage by 2030.
Before age 15 At or after age 15 but before age 18
Source: UNICEF global databases, 2020, based on MICS, DHS and other nationally representative surveys, 2010–2019.
END CHILD
MARRIAGE
• 500,000 child marriages among girls and boys
averted by 2021
Birth registration
In countries where fewer children are registered before turning 5, different registration trends are observed
by age
Birth registration is universal FIGURE 23. Percentage of children whose births are registered (by age), by country (2010–2019)
(or close to universal) in 100
Bhutan and Maldives. In 90
all other countries, recent 80
70
household surveys show
60
Percentage
rising coverage levels of 96 100 100 100
50
birth registration, with 40
79 78
75 69
Bangladesh making large 30 51
47
gains in recent years. 20 33 35
41
33
Nevertheless, about 30 per 10
cent, or 51 million children 0
Nepal Pakistan Bangladesh Afghanistan India Maldives Bhutan
under age 5, still do not
Children aged 0 –11 months Children aged 48–59 months
have their birth registered.
Source: UNICEF global databases, 2020, based on MICS, DHS and other nationally representative surveys, 2010–2019.
Note: Data by age are not available for Sri Lanka because there is no access to the dataset. Data for Pakistan do not include Jammu and
Kashmir and Gilgit-Baltistan regions.
Every child is protected from violence, exploitation and harmful practices 23Every child lives Great strides have been made in ending open
defecation in South Asia, but much work remains:
in a safe and clean The region accounts for over 60 per cent of the
global burden. COVID-19 has reiterated the need
environment for clean water and handwashing in every home,
school, and health care facility with dramatic force.
Data in South Asia demonstrate that too many
families live in homes without access to these life-
saving measures. This is cause for great concern
and necessitates action.
24 Progress towards UNICEF South Asia’s Headline and Complementary Results (2018–2021)Open defecation
An additional 212 million South Asians are now living in communities free of open defecation
The original headline result FIGURE 24. Population living in open-defection free declared communities, by year of declaration and
cumulative total trend (2014–2019)
formulated in 2017 was to
reduce the number of open 250
defecators in South Asia by 148
million. By the end of 2019, 200
halfway through implementation,
Cumulative number
this target had been achieved.
Population (millions)
150
The headline result was Regional headline results target
then adjusted to 210 million 96.7
fewer people practising open 100
defecation by 2021, with a 67.0
special focus on water. 50
32.2
10.2
2.0 4.8
0
2015 2016 2017 2018 2019 2020
Source: National ODF campaign data and annual reports of UNICEF offices in South Asia, 2014–2019.
STOP OPEN
DEFECATION
• 210 million fewer people practising open
defecation by 2021
• 75 million people have access to climate-
resilient water facilities
Every child lives in a safe and clean environment 25Handwashing
Two in five households and half of schools lack basic handwashing facilities with soap and water
available
In South Asia, washing hands with soap and water at home to be the limiting factor for having a handwashing facility
and in school receives too low a priority despite availability with soap and water at home.
of basic water services. Availability of water does not seem
FIGURE 25A. Access to basic hygiene and basic water services in homes FIGURE 25B. Household coverage of basic hygiene and basic water
(2017), schools and health care facilities (2016), in South Asia services, in six countries (2017)
100 97
Bangladesh
35
67
80 Afghanistan
38
89
Nepal
60 48
Percentage (%)
92 92 93
India
60
40
68
57 91
Pakistan
53 60
20
99
Maldives
96
NO
DATA 0 20 40 60 80 100
0
Households Schools Health care facilities Coverage (%)
At least basic water Basic hygiene At least basic water Basic hygiene
Source: WHO/UNICEF Joint Monitoring Programme (JMP) for Water Supply, Sanitation and Hygiene (WASH), 2020. See South Asia regional WASH snapshot.
Coverage of handwashing facilities varies widely within countries
There are large disparities in the availability of handwashing facilities equipped with soap and water are more prevalent in
facilities at home between the richest and poorest urban than in rural areas.
households in South Asia. In most countries in the region,
FIGURE 26A. Inequalities in the proportion of population with handwashing FIGURE 26B. Inequalities in the proportion of population with handwashing
facilities with soap and water by wealth quintiles, by selected countries facilities with soap and water by urban and rural areas, by selected
(%) (2017) countries (%) (2017)
Bangladesh Bangladesh
Afghanistan
Pakistan
Nepal
Afghanistan
India
India
Pakistan
Nepal Maldives
0 20 40 60 80 100 0 20 40 60 80 100
Basic hygiene coverage (%) Basic hygiene coverage (%)
Poorest Poor Middle Rich Richest Rural Urban
Source: WHO/UNICEF Joint Monitoring Programme (JMP) for Water Supply, Sanitation and Hygiene (WASH), 2020. See South Asia regional WASH snapshot.
26 Progress towards UNICEF South Asia’s Headline and Complementary Results (2018–2021)27
Every child has a                                                           The story of child poverty in South Asia is
                                                                                 encouraging. Major advancements have been made

     fair chance in life                                                         in reducing poverty in all countries, with varying
                                                                                 degrees of progress. But COVID-19 threatens to
                                                                                 send millions more children into poverty. Data on
                                                                                 social protection are sparse, but those on public
                                                                                 expenditure demonstrate the region is not spending
                                                                                 as much as other countries in the world in most
                                                                                 sectors. UNICEF leverages these important child
                                                                                 poverty data to diagnose problems and advocate for
                                                                                 solutions.

28   Progress towards UNICEF South Asia’s Headline and Complementary Results (2018–2021)
Child poverty
Children suffer poverty differently from adults – thus the need to measure their poverty directly, in terms of
their own deprivations
Decline in terms of percentage FIGURE 27. Percentage point decline, in five countries (2008–2016)
points is shown here and 40
presents, for the first time,
comparisons strictly comparable 35
across country and through
30
time. About 325 million children
are deprived in at least one
25
Percentage points
area – education, health,
housing, nutrition, water, and/ 20
or sanitation. This staggering
number is lower than a decade 15
ago (in spite of population
growth). 10
5
0
India Maldives Bangladesh Nepal Pakistan
Source: Latest available DHS for each country.
COVID-19 and children in monetary poor households
Using national poverty lines, an estimated 170 million children were living in monetary poor households
in the region
The most recent World Bank FIGURE 28. Additional number of children in monetary poor households, in South Asia (2020–2021)
estimates of economic decline
due to COVID-19, combined 40
with likely changes in income
35
distribution based on historical
trends and experience, 30
show that the number of
children living in monetary 25
Millions of children
poor households are likely to
20
increase by almost 30 million in
34 35
2020. Depending on how fast 33 35.1
15 28
the economy recovers, there 26
could be an additional 10 to 35 10
million South Asian children in 13
monetary poor households in 5 10
2021 compared to 2019.
0
2020 2021 (compared to 2019) 2020 2021 (compared to 2019) 2020 2021 (compared to 2019) 2020 2021 (compared to 2019)
Most optimistic GDP; Most optimistic GDP; Most pessimistic GDP; Most pessimistic GDP;
Least distribution effect Mild distribution effect Mild distribution effect Most distribution effect
Source: UNICEF analysis based on data from DHS, MICS, UNU WIDER, IMF, and Word Bank.
Every child has a fair chance in life 29Investment in children and families
South Asian children face a magnitude of challenges; large sums should be invested in the social
sectors to help and protect them
The regional average for public FIGURE 29. Public investment in education, health, and social protection (% of GDP), by country, region
investment in education and and globally (2010–2018)
health is below the world Education Health Social protection
average – in some countries,
Afghanistan Afghanistan
by less than a third or a quarter.
Bangladesh Bangladesh
Only in the realm of social Bhutan Bhutan
protection are these investments India India
slightly above the world average. Maldives Maldives
However, many South Asian Nepal Nepal
countries are spending way Pakistan Pakistan
below these levels and almost Sri Lanka Sri Lanka
none of them have data on South Asia South Asia
coverage of children by social World World
protection systems. 0.0 1.0 2.0 3.0 4.0 5.0 6.0 7.0 8.0 0.0 1.0 2.0 3.0 4.0 5.0 6.0 7.0 8.0 0.0 1.0 2.0 3.0 4.0 5.0 6.0 7.0 8.0
% of GDP
Afghanistan Bangladesh Bhutan India Maldives
Nepal Pakistan Sri Lanka South Asia World
Source: UNICEF, The State of the World’s Children, 2019.
30 Progress towards UNICEF South Asia’s Headline and Complementary Results (2018–2021)31
32 Progress towards UNICEF South Asia’s Headline and Complementary Results (2018–2021)
Data and Analytics Section
Division of Data, Analytics, Planning and Monitoring   UNICEF Regional Office for South Asia
UNICEF

© United Nations Children’s Fund (UNICEF)
October 2020

Photography credits
Cover page: © UNICEF/UNI87429/Ferguson            Page 20: © UNICEF/UNI260365/Crouch
Page 2-3: © UNICEF/UNI281299/Mukherjee            Page 21: © UNICEF/UNI202025/Lopez
Page 4: © UNICEF/UNI78184/Siddique                Page 22: © UNICEF/UN0276245/Boro
Page 6: © UNICEF/UNI248830/Mawa                   Page 23: © UNICEF/UN0342660/Kolari
Page 8: © UNICEF/UN0125844/Sharma                 Page 24: © UNICEF/UN020833/Singh
Page 11: © UNICEF/UNI239591/Chak                  Page 25 upper: © UNICEF/UN020836/Singh
Page 13: © UNICEF/UN0339434/Frank Dejongh         Page 25 lower: © UNICEF/UN0339980/Frank Dejongh
Page 14 upper: © UNICEF/UNI217679/Zaidi           Page 27: © UNICEF/UN0339403/Frank Dejongh
Page 14 lower: © UNICEF/UNI314573/                Page 28: © UNICEF/UN0326969/Brown
Page 15: © UNICEF/UNI41461/Pirozzi                Page 30: © UNICEF/UNI284557/Vishwanathan
Page 17: © UNICEF/UN0119449/                      Page 31: © UNICEF/UNI320903/Fazel
Page 18: © UNICEF/UN0339382/Frank Dejongh         Page 32-33: © UNICEF/UNI205870/Karimi

                                                                    Copyright and acknowledgments   33
UNICEF UNICEF Regional Office
Data and Analytics Section for South Asia
Division of Data, Analytics, Planning
and Monitoring
3 United Nations Plaza P.O. Box 5815, Lekhnath Marg
New York, NY 10017, USA Kathmandu, Nepal
Email: data@unicef.org Email: rosa@unicef.org
Website: data.unicef.org Website: www.unicef.org/rosa
34 Progress towards UNICEF South Asia’s Headline and Complementary Results (2018–2021)You can also read