Comprehensive Warning Visualization for JIT-unfriendly Code in JavaScript - Courses
←
→
Page content transcription
If your browser does not render page correctly, please read the page content below
Final Project Report for INFO-247 Information Visualization and Presentation, Spring 2016

                   Comprehensive Warning Visualization for
                      JIT-unfriendly Code in JavaScript
                                 Liang Gong, EECS, UC Berkeley
                               gongliang13@cs.berkeley.edu
                                                May 8, 2016

1    Motivation & Project Goals
JavaScript has become one of the most popular programming languages. It powers various popular websites
and has become the de facto web assembly language. The efficiency of the JavaScript engines become crucial
to the success of most web applications. Most modern JavaScript engines use just-in-time (JIT) compilation
to translate parts of JavaScript code into efficient machine code at runtime. Despite the overall success of JIT
compilers, programmers may still write code that uses the dynamic features of JavaScript in a way that prohibits
profitable optimizations. Previously, there was no way to measure how prevalent such JIT-unfriendly code is
and to help developers detect such code locations. We have proposed a tool called JITProf [14], a profiling
framework to dynamically identify code locations that prohibit profitable JIT optimizations. The key idea is
to associate meta-information with JavaScript objects and code locations, to update this information whenever
particular runtime events occur, and to use the meta-information to identify JIT-unfriendly operations. The tool
has gotten attention from both academia and industry. More specifically, this tool inspired Mozilla Research to
develop an equivalent tool called JIT-Coach [2, 20]. The tool was specifically designed for their SpiderMonkey
JavaScript engine that is used in Firefox Browser. Recently, Intel has also contacted us and showing interest in
our tool.
    However, all of these existing state-of-the-art JIT-unfriendly code detection tools simply dump a list of
warnings with their line numbers. The warning message contains the warning type, source location and some
structured information that is specific to the type of problems detected by JITProf. Normally to show the whole
problem, a single warning can contain dozens of lines of text (see a live demo in [3]) or even hundreds of lines
of text in the console. This makes debugging based on the warning message tedious and less productive. To
make the problem even worth, normally our tool will analyze the runtime pattern of an entire website which
may consist of tens of thousands of lines of JavaScript code. This normally leads to the generation of hundreds
of warnings. There is currently no way to get an overview of all those warnings.
    In this project, we propose to implement a special visualization tool to show warnings generated by
dynamic analysis tool such as JITProf. Our framework is built on top of the Jalangi framework and provide a
comprehensive visualization that consists of an overview of statistics of all warnings generated by the dynamic
analysis tool, a group of customized visualization schema for each specific type of warnings, and an interface
to easily associate runtime data with the corresponding source code. To my best knowledge, there is no existing
work for visualizing JIT-unfriendly code in a large code base.
    The goal is to visualize the JIT-unfriendly code detected by JITProf and hopefully to make the debugging
process productive and delightful. Instead of reading possibly hundreds of lines of text in the console, the
potential users of our visualization system should get a quick overview of what kind of problems are there in
their source code and which problem is most severe. The visualization system should also provide easy to
comprehend details when the user is interested in looking for more runtime information when debugging.

                                                       1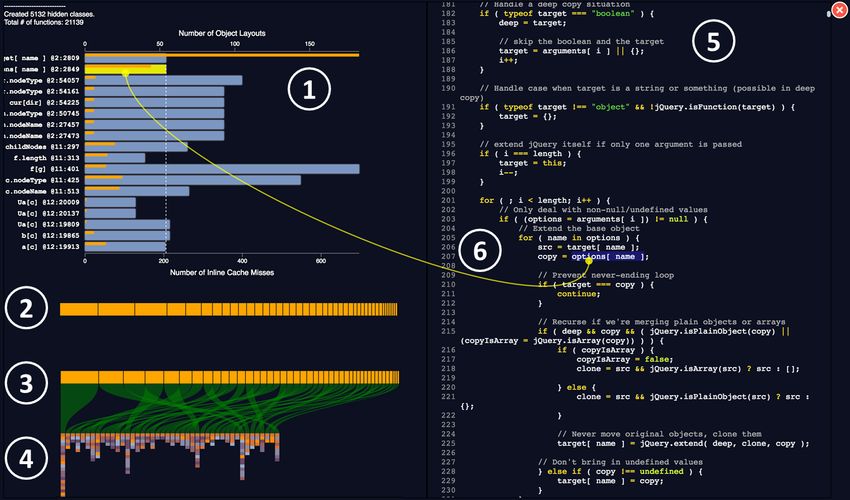
Final Project Report for INFO-247 Information Visualization and Presentation, Spring 2016

 1   function C(i) {                                              function C(i) {
 2     if (i % 2 === 0) {                                           if (i % 2 === 0) {
 3       this.a = Math.random();                                      this.a = Math.random();
 4       this.b = Math.random();                                      this.b = Math.random();
 5     } else {                                                     } else {
 6       this.b = Math.random();                                      this.a = Math.random();
 7       this.a = Math.random();                                      this.b = Math.random();
 8     }                                                            }
 9   }                                                            }
10   function sum(base, p1, p2) {                                 function sum(base, p1, p2) {
11     return base[p1] + base[p2] ;                                 return base[p1] + base[p2];
12   }                                                            }
13   for(var i=1;i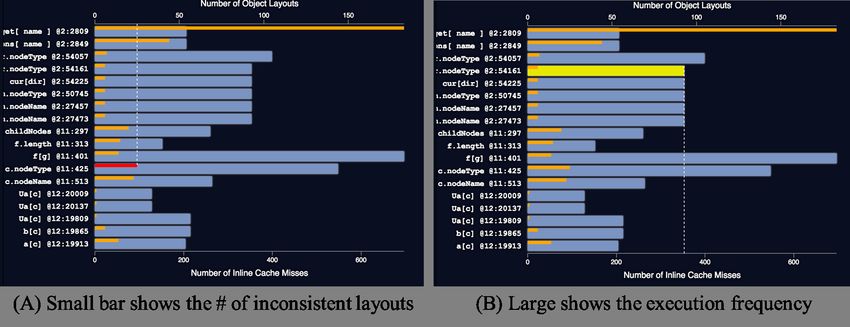
Final Project Report for INFO-247 Information Visualization and Presentation, Spring 2016

misses by maintaining the following shadow-information for each location with a put or get property operation:
(i) The cachedHC storage, which points to the hidden class of the most recently accessed base object. (ii) The
cachedP rop storage, which stores the name of the most recently accessed property. Whenever the program
performs a get or put property operation, the profiler updates the information associated with the operation’s
code location. If the hidden class of the operation’s base object or the accessed property differs from cachedHC
and cachedP rop, respectively, then the profiler increments the unfriendliness counter. This case corresponds
to an inline cache miss, i.e., the JIT compiler cannot execute the code specialized for this location and must fall
back on slower, generic code. At the end of the execution, the profiler reports code locations with a non-zero
unfriendliness counter and ranks them.
     For the example in Figure 1, JITProf identifies two inline cache misses at line 11, and reports the following
message:
Prop. access at line 11:10 has missed cache 99999 time(s)
  Accessed "a" of obj. created at line 14:11 99999 time(s)
  Layout [|b|a|]: Observed 50000 time(s)
  Layout [|a|b|]: Observed 49999 time(s)
Prop. access at line 11:21 has missed cache 99999 time(s)
  Accessed "b" of obj. created at line 14:11 99999 time(s)
  Layout [|b|a|]: Observed 50000 time(s)
  Layout [|a|b|]: Observed 49999 time(s)

2.2     System Architecture
In this section, we introduce our analysis framework for the front-end JavaScript. Our framework provides a
streaming processing system that processes and analyzes the captured runtime streaming information in real-
time without sending raw data back to the server.
    We implement our framework in a prototype framework written purely in JavaScript. Our framework
instruments JavaScript code through source-to-source transformation and the instrumented code checks and
reports at runtime various code locations that execute the runtime bug patterns. We instantiate our framework
for several runtime operational patterns that may be caused by buggy code in the program under analysis. We
apply our approach to the programs in real-world JavaScript-intensive websites and the SunSpider and Octane
benchmark suites. We are surprised by the bugs identified by our framework despite the popularity and wide
adoption of those applications and benchmarks.

2.3     Instrumentation Framework
The first and most fundamental part of our system is a source-to-source transformation system that automatically
adds additional analytical semantics to a given program. Despite the difficulties of implementing the code
instrumentation for JavaScript, the benefits of doing code transformation are many-folds 1) it provides finer
granularity of dynamic analysis interface; 2) no modification to the virtual machine is required; 3) analysis
code is written in JavaScript which is familiar to front-end developers; 4) the JavaScript analysis framework is
highly portable, as long as the JVM adheres to the ECMAScript standard [9], the JavaScript analysis framework
can work on it with trivial migration effort. Moreover, This approach avoids limiting JITProf to a particular
JavaScript engine. The framework instruments a JavaScript program through source-to-source transformation
and then, the instrumented code is executed in place of the original code. To illustrate the concept of code
instrumentation, we show a small piece of JavaScript code on the left part of the following figure, and its
instrumented variant on the right:
  1   var a = b + c ;                                   1    var a = W ( B ( R (b , ’b ’) , R (c , ’c ’) , ’b ’ , ’c ’) , ’a ’ );

    As we adopt source manipulation to add hooks instead of modifying the underlying virtual machine and
consequently the front-end analysis framework integrates analysis code into the programming context of the
target code. The analysis code is executed in an external function to be called during the execution of the
transformed target code. So the analysis code programming context and paradigm is the same as the JavaScript
application. This makes it easy for any JavaScript developer to write their own analysis module. In contrast
existing dynamic analysis framework often requires an understanding of the underlying virtual machine or
physical machine mechanism, which is error-prone and demands a shift of programming paradigm. Function
R(b, ’b’) means the callback function (i.e., hook) that monitors the reading operation of variable b, the

                                                             3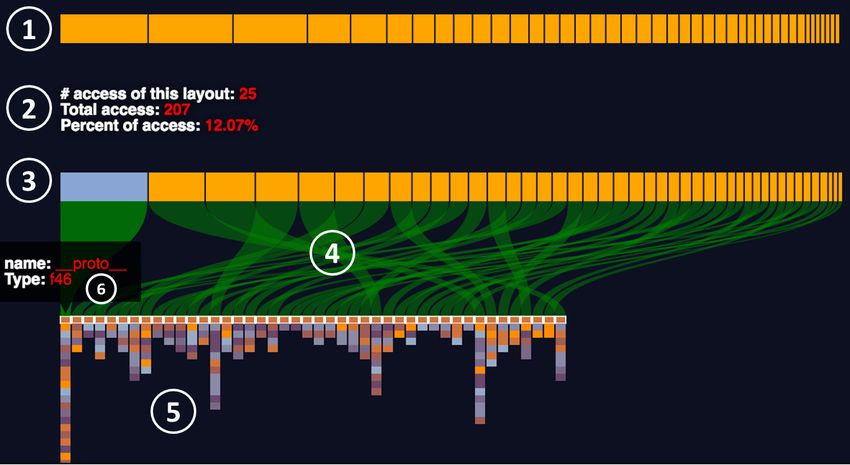
Final Project Report for INFO-247 Information Visualization and Presentation, Spring 2016

                 Figure 2: The First Version of Our Front-end JavaScript Dynamic Analysis Framework.

    parameters of the callback function include the variable name and value. Similarly, callback function W and B
    are for variable write and binary operations respectively. Inside each of those functions, we will implement the
    semantics of the original JavaScript code and call an additional function stub:
1   function W ( value , name ) {
2       if ( stub . write exists )
3             value = stub . write ( value , name )
4       return value ;
5   }

        When executing the instrumented code, it not only performs the original semantics but also calls those
    stub function as dynamic programming analysis interfaces. But This is just a very simple case for the ease of
    understanding. JavaScript is a very flexible programming language with many dynamic programming language
    features, this requires our framework to be able to instrument many other programming constructs such as
    object/function/regexp/array literals, condition, loop, method/function call etc.

    2.4    Instrumentation for Front-end JavaScript Code
    One of the major challenges during the implementation of the JavaScript Shadow Execution Framework comes
    from the flexibility of the JavaScript programming language and the various ways we can execute JavaScript
    code in a web page. We also need to make sure that we can completely detect and instrument all of the JavaScript
    code and at the same time not interfere with the events triggered by the user and the browser.
        The first and major challenge come from the front-end JavaScript code importing model. To our knowledge,
    there are six ways a web page can include a JavaScript Code snippet:
        • JavaScript code can be directly added between a pair of  and  tags.
        • JavaScript code can be included from an external file specified by the src attribute of a  tag.
        • A relatively small snippet of JavaScript code can be added to an HTML event handler attribute, such as
           onclick or onmouseover.
        • Javascript code can be added in a URL: E.g., through javascript: protocol.
        • In common practices, AJAX1 is often used to dynamically request a piece of JavaScript (e.g.,
           jQuery.getScript()) from servers.
        • More dynamically, JavaScript code could be generated and added to the web page at runtime
           src elem.innerHTML = "function(){}".
        Moreover, unlike server-side JavaScript environment (e.g., node.js), JavaScript execution and interaction
    in a web browser is more complicated. In a web browser, JavaScript code may be executed in different time.
    For example, some pieces of JavaScript code is executed during web page loading, even before another external
    JavaScript file is fully loaded while some pieces of JavaScript code will not be executed until some specific
    events were triggered.
        Our JavaScript Analysis Framework transforms JavaScript code imported in all of those above cases. To be
    able to handle those challenges, we adopt an interception architecture to build our system (see Figure 2). We
       1 Asynchronous JavaScript and XML, which is a group of interrelated web development techniques used on the client-side to create

    asynchronous web applications.

                                                                    4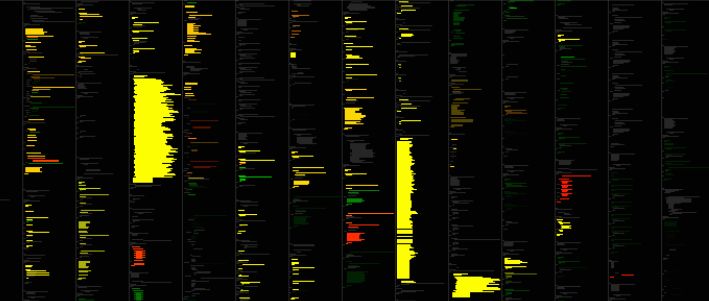
Final Project Report for INFO-247 Information Visualization and Presentation, Spring 2016

                                                                                                   var b = J$.W(9, 'b', J$.T(5, 'test2', 21), b);
                                                          ...                                            var c = J$.W(21, 'c', J$.B(6, '/', J$.R(13, 'b', b, false),
                                                                                          J$.T(17, 3, 22)), c);

    ...                                                   ...                                                                    source.js

    ...                                                 var a = J$.W(9, 'a', J$.T(5, 'test', 21), a);                  J$.analysis = {
                                                J$.P(21, J$.R(13, 'a', a, false), 'field',                         write: function(iid, name, val, lhs) {
      var a = ‘test’;                                   J$.T(17, 'value', 21));                                            ...
      a.field = ‘value’;                                                                                          }
                                                                                                       }

                                                                         page.html
              page.html                                                                                                             analysis module
                                        Intercept and          ...
                                                               function W(iid, name, val, lhs) {
                                          Transform                ...
      var b = ‘test2’;                                             if (sandbox.analysis && sandbox.analysis.write) {
      var c = b / 3;                                                   val = sandbox.analysis.write(iid, name, val, lhs);
                                                                   }
               source.js                                           return val;
                                                               }

                                                                                         lib.js

                                                   Figure 3: A code transformation example.

implement our framework as an observer that monitor any HTTP request sent by the browser and once found any
response that contains JavaScript code the framework will do code transformation, constructs the new response
containing the transformed code and passes it to the browser. Specifically, When our framework intercepts
a response that is an HTML web page, it will first scan through the web page and transform any embedded
JavaScript code in both  tag and HTML event handler, we also insert some external JavaScript code
link to preserve the semantics of the transformed code. After passing the transformed web page to the browser,
Firefox will parse the web page and send out more HTTP request for the external resource specified in the
HTML web page (e.g., JavaScript file, CSS file, images, videos etc.). The framework will selectively intercept
and transform those files containing JavaScript code in this stage.
     Our framework also dynamically monitor any mutation to the web page, so that when a local JavaScript
snippet generates another piece of JavaScript code and inserts them into the web page, our framework will
also observe that and instrument the newly added code before it was executed. So we believe every piece of
JavaScript code executed has been transformed by our analysis framework.
Concrete Example: Figure 3 illustrates how JITProf analyzes the JavaScript code of a simple website by
intercepting and instrumenting the code. The instrumented program calls into the JITProf framework, which
in turn calls any checkers that implement a hook for a particular runtime operation. The figure shows a simple
web page that includes embedded JavaScript code (between  and  tag in page.html file)
and JavaScript code imported from an external resource file source.js. Our framework will detect and transform
every piece of JavaScript code in both page.html and source.js. In the transformed HTML file, var a
= J$.W(9, ’a’, J$.T(5, ’test’, 21), a); corresponds to var a = ’test’; before transformation.
The transformed code contains callback function J$.W for writing variable a and function callback J$.T for
creating a string literal ’test’. The bodies of those callback functions are defined in another external JavaScript
file provided by our framework and its reference will be dynamically inserted between the  tags in the
HTML file. When executing the first statement, callback function J$.W will be executed. J$.W implements
the semantics of writing operation of the variable (in this case returning the variable value) and invoke another
callback function sandbox.analysis.write. The abstract API can be overridden and implemented by third-
party developers who want to perform dynamic analysis.
     This example contains two bugs: 1) a.field = ’value’; is a meaningless setting field operation on
primitive values. 2) var c = b / 3; evaluates to NaN (i.e., Not a Number). But both of these two errors
will neither generate a warning or raise an exception on major JavaScript engines (e.g., Firefox Spider Monkey,
Chrome V8 engine etc.). In this section, we show how to detect the first error by implementing a simple
analysis module based on our framework. The second error will be covered in one of the following sections
and our empirical experiments find the presence of this type of error on the world’s most popular websites and
JavaScript libraries.

                                                                                     5
Final Project Report for INFO-247 Information Visualization and Presentation, Spring 2016
Figure 4: User interface for visualizing JIT-unfriendly code in a web page.
3 Visualization Design
Existing JIT-unfriendly code detection tools simply dump a list of warnings. The warning messages contain the
warning type, source location and some structured information that is specific to the type of problems detected
(e.g., inconsistent hidden classes that cause inline cache miss etc.). Normally, to show the whole problem, a
single warning can contain dozens or even hundreds of lines of text in the console. This makes debugging based
on the warning message tedious and less productive. Visualizing warning generated by JITProf can hopefully
make the debugging process more delightful and productive.
Design Strategy Since there is an overwhelming amount of warnings and each warning contains different
levels of information for the reason, the visualization first shows the overview of all JIT-unfriendly code patterns
based on their frequency using a stacked bar chart. If the developers are interested in one of the patterns (maybe
the most frequently occurred one), she can click on the corresponding bar in the overview. The clicked part will
be expanded and transformed into more sophisticated subdiagram to expose more details about that specific
warning. Since it is a warning visualization tool, developers may also want to view the warning with the source
code that triggers the problem. Therefore, in the proposed visualization strategy, we will also associate parts
of the diagram with source code, so that the developer can click on the components and view the problematic
source code corresponding to the visual component.
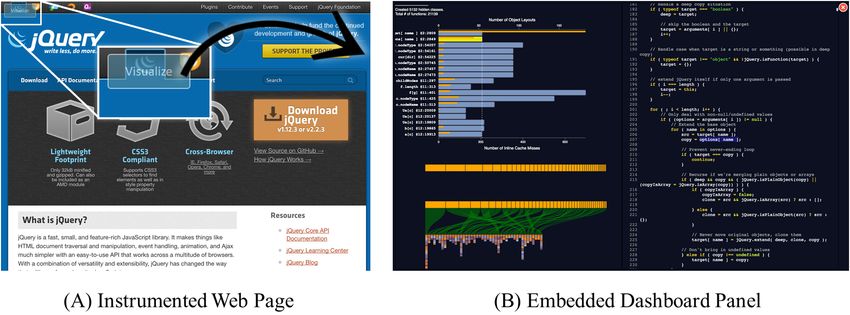
Visualization Overview: Figure 4 shows the overview of our system’s user interface for visualizing runtime
statistics and JIT-unfriendly code inside an analyzed web page. After instrumentation, the web page (e.g., the
homepage of jQuery2 ) contains an additional semi-transparent button (as shown in Figure 4 (A)) and a hidden
inner HTML frame (as shown in Figure 4 (B)), which contains the user interface and logic for visualizing the
web page’s JavaScript runtime statistics. After the “Visualize” button has been clicked, the instrumented web
page shows the embedded dashboard (Figure 4 (B)). Both the button and the embedded dashboard are inserted
by our framework when doing the instrumentation on-the-fly. All original JavaScript code inside the target web
page is instrumented. When loading the web page, the instrumented JavaScript code does its original operations
(e.g., changing the HTML structure, and showing visual effects on the web page etc.) and additionally collects
its own runtime behavior. The runtime statistics are gathered at real-time and form the basis for our engine’s
JIT-unfriendly code analysis and visualization.
Dashboard Overview: Figure 5 shows the user interface for visualizing JIT-unfriendly code detected on
the web page. Region (1) in the figure shows the overview of all JIT-unfriendly code related to inconsistent
object shapes. Region (2), (3), and (4) shows a more detailed and structured information of a JIT-unfriendly
2 http://www.jquery.com
6Final Project Report for INFO-247 Information Visualization and Presentation, Spring 2016
Figure 5: Dashboard visualizes the overall statistics of JIT-unfriendly code, detailed JIT-unfriendly code
structure, and associated source code.
code location after a user clicks on a specific JIT-unfriendly code in region (1). Region (5) highlights the JIT-
unfriendly code in its surrounding context. Additionally, when a user clicks on a specific JIT-unfriendly code
location in Region (1), a curved line will be temporarily displayed to link the JIT-unfriendly code statistics in
Region (1) and the concrete source code in Region (6). A user can also click on the “X” button on the right
top corner to close the dashboard in order to interact with the instrumented web page. Due to the demand for
showing both the overview and the unique structure of each JIT-unfriendly code patterns, to our best knowledge,
there are no existing d3 charts that can be reused for visualizing the data obtained here. All charts except (5)
are built with the d3.js3 library from scratch without using existing charts. In the following paragraphs, we will
describe each visualization component in detail.
JIT-unfriendly Code Overview: Figure 6 contains more detailed screenshots of Region (1) in Figure 5.
Figure 6 (A) and Figure 6 (B) demonstrates the visual effects when user hovers the mouse over different
components in the bar chart. We designed the visualization of all JIT-unfriendly code as a horizontal bar chart.
Each row represents one specific JIT-unfriendly code location. For example, the first row with title target[
name ] @2:2809 represents the statistics of a JIT-unfriendly code detected at a location with id 2:2809. The
JIT-unfriendly code is an object’s getting field operation target[ name ]. The large rectangle (or the blue
bar) shows the frequency of this JIT-unfriendly code being executed. The thin rectangle (or the orange bar)
shows the total number of inconsistent layouts detected at runtime for object target. When a user hovers the
mouse over the thin bar, the number will be projected to the corresponding axis (as shown in Figure 6 (A)).
When a user hovers the mouse over the large bar, the frequency of JIT-unfriendly code (or the number of inline
cache misses) will be projected to the axis at the bottom (as shown in Figure 6 (B)). When the user is interested
in more details about a specific JIT-unfriendly code location, she can click on the large bar. Then region (5)
in Figure 6 highlights the corresponding source code; region (6) in Figure 6 links the clicked bar with the
highlighted source code with a curved line; region (2), (3), and (4) in in Figure 6 displays structural information
(explained in the following part of this section) for the JIT-unfriendly code pattern.
3 https://d3js.org/
7Final Project Report for INFO-247 Information Visualization and Presentation, Spring 2016
Figure 6: The bar chart in the dashboard gives an overview of the severity of the JIT-unfriendly code and how
easy it is to fix them.
JIT-unfriendly Code Detailed Visualization: Figure 7 shows the visualization for displaying information of
a specific JIT-unfriendly code location after a user clicks on a frequency bar in the overview visualization (in
Figure 5 Region (1)). In Figure 7, region (1) shows a frequency bar consisting of a various number of rectangles.
Each rectangle represents a single object creation location (e.g., the constructor function or the object literal).
The horizontal length of the rectangle quantifies the frequency of this creation location comparing to the other
locations. The user can click on the rectangle, which will be linked to a source location with a curved line.
Region (3) is a frequency bar for showing the access of each inconsistent object layout that passes through the
JIT-unfriendly code location. Region (2) of Figure 7 will display the frequency information and its percentage
when a rectangle in either region (1) or region (3) is clicked. Region (5) shows an abstract overview of all object
layouts that pass through the JIT-unfriendly code location. In the region, each column represents a unique object
layout, in which each rectangle represents a property inside that object layout. When a user hovers the mouse
over the property rectangle, a tooltip (region (6)) will pop up to show the property’s name and type. The graph
will also highlight equivalent property (i.g., property with the same name and type) in the other object layouts
so that the user can easily check if those properties are aligned. Region (4) associates the frequency bar in
region (3) with a corresponding object layout in region (5). Any subcomponent in region (3), (4), and (5) will
be highlighted if their corresponding component in the other regions is triggered by the user.
Dynamic Color Scheme: To give a quick overview of the similarity of all object layouts that pass through a
JIT-unfriendly code location without requiring the user to hover over each rectangle. We designed a dynamic
color scheme to display the object layout so that properties with similar name and type have the similar color.
We first define a number of colors corresponding to each type in JavaScript (e.g., number, boolean, string,
function, object and undefined). We slightly change the color by first mapping it into the HEX numerical
space and then adding a value calculated from the ASCII code of all characters of the property’s name. With
this dynamic color scheme, the users can quickly have an overview of all the object layouts and how similar
they are. If the users are interested in more details or curious on what causes the slight difference between two
object layouts, they can further hover the mouse over those rectangles.
Steps Required to Accomplish the Goals: To use the visualization system, the user first needs to download
and install our visualization system4 . After installing and starting our system, all web requests and responses
will be monitored by the system. The user needs to open a browser (Chrome is recommended) to visit a website
(e.g., www.jquery.com). After the web page is fully loaded, there will be an additional button shown on the
screen (as shown in Figure 4 (A)). The user then clicks the button and starts interacting with the dashboard (as
shown in Figure 4 (B)). In the dashboard, the user first selects a JIT-unfriendly code location, ideally one with
4 https://github.com/JacksonGL/jitprof-visualization.git
8Final Project Report for INFO-247 Information Visualization and Presentation, Spring 2016
Figure 7: Chart in the dashboard gives structural visualization of a JIT-unfriendly code location.
higher frequency and fewer inconsistent layouts, and clicks on the frequency bar (as shown in Figure 5 (1)).
Then she will see detailed JIT-unfriendly code information shown in regions as in Figure 5 (2), (3), (4), (5), and
(6). The user can also hover the mouse over components in regions shown as in Figure 5 (2), (3), (4) to explore
more detailed information about the JIT-unfriendly code.
4 Evaluation
The potential users of this visualization system are expected to be experienced JavaScript developers who care
about the performance of their JavaScript programs. They may want to find new opportunities to improve the
performance of their applications so that they can provide a smooth user experience in the front-end or higher
throughput and lower latency in the backend (using Node.js5 ). We evaluate our visualization in two steps. The
first step is showing the potential users our initial design prototype and asking for feedback. The second step is
a usability test in which we let those users complete a set of predefined tasks with or without our visualization
tool. For our user study, our potential users are three students from EECS department who uses JavaScript daily.
Initial Design Feedback: After getting feedback for the initial design, we revised our design as follows:
• Our initial design does not include the dynamic color scheme and only shows the object layout purely
based on the type of objects. One user suggests that may not be good enough to differentiate the properties
with the same type but different names.
• Our initial design does not highlight the equivalent properties in the other object layout when the user
hovers the mouse over a property in an object layout. Two users suggest that may be inconvenient to
hover over each property inside the other object layouts to see if those properties are the same.
Usability Test We conduct the user study by first identify 6 JIT-unfriendly code locations on real-world
websites. Then we divide those 6 JIT-unfriendly code locations into two groups (Group A and Group B).
Each group contains three JIT-unfriendly code locations. We let each user find JIT-unfriendly code location in
one group without the visualization system, and then let the same user find JIT-unfriendly code location with
our visualization system. All users were able to find the JIT-unfriendly code location and its refactoring method
faster using our visualization system than completing the tasks without our system.
5 https://nodejs.org/
9Final Project Report for INFO-247 Information Visualization and Presentation, Spring 2016
5 Related Works
This proposal is about warning visualization for dynamic analysis of web applications. Therefore, our
envisioned tool falls naturally into the category of software visualization. There have been some existing
survey works in software visualization [8, 21]. Zhang et. al. maps different phases of software engineering
process (e.g., requirement, design coding, testing etc.) into different software visualization techniques. More
specifically, design and documentation modeling techniques include UML diagrams [12], program visualization
techniques include the control-flow graph, call graph [11], and dependency graph [5]. There are other related
works in the software visualization including algorithm animation [17], visual programming [6] etc. Different
from those research works, our proposed tool aim at reducing the time the developers need to read the warnings
messages through warning visualization.
Figure 8: Visualization in Seesoft.
There are other state-of-the-art visualization techniques that are related to our proposed system. Erick et. al.
proposed Seesoft [10], which is a software visualization system to show a metric number’s overview and link to
its corresponding source code details when users click on a specific number. This system contains three levels
of information granularities. The first of which level shows a general overview of the metric; the second level
shows the overview of corresponding source code location in different files; the last level shows the source code.
Different from this system, our proposed visualization needs to give an overview of a combination of several
different metric numbers from which JavaScript developers can decide where to explore for more details. As
shown in Figure 8, a Seesoft display of a directory with 20 files and 9 365 lines of code. Each file is represented
as a column and each line of code as a colored row. The files are either C code (L), header (.h), or configuration
management (md) files. The color of each line is determined by the modification request (MR) that created the
line. All MR’s touching any of these files are shown on the left using a color scale with the oldest in blue and
the newest in red.
10Final Project Report for INFO-247 Information Visualization and Presentation, Spring 2016
Figure 9: Tarantula visualizes fault localization information by setting the statements’ background color
according to their likelihood of containing contain a bug.
Several other works that are related to our system include Tarantula [16] (see Figure 9) and Zoltar [15].
Tarantula is a source code level visualization for spectrum based software fault localization, where a program
is executed and analyzed dynamically to calculate suspiciousness of each statements’ likelihood to contain
bugs. If a source location is more likely to contain bugs, the source location will be marked with brighter
color. After marking the colors, the source code overview looks like a spectrum since each line has a different
color. Different from this approach, we do not calculate a score for each statement. Instead, a relatively smaller
number of locations will be reported, but each location will have a complex explaining information associated.
6 Project Logistics
Data: The warning information and runtime data will be generated dynamically after instrumenting and
analyzing JavaScript code at runtime. Jalangi [19] is a framework for dynamically analyzing front-end
JavaScript code which can be used to obtain the runtime information. The framework works through source
code instrumentation and allows implementation of various heavy-weight dynamic analyzes techniques. To
analyze front-end web applications, the Jalangi framework provides selective record-and-replay. The engine
allows recording an execution of a JavaScript application in the browser and then replay the execution for the
purpose of debugging on a node.js [4] or a JavaScript engine embedded in an IDE.
Tool or Framework Used: To visualize the warning and show comprehensive information that is associated
with the source code. We plan to use d3.js [18], Bootstrap [1], and other JavaScript front-end frameworks. To
do instrumentation and obtain the runtime data for warning comprehension, we also need to use Jalangi [19] to
obtain the data.
Author and Source Code: This visualization system is a solo project designed and implemented by Liang Gong
alone. The system is open-sourced under the BSD licence. More information, demonstrations, or documents
can be found ag the following link:
https://github.com/JacksonGL/jitprof-visualization
11Final Project Report for INFO-247 Information Visualization and Presentation, Spring 2016
References
[1] Bootstrap (last visited: April 2016). http://getbootstrap.com/.
[2] JIT-Coach (last visited: March 2016).
https://wiki.mozilla.org/DevTools/Performance/JIT.
[3] JITProf Warning Example (last visited: March 2016). http:
//www.eecs.berkeley.edu/~gongliang13/jalangi_ff/demo_integrated.htm?jit.
[4] Node.js (last visited: Sep 2015). https://nodejs.org/en/.
[5] R. Allen and K. Kennedy. Optimizing Compilers for Modern Architectures: A Dependence-based
Approach. Morgan Kaufmann, 2001.
[6] S. Böhm, M. Behalek, O. Meca, and M. Surkovský. Visual programming of MPI applications: Debugging
and performance analysis. In M. Ganzha, L. A. Maciaszek, and M. Paprzycki, editors, Proceedings of the
2013 Federated Conference on Computer Science and Information Systems, Kraków, Poland, September
8-11, 2013., pages 1483–1490, 2013.
[7] S. Diehl, editor. Software Visualization, International Seminar Dagstuhl Castle, Germany, May 20-25,
2001, Revised Lectures, volume 2269 of Lecture Notes in Computer Science. Springer, 2002.
[8] S. Diehl. Software Visualization - Visualizing the Structure, Behaviour, and Evolution of Software.
Springer, 2007.
[9] S. ECMA-262”. http://www.ecma-international.org/publications/standards/Ecma-262.htm.
[10] S. G. Eick, J. L. Steffen, and E. E. S. Jr. Seesoft-a tool for visualizing line oriented software statistics.
IEEE Trans. Software Eng., 18(11):957–968, 1992.
[11] A. A. Evstiougov-Babaev. Call graph and control flow graph visualization for developers of embedded
applications. In Diehl [7], pages 337–346.
[12] M. Fowler and K. Scott. UML distilled - a brief guide to the Standard Object Modeling Language (2. ed.).
notThenot Addison-Wesley object technology series. Addison-Wesley-Longman, 2000.
[13] L. Gong, M. Pradel, and K. Sen. JITProf: Pinpointing JIT-unfriendly JavaScript code. Technical Report
UCB/EECS-2014-144, EECS Department, University of California, Berkeley, Aug 2014.
[14] L. Gong, M. Pradel, and K. Sen. Jitprof: Pinpointing jit-unfriendly javascript code. In Proceedings of the
2015 10th Joint Meeting on Foundations of Software Engineering, ESEC/FSE 2015, pages 357–368, New
York, NY, USA, 2015. ACM.
[15] T. Janssen, R. Abreu, and A. J. C. van Gemund. Zoltar: A toolset for automatic fault localization. In ASE
2009, 24th IEEE/ACM International Conference on Automated Software Engineering, Auckland, New
Zealand, November 16-20, 2009, pages 662–664. IEEE Computer Society, 2009.
[16] J. A. Jones. Fault localization using visualization of test information. In A. Finkelstein, J. Estublier, and
D. S. Rosenblum, editors, 26th International Conference on Software Engineering (ICSE 2004), 23-28
May 2004, Edinburgh, United Kingdom, pages 54–56. IEEE Computer Society, 2004.
[17] A. Kerren and J. T. Stasko. Algorithm animation - introduction. In Diehl [7], pages 1–15.
[18] S. Murray. Interactive Data Visualization for the Web. O’Reilly Media, Inc., 2013.
[19] K. Sen, S. Kalasapur, T. Brutch, and S. Gibbs. Jalangi: A selective record-replay and dynamic
analysis framework for JavaScript. In European Software Engineering Conference and Symposium on
the Foundations of Software Engineering (ESEC/FSE), 2013.
[20] V. St-Amour and S. Guo. Optimization coaching for javascript (artifact). volume 1, pages 05:1–05:2,
2015.
[21] K. Zhang. Software Visualization: From Theory to Practice, volume 734. Springer Science & Business
Media, 2012.
12You can also read