Rotorua District Council Spray Irrigation Compliance Report
←
→
Page content transcription
If your browser does not render page correctly, please read the page content below
Rotorua District Council
Spray Irrigation Compliance Report
Prepared by Stephen Park and John Holst

Environment Bay of Plenty
Environmental Publication 2009/13
November 2009

5 Quay Street
P O Box 364
Whakatane
NEW ZEALAND
                                                        ISSN: 1175 9372

Working with our communities for a better environment
E mahi ngatahi e pai ake ai te taiao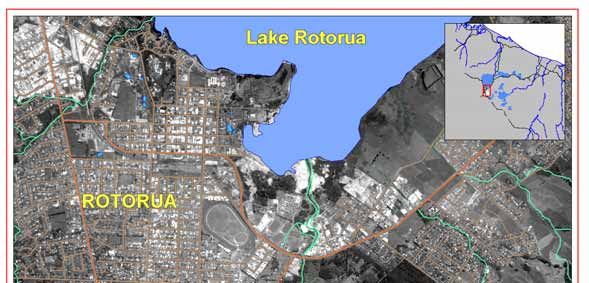
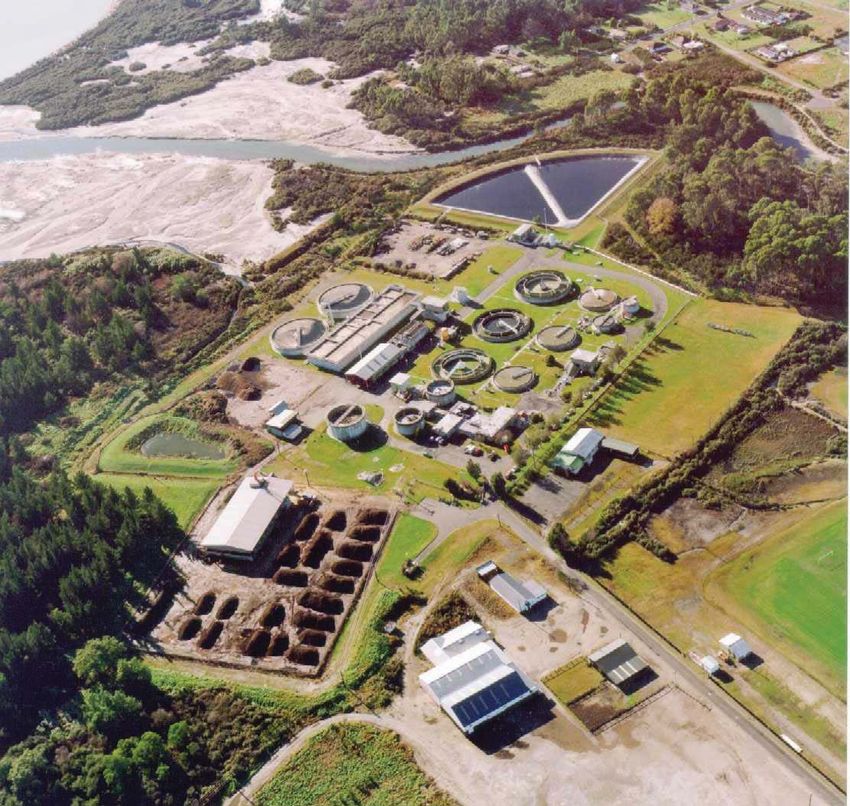
Rotorua District Council
Spray Irrigation
Compliance Report

Environmental Publication 2009/13
ISSN: 1175 9372

November 2009

Environment Bay of Plenty
5 Quay Street
PO Box 364
Whakatane 3158
NEW ZEALAND

Prepared by Stephen Park and John Holst

Cover Photo:
Storage Ponds in Waipa Forest

Acknowledgements
Alison Lowe of Rotorua District Council for providing additional information on the operation
of wastewater treatment plant and spray irrigation scheme.

Cover Photo: Storage Ponds in Waipa Forest.
Executive Summary
This report presents an assessment of Rotorua District Council’s compliance with conditions
of Consent 60739 for spray irrigation of treated sewage effluent in Whakarewarewa Forest. It
covers the period from May 2006 up to August 2009.

The main aim of the consent is to reduce nutrient loading to Lake Rotorua. Consent
conditions restrict additional nutrient loading into Waipa Stream and hence Lake Rotorua to
3 tonnes of total phosphorus and 30 tonnes of total nitrogen per year. The previous
compliance report (July 2003 to May 2006) had shown non-compliance with nitrogen (N)
levels in the Waipa Stream for all but the first few months of that period although it was an
improvement from the peak levels seen in 2001. Over the latest compliance assessment
period up to August 2009, nitrogen loads have exceeded the limit with the exception of May
and June 2007. Over this period the average load of nitrogen in Waipa Stream in excess of
the consent limit was 3.8 tonne (as a 12 month rolling sum value). From mid 2006 to 2007
nitrogen loads in Waipa Stream had been decreasing before the trend was reversed. In the
same period phosphorus loads have increased but remain well within the compliance limit of
3 tonnes per annum.

Non-compliance with total nitrogen levels in the Waipa Stream reflects a combination of the
loads being applied to the spray irrigation area and stream flow. A decrease in the nitrogen
load from the treatment plant had been achieved right through 2006 resulting in compliance
being achieved by May 2007. The increase in nitrogen load from the treatment plant since
the beginning of 2007 in addition to higher rainfall and stream flow has caused the non-
compliance of nitrogen load in Waipa Stream. Current nitrogen loading to the spray irrigation
area is around 20% higher than was achieved through the treatment plant in 2006 and 12%
higher than 2002. If the treatment plant performance for nitrogen achieved in these periods
could be maintained then it is expected that compliance with the consent limit would also be
achieved. Rotorua District Council continues to optimise and improve treatment processes
and investigate to determine relationships between recent plant upgrades or changes in the
irrigation schedule and loads in Waipa Stream.
Contents

Acknowledgements                                                                i

Executive Summary                                                              iii

Part 1: Introduction                                                           1
1.1    Background                                                               1

1.2    Summary of treatment and disposal details                                1

Part 2: Methodology                                                            5

Part 3: Compliance                                                              7
3.1    Discharge permit number 60739                                            7

3.2    Monitoring                                                               7

3.2.1 Condition 11 – nutrient limits for surface water quality                  8

3.2.2 Condition 3 – quantity and rate                                           9

3.2.3 Condition 6 – effluent disposal system                                    9

3.2.4 Condition 7 – buffer zones                                                9

3.2.5 Condition 8 – monitoring stations                                       10

3.2.6 Condition 9 – effluent monitoring                                       10

3.2.7 Condition 10 – Waipa Stream monitoring                                  10

3.2.8 Condition 12 – excess flows                                             11

3.2.9 Condition 13 – monitoring structures                                    11

3.2.10 Condition 14 – reports                                                 11

3.2.11 Condition 15 – warning signs                                           11

Part 4: Discussion and Conclusions                                            13

References                                                                    17
Appendix 1 – Consent conditions                                               21

Environmental Report 20/20                       Example Env_Ops Report Procedure
Appendix 2 – Effluent monitoring results 27
Appendix 3 – Waipa Stream monitoring results 33
List of Figures
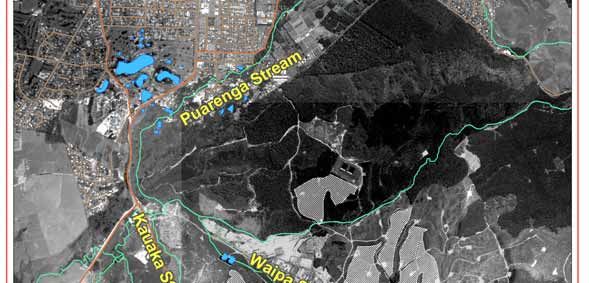
Figure 1 Approximate location of Rotorua District Council’s spray irrigation blocks
in Whakarewarewa Forest for the application of treated effluent. 6
Figure 2 Additional increase in mass load (12 month rolling sum) of total
phosphorus and total nitrogen in Waipa Stream with the 1989/90 base
load removed. 8
Figure 3 Daily flow rate of Rotorua District Council’s treated effluent (consent
limit is 44,000m3/day). 10
Figure 4 Reduction in mass load of nutrient applied to the spray irrigation area in
Whakarewarewa Forest as measured in Waipa Stream using
comparison of 12 month rolling sums. 14
Figure 5 Concentration and daily mass load (monthly mean) of NOx and NH4
recorded in the effluent (Lowess trend line). 27
Figure 6 Concentration and daily mass load (monthly mean) of TKN and TN
recorded in the effluent (Lowess trend line). 28
Figure 7 Concentration and daily mass load (monthly mean) of DRP and TP
recorded in the effluent (Lowess trend line). 29
Figure 8 Concentration and daily mass load (monthly mean) of Chloride
recorded in the effluent (Lowess trend line). 30
Figure 9 Number of FC/E.coli bacteria in the effluent and daily volume of effluent
(monthly mean and lowess trend line). 31
Figure 10 Concentration of DRP and TP at upstream and downstream sites in
Waipa Stream, Rotorua (Lowess trend line). 33
Figure 11 Concentration of NOx and NH4 at upstream and downstream sites in
Waipa Stream, Rotorua (Lowess trend line). 34
Figure 12 Concentration of TN and TKN at upstream and downstream sites in
Waipa Stream, Rotorua (Lowess trend line). 35
Figure 13 Concentration of chloride (Lowess trend line) and faecal coliforms/E.coli
measured at upstream and downstream sites in Waipa Stream,
Rotorua. 36
Figure 14 Average mass load of TP and TN measured at the downstream site in
Waipa Stream, Rotorua (Lowess trend line). 37
Figure 15 Monthly mass load of TP and TN measured in the effluent discharged in
the spray irrigation area and at the downstream site in Waipa Stream. 38
vi Rotorua District Council Spray Irrigation Compliance Report – Environmental Publication 2009/13Figure 16 Twelve month rolling sum of TP and TN mass load measured in the
effluent discharged in the spray irrigation area and at the downstream
site in Waipa Stream. 39
Environmental Publication 2009/13 – Rotorua District Council Spray Irrigation Compliance Report viiPart 1: Introduction
1.1 Background
The Rotorua District Council holds consent number 60739 authorising the discharge
of treated city effluent to the Whakarewarewa Forest. This consent was granted by
the Bay of Plenty Regional Council on 26 October 2001. Spray irrigation of treated
effluent to Whakarewarewa Forest commenced in 1991 under the conditions of the
previous consent.
The objectives of this consent and the treatment and disposal systems are to reduce
the nutrient load on Lake Rotorua. Water quality in the lake had been declining
since the 1960s because of excessive phytoplankton growths caused by increased
inputs of phosphorus and nitrogen. Major contributions of the nutrient increases
were from the Rotorua city sewage treatment plant. Nitrogen from the plant
accounted for 21% of the total input in 1988 and 6.9% in 1999 (Burns 1999). As
nitrogen loads have increased or been more accurately assessed within the
catchment, the contribution is now estimated to be 4.4%.
The conditions of consent 60793 restricting the mass loading of nutrients, aims to
contribute towards restoring lake condition to that which prevailed prior to the 1960s,
before widespread public concern about phytoplankton growths developed. It is a
scientific view that this lake condition is achievable and will reduce the frequency
and magnitude of nuisance algal blooms, maintain reasonable water appearance
and clarity for recreational purposes, minimise periods of de-oxygenation, and
reduce the internal nutrient inputs (Rutherford et al. 1989). Due to internal nutrient
storage in the lake sediments and lags in peak loads from groundwater etc, water
quality improvements would only be expected to occur over a long period of time.
Previous compliance monitoring of this consent has been reported in May 1994,
April 1996, February 1999, April 2001, August 2003 and October 2006. This report
updates compliance assessment for the period from May 2006 to August 2009.
1.2 Summary of treatment and disposal details
Consent number 60739 authorises the discharge of a peak daily flow of 44,000 m3
of treated sewage to the Whakarewarewa Forest, by spray irrigation. Effluent may
only be applied for a maximum continuous period of 24 hours and may not exceed
5mm/hour.
Sewage from the City of Rotorua is reticulated to the Rotorua Waste Water
Treatment Plant. The treatment plant consists of the following processes:
• initial screening and grit removal;
• primary sedimentation;
• activated sludge process and nutrient removal;
• final clarification;
Environmental Publication 2009/13 – Rotorua District Council Spray Irrigation Compliance Report 1• effluent holding ponds;
• Methanol dosing;
• sludge and scum processing facilities.
After initial screening and grit removal effluent is distributed into the primary
sedimentation tanks.
Primary sedimentation is a fairly conventional process utilised in many municipal
waste water treatment plants, to remove settleable solids. Flow from sedimentation
then passes to the activated sludge process. The activated sludge process is
traditionally used to reduce organic contamination by stimulating bacterial
degradation. However, in the Rotorua District Council Waste Water Treatment Plant
the activated sludge process has been specifically designed to also achieve nutrient
removal from the effluent flow. The specific design used in this situation is termed
the Bardenpho process, where alternating anaerobic and aerobic conditions are
used to enhance bacterial action to remove nitrogen and phosphorus.
As with conventional activated sludge processes, the effluent flow from the
Bardenpho process is passed through a clarifier, where biological solids are
removed.
Some solids removed in primary sedimentation and final clarification are returned at
various stages to the effluent flow to enhance treatment processes. Solids are
removed and disposed of to remove organic and nutrient load. The sludge contains
on average 12g/kg phosphorus and 15g/kg nitrogen.
The original design population of the wastewater treatment plant (Stage IV) was
45,000. In May 2005 “Stage V” was implemented upgrading the treatment plant to a
design population of 70,000. The upgrade included:
• new return activated sludge (RAS) pumps with increased capacity to help in
denitrification
• methanol dosing to increase amount of nitrogen removed
• extension of Bardenpho secondary treatment and upgrade of aeration system
- replacement of ceramic diffusers
Final effluent from the treatment process is pumped to holding ponds in the
Whakarewarewa Forest prior to discharge by spray irrigation to forestland. The
irrigation area is divided into 16 spray blocks of which 14 are operated on a daily
rotational basis, leaving two blocks to cater for forestry harvesting and planting
operations. The possible irrigable area for 14 blocks is 265 ha but Rotorua District
Council are currently irrigating 80% of each block, giving a nett irrigation area of
220 ha. The total spray block area including the two unused spray blocks, wetlands,
buffer zones and roads is 433 ha. The current irrigation application rates and
rotation are an improvement over those previously used.
2 Rotorua District Council Spray Irrigation Compliance Report – Environmental Publication 2009/13The irrigation of effluent to land utilises two main processes of nutrient removal:
• Phosphorus is removed as the treated effluent passes through the soil profile.
Phosphorus is adsorbed onto allophane clay present in the volcanic soils.
Phosphorus removed in this way is strongly held and not readily available for
leaching.
• Nitrogen is removed by denitrification in the riparian zones and wetlands, and
by relatively minor uptake by site vegetation.
The irrigation system relies on the passage of effluent through both the soils and
wetlands.
The spray disposal of effluent commenced in 1991. The disposal area is in the
Whakarewarewa Forest. This is a commercial forest production area. A plan of the
disposal area is presented as Figure 1. The scheme is located in the catchments of
the Waipa and Kauaka Streams.
Environmental Publication 2009/13 – Rotorua District Council Spray Irrigation Compliance Report 3Part 2: Methodology
Staff have assessed compliance with the consent conditions in the following ways:
• Site inspections have been carried out to assess compliance with conditions relating to
operational matters including response to public complaints;
• Returns of data and results of self-monitoring have been reviewed and compared to
consent conditions to determine compliance.
• Comparison of Waipa Stream nutrient increases with pre-spray irrigation 1989/90
baseline data.
The location of spray irrigation blocks in Whakarewarewa Forest (approximate), Waipa
Stream and Lake Rotorua is shown in Figure 1.
Environmental Publication 2009/13 – Rotorua District Council Spray Irrigation Compliance Report 5Figure 1 Approximate location of Rotorua District Council’s spray irrigation blocks
in Whakarewarewa Forest for the application of treated effluent.
6 Rotorua District Council Spray Irrigation Compliance Report – Environmental Publication 2009/13Part 3: Compliance
3.1 Discharge permit number 60739
Resource consent number 60739 is a discharge permit authorising the discharge of
treated sewage effluent from the Rotorua waste water treatment plant on to land
within Whakarewarewa Forest. A copy of the consent is attached as Appendix 1.
3.2 Monitoring
Conditions requiring monitoring as part of ongoing compliance checks are:
• Condition 3 – Quantity and rate of discharge
• Condition 6 – Operation in accordance with Land Treatment Management
Plan
• Condition 7 – Buffer zones
• Condition 8 – Monitoring stations
• Condition 9 – Effluent quality monitoring
• Condition 10 – Waipa Stream quality monitoring
• Condition 11 – Nutrient limits for surface water quality
• Condition 12 – Excess flows
• Condition 14 – Provision of reports
• Condition 15 – Warning signs
Compliance with each of the above conditions of consent 60739 is addressed in the
following section of this report.
Environmental Publication 2009/13 – Rotorua District Council Spray Irrigation Compliance Report 73.2.1 Condition 11 – nutrient limits for surface water quality
This condition requires the consent holder to operate the treatment scheme to
ensure that sewage-derived nutrient that ends up in the Waipa Stream and hence
Lake Rotorua is limited to 3 tonnes of total phosphorus and 30 tonnes of total
nitrogen per annum for any 12 month period. Figure 2 below shows the increase in
stream loading that is likely to have occurred as a result of the spray irrigation of
treated effluent.
(a)
4
Phosphorus tonne/yr
3
2
1
0
91 92 93 94 95 96 97 98 99 00 01 02 03 04 05 06 07 08 09
19 19 19 19 19 19 19 19 19 20 20 20 20 20 20 20 20 20 20
(b)
60
Nitrogen tonne/yr
40
20
0
91 92 93 94 95 96 97 98 99 00 01 02 03 04 05 06 07 08 09
19 19 19 19 19 19 19 19 19 20 20 20 20 20 20 20 20 20 20
Figure 2 Additional increase in mass load (12 month rolling sum) of total
phosphorus and total nitrogen in Waipa Stream with the 1989/90 base
load removed.
8 Rotorua District Council Spray Irrigation Compliance Report – Environmental Publication 2009/13Mass TP loadings to Waipa Stream have increased since spraying began and
peaked in early to mid 2001 before rapidly dropping to low levels around June 2003.
Since then loads have once again increased and peaked at just over 2 tonne by
June 2008 before declining to around 1.5 tonne by August 2009. During the
reporting period (June 2006–August 2009) total phosphorus loads have increased
but compliance with the 3 tonnes per annum limit for phosphorus has been
achieved.
A similar trend has been observed for additional mass loading of nitrogen which
increased dramatically from 1993 and peaked in 2001 at 55 tonnes. This loading
was well above the limit of 30 tonnes per annum for any 12 month period. Since
then total nitrogen loads have shown an overall downward but fluctuating trend with
two brief periods of compliance in Apr 03 – Nov 03 and May/Jun 07. For the current
period being assessed for compliance (June 2006 – August 2009) the limit for total
nitrogen loading has only been met for two months in May/Jun 2007.
The baseline nutrient load for Waipa Stream upon which this assessment is made
was recorded by Environment Bay of Plenty in 1989/90 as 1,427 kg-TP and 5,188
kg-TN. A separate study by RDC (March 1991-March 1992) determined the annual
load as 1,976 and 8,216 kg-TP and TN respectively, but overlaps with the
commencement of spray irrigation. The Waipa Stream “upstream” data is not used
as per the advisory note in the consent to calculate the additional nutrient load as
the flow is markedly different and not recorded.
3.2.2 Condition 3 – quantity and rate
Condition 3.1 states that:
“The peak daily quantity of treated effluent discharged shall not exceed 44,000 cubic
metres”.
Figure 3 shows the daily flow from 1995 onwards. Daily flows have been well within
the limits set by condition 3.1.
Condition 3.2 limits the rate of application in any sub area of the forest spray
irrigation zone. Application rates of effluent onto the spray irrigation blocks are
controlled to achieve compliance with condition 3.2.
3.2.3 Condition 6 – effluent disposal system
Condition 6.1 requires a management plan for operation and maintenance of the
spray irrigation system. A Plan was submitted and met with our approval..
Condition 6.2 specifies that effluent shall not be applied to any area where ponded
surface water is present and when water is flowing off the surface of that area, such
that it could directly enter any drain or natural watercourse by overland flow.
Condition 6.3 specifies that operation of the disposal system will not cause erosion.
3.2.4 Condition 7 – buffer zones
This condition requires the maintenance of buffer zones around the spray irrigation
zones. Environment Bay of Plenty staff have approved a management plan for these
buffer zones. These buffer zones have been inspected and have been maintained
according to the required standards. Rotorua District Council currently have 30m
buffer zones whereas the consent only requires 15m. They are considering making
use of the additional 15m to increase their available irrigation area as pipelines are
reinstated following harvesting.
Environmental Publication 2009/13 – Rotorua District Council Spray Irrigation Compliance Report 944000
33000
3
Daily volume m
22000
11000
0
95 96 97 98 99 00 01 02 03 04 05 06 07 08 09
19 19 19 19 19 20 20 20 20 20 20 20 20 20 20
Figure 3 Daily flow rate of Rotorua District Council’s treated effluent (consent limit
is 44,000m3/day).
3.2.5 Condition 8 – monitoring stations
Condition 8 requires the maintenance of set sampling points to access both the
treated effluent prior to discharge and up/downstream sites on the Waipa Stream.
These have been maintained.
3.2.6 Condition 9 – effluent monitoring
This condition sets out the constituents of the treated effluent that are to be
analysed, how they should sampled and how the results should be calculated.
Compliance with this requirement has been good. Results of this monitoring data
help provide an overall understanding of what is happening with this
treatment/irrigation scheme and are provided in Appendix 2.
3.2.7 Condition 10 – Waipa Stream monitoring
This condition stipulates the sampling points, frequency and constituents to be
monitored in Waipa Stream. Compliance with this condition has been good overall.
The monitoring results from Waipa Stream for a number of the constituents
measured are presented in Appendix 3.
10 Rotorua District Council Spray Irrigation Compliance Report – Environmental Publication 2009/133.2.8 Condition 12 – excess flows
Condition 12 requires notification of any excess flow or spillage and details of its
nature and cause. As a result of the February 2006 incident, Environment Bay of
Plenty staff have addressed this requirement with the consent holder, resulting in
improved lines of communication which will be included in the updated Management
Plan.
3.2.9 Condition 13 – monitoring structures
Condition 13 relates to monitoring and maintenance of structures within streams that
are used to supply monitoring information. These structures have been maintained
in compliance with the consent conditions.
3.2.10 Condition 14 – reports
Condition 14 sets out the time frame requirements for reporting of results. Most of
the self-monitoring results are required to be sent to Environment Bay of Plenty
within 21 days of the end of each calendar month. Compliance with this minor
condition is now very good. Rotorua District Council staff are co-operative and
promptly respond to any additional requests regarding the compliance data.
3.2.11 Condition 15 – warning signs
Warning signs are to be maintained around the perimeter of the spray irrigation
areas to warn public of the health risks involved. Inspections have shown that
warning signs have been maintained around the spray irrigation blocks as required
in the consent conditions.
Environmental Publication 2009/13 – Rotorua District Council Spray Irrigation Compliance Report 11Part 4: Discussion and Conclusions
4.1 Compliance results discussed in this report are based upon the period from April
2006 up until August 2009. Consent (60739) conditions restrict any additional
nutrient loading to the Waipa Stream to 30 tonnes nitrogen and 3 tonnes
phosphorus. This matches the maximum levels of sewage derived nutrient loading
to Lake Rotorua that Rutherford et. al. (1989) calculated would pose a low risk to the
objective of improving lake water quality back to an acceptable level. During the
period being assessed total nitrogen loads to the Waipa Stream have consistently
exceeded consent limits for nitrogen and for the later period (during 2009) it has
been around 5 tonnes above the limit. Although this is an overall improvement since
the peak in 2001 but it is well above the consent limit and places lake restoration
objectives at risk.
4.2 Since nitrogen loading to Waipa Stream reached a peak in 2001 there has been a
general decline with large fluctuations. Part of the decline and reduction of
fluctuations has been due to improved management in the spray application in
terms of maintenance, application rates and timing, and targeting of blocks where
there is better denitrification in the receiving wetlands. The other major factor in the
general decrease in nitrogen load has been improved treatment of the sewage in
line with treatment plant modifications. For example upgrades at the treatment plant
in May 2005 (expansion and implementation of methanol dosing) achieved a high
level of nitrogen renovation with an average nitrogen concentration of 5 g/m3 in
effluent from the plant in 2006.
4.3 However there have been fluctuations in the nitrogen concentrations from the
treatment plant and the low levels achieved in 2006 don’t appear to be sustainable
in the long term. Over the period June 08 – May 09 the average was 10 g/m3 and
currently it is back down to 8 g/m3. The latest drop is due to recent changes and
may represent a new sustainable equilibrium. Factors that have contributed to
fluctuations in nitrogen from the treatment plant include;
• Changes (i.e. extension, c-dosing, change to ethanol dosing, sudden doubling
of ethanol dosing following a period of no-C) to what is a biological system
produce a large initial effect (i.e. high nitrogen removal) which cannot be
sustained as microbial communities adjust to a stable equilibrium.
• Flow-balancing to remove peak volumes is now automated and creates a
slightly more stable system in the Bardenpho process.
• Leachate from dewatering is now returned to the DAFs rather than the
Bardenpho which has reduced the fluctuations in the nutrient load within the
Bardenpho and improved stability.
• High rainfall reduces performance so flow-balancing has been undertaken to
take the peak volume to a side-tank and reintroduce when flows are low.
4.4 Future improvements that may cause fluctuations but also reduce the nitrogen
concentration in the effluent include trialling landfill leachate treatment to remove the
high nitrogen load at source before it reaches the treatment plant. Also the first
stage planning for a MBR sidestream (filtering system) that will work in parallel with
the Bardenpho to take up to 1/3 of the flow has been initiated. This will also result in
a more constant flow through the Bardenpho and less flow through the 2 clarifiers
(better performance). It is 18-24 months away before being implemented with a
budget cost in excess of $8 million in assets and additional operating.
Environmental Publication 2009/13 – Rotorua District Council Spray Irrigation Compliance Report 13100
Reduction Mass load 80
60
%TP
%TN
40 TN (tonnes)
20
0
91 92 93 94 95 96 97 98 99 00 01 02 03 04 05 06 07 08 09
19 19 19 19 19 19 19 19 19 20 20 20 20 20 20 20 20 20 20
Figure 4 Reduction in mass load of nutrient applied to the spray irrigation area in
Whakarewarewa Forest as measured in Waipa Stream using
comparison of 12 month rolling sums.
4.5 Nutrient removal by spray irrigation over the period Jun 06 – May 09 has averaged
35% for TN and 95% for TP (shown in Figure 4) compared to an estimated design
performance of 78% and 74%. These figures are based on an average effluent
loading of 59 tonnes TN and 28 tonnes TP per year for the same period (Figure 16).
Research by Scion (Rotorua District Council 1999) has suggested that nitrogen
removal capacity of soils in the irrigation blocks is 77 kg/ha/yr. This would result in
around 17 tonnes of nitrogen being removed by the land treatment system each
year (based on 220 ha) which is close to that shown over recent years. The same
research has also suggested that nitrogen is being stored in the soil and hence
accumulating with time. Soil storage of nitrogen is recognised as not being
sustainable in the long term.
4.6 Water quality for Lake Rotorua is assessed on an annual basis by comparison of
trophic level index (TLI) with a target TLI set in the Proposed Regional Water and
Land Plan. The TLI is composed of four components: water clarity; chlorophyll-a
concentration; total nitrogen (TN); and total phosphorus (TP). Over the years 1990
to 2009 TN has increased (4.23 mg m3/yr), TP has decreased (-0.76 mg m3/yr),
chlorophyll-a increased (0.86 mg m3/yr) and clarity declined (-0.01 m/yr). The
summary TLI has shown little overall change over the period 1991-2009.
4.7 Compliance with consent 60739 for the spray irrigation of treated effluent in
Whakarewarewa Forest over the period June 2006 to August 2009 can be
summarised as follows;
• Mass loading of total nitrogen in Waipa Stream has exceeded the consent limit
of 30 tonnes/year for most of the period June 2006 to August 2009 having
been in compliance only in May and June 2007.
• Mass loading of total phosphorus in Waipa Stream has increased over the last
two years but remains well below the compliance limit of 3 tonnes/year.
14 Rotorua District Council Spray Irrigation Compliance Report – Environmental Publication 2009/13• Compliance with the quantity and rate of effluent application has been good.
• Buffer zones have been maintained and meet the required standards.
• Reporting of monitoring results complies with consent conditions and Rotorua
District Council staff provides information whenever requested.
• Monitoring of Waipa Stream has been conducted as required.
• Warning signs to inform the public of the spray irrigation sites have been
maintained.
• Since the peak nitrogen loading from the spray irrigation scheme to Waipa
Stream in 2001, there has been a general long term decline in line with
modifications to the treatment plant. Periods of very low nutrient loading from
the treatment plant are initially produced following changes (i.e. extensions,
methanol dosing) which cannot be sustained in the long term and cause large
fluctuations.
• There is a lag between nutrient loads from the treatment plant and the load
observed in Waipa Stream. Over the last year nitrogen concentrations
averaged 10 g/m3 which would likely result in further non-compliance with the
nitrogen loading in the short term. However current nitrogen load from the
treatment plant (8 g/m3) is thought to be sustainable and will produce a lower
load from the spray irrigation scheme and may achieve compliance.
• Further improvements to reduce nitrogen are currently being trialled and
planned.
Environmental Publication 2009/13 – Rotorua District Council Spray Irrigation Compliance Report 15References
Burns, N.M. 1999: Lake Rotorua and its inputs in the 1990’s. Consultancy report prepared for
Opus International Consultants Ltd.
Hall, J., Payne, G., Smith, R. 1995: Review of Rotorua Water Quality. Consultancy report
BPR302 prepared for Environment B·O·P.
McLaren, P., Park, S.G., Esler, W.R. 1996: Compliance report Rotorua District Council Consent
number 02 2151 – Discharge of Rotorua Sewage to the Whakarewarewa Forest.
Environmental Report 96/10, April 1996. Environment B·O·P, Quay Street, Whakatane,
NZ.
Park, S.G. 1995: Compliance Report Rotorua District Council Consent 02 2151 – Spray
Irrigation of Sewage in Whakarewarewa Forest. Environmental Report 99/03, February
1999. Environment B·O·P, Quay Street, Whakatane, NZ.
Park, S.G. 2001: Rotorua District Council Spray Irrigation (Whakarewarewa Forest) Compliance
Report. Environmental Report 2001/11, April 2001. Environment Bay Of Plenty, Quay
Street, Whakatane, NZ.
Park, S.G. 2003: Spray Irrigation of treated effluent in Whakarewarewa Forest - Compliance
Report. Environmental Publication 2003/14, August 2003. Environment Bay Of Plenty,
Quay Street, Whakatane, NZ.
Rotorua District Council. 1999: Waste water treatment resource consent investigation.
Professional Services Contract No. 99/054.
Rutherford, J.C., Pridmore, R.D., White, E. 1989: Management of Phosphorus and Nitrogen
Inputs to Lake Rotorua, New Zealand. J. Water Resources Planning and Management.
115(4) p. 431.
Wilding, T.K. 2000: Rotorua lakes algae report. Environmental Report 2000/06, March 2000.
Environment B·O·P, Quay Street, Whakatane, NZ.
Environmental Publication 2009/13 – Rotorua District Council Spray Irrigation Compliance Report 17Appendices Environmental Publication 2009/13 – Rotorua District Council Spray Irrigation Compliance Report 19
Appendix 1 – Consent conditions

                              Bay of Plenty Regional Council

                                        Resource Consent

Pursuant to section 105 of the Resource Management Act 1991, the Bay of Plenty
Regional Council, by a decision dated 13 September 2001, hereby grants to:

      ROTORUA DISTRICT COUNCIL

      Private Bag RO 3029
      ROTORUA

A resource consent:

(a)   pursuant to section 15(1)(b) of the Resource Management Act 1991 to
      discharge treated effluent from the Rotorua District Council
      wastewater treatment plant on to land in the Whakarewarewa
      State Forest;

(b)   pursuant to section 13(1)(a) of the Resource Management Act 1991 to place,
      use and maintain a series of structures in or on the bed of the
      Waipa Stream and associated tributaries; and
(c)   pursuant to section 15(1)(c) of the Resource Management Act 1991 to
      discharge treated effluent from the Rotorua District Council
      wastewater treatment plant into air in the Whakarewarewa State
      Forest;
subject to the following conditions:

1         Purpose
1.1       For the purpose of discharging secondary treated effluent via irrigation sprinklers to
          land within the Whakarewarewa State Forest, and

1.2       For the purpose of placement, use and maintaining of a series of v-notch weirs, a
          concrete structure and a concrete flume in or on the bed of the Waipa Stream and
          associated tributaries for water monitoring, and

1.3       For the purpose of discharging odours and aerosols from secondary treated effluent via
          irrigation sprinklers to air within the Whakarewarewa State Forest

Environmental Publication 2009/13 – Rotorua District Council Spray Irrigation Compliance Report   21
2 Location
2.1 Whakarewarewa State Forest within the areas delineated in the easement between the
Crown and Rotorua District Council as registered February 2000 being those parts of
the servient tenement marked ‘AW’, ‘AY’, ‘Q’, “AX’, and ‘BA’ on DPS 54801 and ‘A’ on
DPS 84008, as shown on BOPRC Plan Number RC60739/1 submitted with the
application for the consent.
2.2 The monitoring structures are located within the bed of the Waipa Stream and
associated tributaries as shown on BOPRC Plan Number RC60739/1.
3 Quantity and Rate
3.1 The peak daily quantity of treated effluent discharged shall not exceed 44,000 cubic
metres.
3.2 Effluent may be applied to each irrigation sub area as delineated on plan BOPRC Plan
Number RC60739/1 for a maximum continuous period of 24 hours and the rate of
application shall not exceed 5mm/hour with a maximum of 120mm/day on any specific
sub area.
4 Map Reference
4.1 At or about an area bounded by map references NZMS 260 U16 9470-3200, U16 9900-
3200, U16 9900-2800, and U16 9470-2800.
5 Legal Description
5.1 Rotomahana Parekarangi Part 4A, Part 651, Part 652B, Block V, Tarawera SD
(Rotorua District).
6 Effluent Disposal
6.1 The wastewater treatment and disposal system shall be operated and maintained at all
times generally in accordance with the Land Treatment Management Plan dated March
2000, and any subsequent amendments acceptable to the Bay of Plenty Regional
Council as confirmed in writing by the Chief Executive of the Regional Council or
delegate.
6.2 Effluent shall not be applied to any area where ponded surface water is present and
when water is flowing off the surface of that area, such that it could directly enter any
drain or natural watercourse by overland flow.
6.3 The consent holder shall operate the effluent disposal system in a manner that does
not cause erosion where practicable.
7 Buffer Zones
7.1 The consent holder shall not spray in the designated buffer zones as shown on drawing
BOPRC Plan No RC60739/1 submitted with the application.
7.2 The consent holder shall maintain a buffer zone of undisturbed natural vegetation not
less than 15 metres wide, separating the irrigated areas from wetlands.
7.3 The consent holder shall ensure there is no objectionable odour or aerosols beyond the
boundary of the spray irrigation area as defined in condition 2.1 of this consent.
22 Rotorua District Council Spray Irrigation Compliance Report – Environmental Publication 2009/138 Monitoring Stations
8.1 The consent holder shall maintain an easily accessible sampling point immediately prior
to discharge where a representative sample of the effluent can be obtained.
8.2 The consent holder shall maintain two water sampling stations on the Waipa Stream at
Rotorua District Council monitoring sites 5 and 10 as shown in BOPRC Plan Number
RC 60739/1 submitted with the application, for the purpose of assessing the
environmental effects of the discharge from the land treatment area on the stream.
8.3 Analyses shall be carried out as set out in the latest edition of “Standard Methods for
the Examination of Water and Wastewater” — APHA — AWWA — WPCF or such other
similar method as may be acceptable to the Bay of Plenty Regional Council as
confirmed in writing by the Chief Executive of the Regional Council or delegate.
9 Monitoring of Constituent Loads to the Land Treatment System
9.1 The consent holder shall measure and record the volume of effluent discharged each
day and the corresponding sub areas irrigated.
9.2 The consent holder shall collect a weekly 7 day composite of the effluent discharged to
the Land Treatment System and analyse for the following constituents:
• Chloride;
• Total Kjeldahl Nitrogen;
• Ammoniacal-Nitrogen;
• Total Oxidised Nitrogen;
• Total Phosphorus and
• Dissolved Reactive Phosphorus.
9.3 From these results the nutrient loads applied to the Land Treatment System shall be
calculated on a calendar monthly basis.
9.4 The consent holder shall collect a representative sample of effluent on at least 4 days
per month, representing different days of the week and analyse for Escherichia coli
bacteria per 100 millilitres.
9.5 Effluent analyses as required under condition 9.2 for the determination of loads to the
land treatment system as required under condition 10 for the determination of nutrient
inputs to the Waipa Stream shall be carried out as set out in the latest edition of
"Standard Methods for the Examination of Water and Wastewater' - APHA - AWWA -
WPCF or such other similar method as may be acceptable to the Bay of Plenty
Regional Council as confirmed in writing by the Chief Executive of the Regional Council
or delegate.
10 Monitoring of Nutrient and Bacterial Concentrations in the
Waipa Stream
10.1 The consent holder shall collect water quality samples from the Waipa Stream at the
two points identified in condition 8.2 and at a frequency as specified in conditions 10.2
and 10.3.
Environmental Publication 2009/13 – Rotorua District Council Spray Irrigation Compliance Report 2310.2 At the downstream site (Site 5) the consent holder shall operate a continuous flow
proportional water sampler, with appropriate sample preservation, and collect the
samples no less than weekly.
10.3 At the upstream site (Site 10) the Consent holder shall collect a grab sample of water
on no less than one occasion per month.
10.4 Samples collected at both sites identified in conditions 10.2 and 10.3 shall be analysed
for the following constituents:
• Total phosphorus,
• Dissolved reactive phosphorus,
• Nitrate-nitrogen,
• Ammoniacal- nitrogen,
• Total Kjeldahl nitrogen,
• Chloride.
10.5 The consent holder shall collect grab samples at both sites no less than one occasion
per month and analyse the samples for Escherichia coli bacteria per 100 ml.
11 Nutrient Limits- Surface Water Quality
The wastewater treatment plant and spray irrigation disposal system shall be operated
to ensure that the total sewage-derived nitrogen and phosphorus in the Waipa Stream
at site 5 does not exceed 30 tonnes and 3 tonnes respectively during any 12-month
period beginning on the 1st day of any 4, but not greater than the 5 week period to
coincide, as close as possible, with the end of the calendar month.
12 Flows in Excess of the Treatment Capacity
In the event of flows delivered to the treatment plant in wet weather exceeding the
hydraulic capacity of the treatment plant and its associated transfer pumps, pipelines
and holding lagoons or in the event of power outage or mechanical failure such that
spillage of partly treated wastewater occurs the consent holder shall report to the Bay
of Plenty Regional Council within 7 days on the following matters:
(a) The cause of the spillage, including return period of rainfall, if that be the cause,
(b) The approximate duration and quantity of the spillage,
(c) Nature of the spillage and estimate of nutrient and bacterial strength,
(d) Assessment of measures, which could be taken to prevent or mitigate the
effects of such events in future.
24 Rotorua District Council Spray Irrigation Compliance Report – Environmental Publication 2009/1313 Monitoring Structures in the Stream
13.1 The consent holder shall maintain the following structures required for the purpose of
monitoring.
GAUGING STRUCTURE LOCATION APPROX. MAP
STATION ID No. DESCRIPTION REFERENCE NZMS
260 U16
4 V notch weir Tributary to the Waipa 950 313
Stream
5 Concrete structure Lower Waipa Mill Road 947 312
6 V notch weir Waipa Mill Road 954 309
8 V notch weir Stream by Poplar Ave 967 302
10 Concrete flume Stream by Hill Road 975 302
11 V notch weir Up stream by Nice 985 306
Road
13.2 Any scour of the river channel or banks resulting from any maintenance works under
this consent, shall be effectively stabilised to the satisfaction of the Chief Executive of
the Regional Council or delegate.
13.3 All works associated with the maintenance of the structures shall be carried out in a
manner that minimises discoloration of the tributaries to the Waipa Stream and the
Waipa Stream, as far as practicable.
13.4 The works shall be carried out in a manner that minimises adverse effects on fish
passage as far as practicable.
14 Reports
14.1 Results of the monitoring stated in conditions 9.1, 9.2, 9.3 and 9.4 shall be sent to the
Regional Council within 21 days after the end of March and September.
14.2 The results of analyses carried out as required by conditions 10.4 and 10.5 together
with the mean daily flow of the Waipa Stream at site 5 shall be sent to the Regional
Council within 21 days after the end of each calendar month.
14.3 A monitoring report shall be sent to the Regional Council based on the results of the
analyses reported for condition 11, detailing the total sewage-derived nitrogen and
phosphorus loads within the Waipa Stream for any continuous 12-month period within
21 days after the end of any 4, but no greater than the 5 week period to coincide as
close as possible with the end of the calendar month.
14.4 Warning Signs
The consent holder shall erect and maintain signs to the satisfaction of the Chief
Executive of the Regional Council or delegate on the perimeter of the spray areas, at
the main access points and any paths where the public readily gain access, to warn the
public that spray irrigation of treated sewage effluent is taking place and the public
health risks involved.
Environmental Publication 2009/13 – Rotorua District Council Spray Irrigation Compliance Report 2515 Consent Review
The Regional Council may, within six months of the fifth, tenth and fifteenth year
anniversary of the commencement of this consent, serve notice on the consent holder
under sections 128(1)(a)(iii) of the Resource Management Act 1991 of its intention to
review condition 11.1 of this consent. The purpose of the review is to assess impact,
compliance and monitoring reports, on the general quality of the Waipa and Puarenga
Streams, Lake Rotorua and down stream waters, and if necessary alter nutrient loads.
The consent holder may, within six months of the fifth, tenth and fifteenth year
anniversary of the commencement of this consent, apply to the Regional Council under
section 127(1)(a) of the Resource Management Act 1991 to change discharge limits
pursuant to conditions 3.1 and 11.1 and monitoring as set out in conditions 8, 9, and 10
of this consent. The purpose of the change is to adjust discharge limits based on the
general water quality of the Waipa and Puarenga Streams, Lake Rotorua and down
stream waters.
16 Term of Consent
This consent shall expire on 31 July 2021.
17 Resource Management Charges
The consent holder shall pay the Bay of Plenty Regional Council such administrative
charges as are fixed from time to time by the Regional Council in accordance with
section 36 of the Resource Management Act 1991.
17.1 The consent hereby authorised is granted under the Resource Management Act
1991 and does not constitute an authority under any other Act, Regulation or Bylaw.
Advice Notes:
1 The calculation of sewage derived nitrogen and phosphorus in the Waipa Stream should
take into account the background load in the stream as determined at the upstream
sampling site number 10.
2 Reports pursuant to condition 14 shall be addressed to the Principal Compliance Officer of
Environment B·O·P.
3 The consent holder is advised that non-compliance with consent conditions may result in
enforcement action against the consent holder and/or their contractors.
4 The consent holder is responsible for ensuring that all contractors carrying out works
under this consent are made aware of the relevant consent conditions, plans and
associated documents.
5 Calculation of the starting day of any 12-month period referred to in conditions 11 and
14.3, is to ensure that reporting periods commence as close as possible to the first day of
the month, having regard to the consent holder’s weekly monitoring regime.
DATED at Whakatane this 26th day of October 2001
For and on behalf of
The Bay of Plenty Regional Council
J A Jones
Chief Executive
26 Rotorua District Council Spray Irrigation Compliance Report – Environmental Publication 2009/13Appendix 2 – Effluent monitoring results
(a)
16
NOx
NH4
3
Concentration g/m
12
8
4
0
91 992 993 994 995 996 997 998 999 000 001 002 003 004 005 006 007 008 009
19 1 1 1 1 1 1 1 1 2 2 2 2 2 2 2 2 2 2
(b)
320
NOx
NH4
Daily mass load (kg)
240
160
80
0
91 992 993 994 995 996 997 998 999 000 001 002 003 004 005 006 007 008 009
19 1 1 1 1 1 1 1 1 2 2 2 2 2 2 2 2 2 2
Figure 5 Concentration and daily mass load (monthly mean) of NOx and NH4
recorded in the effluent (Lowess trend line).
Environmental Publication 2009/13 – Rotorua District Council Spray Irrigation Compliance Report 27(a)
20
TKN
TN
3
Concentration g/m
15
10
5
0
91 92 93 94 95 96 97 98 99 00 01 02 03 04 05 06 07 08 09
19 19 19 19 19 19 19 19 19 20 20 20 20 20 20 20 20 20 20
(b)
400
TKN
TN
Daily mass load (kg)
300
200
100
0
91 92 93 94 95 96 97 98 99 00 01 02 03 04 05 06 07 08 09
19 19 19 19 19 19 19 19 19 20 20 20 20 20 20 20 20 20 20
Figure 6 Concentration and daily mass load (monthly mean) of TKN and TN
recorded in the effluent (Lowess trend line).
28 Rotorua District Council Spray Irrigation Compliance Report – Environmental Publication 2009/13(a)
12
DRP
TP
3
Concentration g/m
8
4
0
91 992 993 994 995 996 997 998 999 000 001 002 003 004 005 006 007 008 009
19 1 1 1 1 1 1 1 1 2 2 2 2 2 2 2 2 2 2
(b)
200
DRP
TP
Daily mass load (kg)
150
100
50
0
91 992 993 994 995 996 997 998 999 000 001 002 003 004 005 006 007 008 009
19 1 1 1 1 1 1 1 1 2 2 2 2 2 2 2 2 2 2
Figure 7 Concentration and daily mass load (monthly mean) of DRP and TP
recorded in the effluent (Lowess trend line).
Environmental Publication 2009/13 – Rotorua District Council Spray Irrigation Compliance Report 29(a)
80
3
Concentration Cl g/m
60
40
20
0
91 92 93 94 95 96 97 98 99 00 01 02 03 04 05 06 07 08 09
19 19 19 19 19 19 19 19 19 20 20 20 20 20 20 20 20 20 20
(b)
1200
Daily mass load Cl (kg)
1000
800
600
400
91 92 93 94 95 96 97 98 99 00 01 02 03 04 05 06 07 08 09
19 19 19 19 19 19 19 19 19 20 20 20 20 20 20 20 20 20 20
Figure 8 Concentration and daily mass load (monthly mean) of Chloride recorded
in the effluent (Lowess trend line).
30 Rotorua District Council Spray Irrigation Compliance Report – Environmental Publication 2009/13FC/E.coli numbers/100mL (log10 scale)
(a)
1000000
100000
10000
1000
100
10
91 992 993 994 995 996 997 998 999 000 001 002 003 004 005 006 007 008 009
19 1 1 1 1 1 1 1 1 2 2 2 2 2 2 2 2 2 2
(b)
30000
Effluent (m day )
-1
25000
3
20000
15000
10000
91 992 993 994 995 996 997 998 999 000 001 002 003 004 005 006 007 008 009
19 1 1 1 1 1 1 1 1 2 2 2 2 2 2 2 2 2 2
Figure 9 Number of FC/E.coli bacteria in the effluent and daily volume of effluent
(monthly mean and lowess trend line).
Environmental Publication 2009/13 – Rotorua District Council Spray Irrigation Compliance Report 31Appendix 3 – Waipa Stream monitoring results
(a)
0.100
3
upstream
DRP concentration g/m
downstream
0.075
0.050
0.025
0.000 1
9 92 93 94 95 96 97 98 99 00 01 02 03 04 05 06 07 08 09 10 11
19 19 19 19 19 19 19 19 19 20 20 20 20 20 20 20 20 20 20 20 20
(b)
0.4
upstream
3
downstream
TP concentration g/m
0.3
0.2
0.1
0.0 1
9 92 93 94 95 96 97 98 99 00 01 02 03 04 05 06 07 08 09 10 11
19 19 19 19 19 19 19 19 19 20 20 20 20 20 20 20 20 20 20 20 20
Figure 10 Concentration of DRP and TP at upstream and downstream sites in
Waipa Stream, Rotorua (Lowess trend line).
Environmental Publication 2009/13 – Rotorua District Council Spray Irrigation Compliance Report 33(a)
2.4
upstream
3
NOx concentration g/m downstream
1.8
1.2
0.6
0.0
91 92 93 94 95 96 97 98 99 00 01 02 03 04 05 06 07 08 09
19 19 19 19 19 19 19 19 19 20 20 20 20 20 20 20 20 20 20
(b)
0.080
upstream
3
NH4 concentration g/m
downstream
0.064
0.048
0.032
0.016
0.000
91 92 93 94 95 96 97 98 99 00 01 02 03 04 05 06 07 08 09
19 19 19 19 19 19 19 19 19 20 20 20 20 20 20 20 20 20 20
Figure 11 Concentration of NOx and NH4 at upstream and downstream sites in
Waipa Stream, Rotorua (Lowess trend line).
34 Rotorua District Council Spray Irrigation Compliance Report – Environmental Publication 2009/13(a)
3.5
upstream
3
downstream
TN concentration g/m
2.8
2.1
1.4
0.7
0.0 1
9 92 93 94 95 96 97 98 99 00 01 02 03 04 05 06 07 08 09
19 19 19 19 19 19 19 19 19 20 20 20 20 20 20 20 20 20 20
(b)
1.2
upstream
3
TKN concentration g/m
downstream
0.9
0.6
0.3
0.0 1
9 92 93 94 95 96 97 98 99 00 01 02 03 04 05 06 07 08 09
19 19 19 19 19 19 19 19 19 20 20 20 20 20 20 20 20 20 20
Figure 12 Concentration of TN and TKN at upstream and downstream sites in
Waipa Stream, Rotorua (Lowess trend line).
Environmental Publication 2009/13 – Rotorua District Council Spray Irrigation Compliance Report 35(a)
3
25
chloride concentration g/m upstream
downstream
20
15
10
5
0
91 92 93 94 95 96 97 98 99 00 01 02 03 04 05 06 07 08 09
19 19 19 19 19 19 19 19 19 20 20 20 20 20 20 20 20 20 20
(b)
FC/Ecoli numbers/100mL
upstream
downstream
1000
100
10
1
91 92 93 94 95 96 97 98 99 00 01 02 03 04 05 06 07 08 09
19 19 19 19 19 19 19 19 19 20 20 20 20 20 20 20 20 20 20
Figure 13 Concentration of chloride (Lowess trend line) and faecal coliforms/E.coli
measured at upstream and downstream sites in Waipa Stream, Rotorua.
36 Rotorua District Council Spray Irrigation Compliance Report – Environmental Publication 2009/13(a)
25
-1
20
Phosphorus kg/day
15
10
5
01
9 92 93 94 95 96 97 98 99 00 01 02 03 04 05 06 07 08 09
19 19 19 19 19 19 19 19 19 20 20 20 20 20 20 20 20 20 20
(b)
240
-1
Nitrogen kg/day
160
80
0
91 92 93 94 95 96 97 98 99 00 01 02 03 04 05 06 07 08 09
19 19 19 19 19 19 19 19 19 20 20 20 20 20 20 20 20 20 20
Figure 14 Average mass load of TP and TN measured at the downstream site in
Waipa Stream, Rotorua (Lowess trend line).
Environmental Publication 2009/13 – Rotorua District Council Spray Irrigation Compliance Report 37(a)
Monthly Mass load TP (kg) 5000
Effluent TP
Stream TP
4000
3000
2000
1000
0
91 92 93 94 95 96 97 98 99 00 01 02 03 04 05 06 07 08 09
19 19 19 19 19 19 19 19 19 20 20 20 20 20 20 20 20 20 20
(b)
12000
Monthly Mass load TN (kg)
Effluent TN
Stream TN
8000
4000
0
91 92 93 94 95 96 97 98 99 00 01 02 03 04 05 06 07 08 09
19 19 19 19 19 19 19 19 19 20 20 20 20 20 20 20 20 20 20
Figure 15 Monthly mass load of TP and TN measured in the effluent discharged in
the spray irrigation area and at the downstream site in Waipa Stream.
38 Rotorua District Council Spray Irrigation Compliance Report – Environmental Publication 2009/13(a)
12 mth Mass load TP (Tonnes)
40
Effluent TP
Stream TP
30
20
10
0
91 92 93 94 95 96 97 98 99 00 01 02 03 04 05 06 07 08 09
19 19 19 19 19 19 19 19 19 20 20 20 20 20 20 20 20 20 20
(b)
12 mth Mass load TN (Tonnes)
120
Effluent TN
Stream TN
80
40
0
91 92 93 94 95 96 97 98 99 00 01 02 03 04 05 06 07 08 09
19 19 19 19 19 19 19 19 19 20 20 20 20 20 20 20 20 20 20
Figure 16 Twelve month rolling sum of TP and TN mass load measured in the
effluent discharged in the spray irrigation area and at the downstream
site in Waipa Stream.
Environmental Publication 2009/13 – Rotorua District Council Spray Irrigation Compliance Report 39You can also read