Working Paper 2020/12 - An analysis of the responses to the 'Open Letter to District Health Boards (dated 25 March 2020)' - 01 April 2021 ...
←
→
Page content transcription
If your browser does not render page correctly, please read the page content below
Working Paper
2020/12 – An analysis
of the responses to
the ‘Open Letter to
District Health Boards
(dated 25 March 2020)’
01 April 2021
Title           Working Paper 2020/12 – An analysis of the responses to the ‘Open Letter to District
                Health Boards (dated 25 March 2020)’

Published       Copyright © McGuinness Institute Limited 01 April 2021
                ISBN 978-1-990013-28-7 (paperback)
                ISBN 978-1-990013-29-4 (PDF)

Prepared by     This document is available at www.mcguinnessinstitute.org and may be reproduced
                or cited provided the source is acknowledged.
                The McGuinness Institute, as part of PandemicNZ

Research team   Reuben Brady and Arne Larsen

Designer        Becky Jenkins

Editor          Johanna Knox

For further     McGuinness Institute
information     Phone (04) 499 8888
                Level 2, 5 Cable Street
                PO Box 24222
                Wellington 6142
                New Zealand
                www.mcguinnessinstitute.org

Disclaimer      The McGuinness Institute has taken reasonable care in collecting and presenting
                the information provided in this publication. However, the Institute makes no
                representation or endorsement that this resource will be relevant or appropriate for
                its readers’ purposes and does not guarantee the accuracy of the information at any
                particular time for any particular purpose. The Institute is not liable for any adverse
                consequences, whether they be direct or indirect, arising from reliance on the content
                of this publication. Where this publication contains links to any website or other
                source, such links are provided solely for information purposes, and the Institute is
                not liable for the content of such website or other source.

Publishing      The McGuinness Institute is grateful for the work of Creative Commons, which
                inspired our approach to copyright. This work is available under a Creative
                Commons Attribution-Noncommercial-Share Alike 3.0 New Zealand Licence. To
                view a copy of this licence visit:
                http://creativecommons.org/licenses/by-nc-nd/3.0/nz
Contents
1.0 Introduction 5
1.1 Purpose 5
1.2 Purpose of Project: PandemicNZ 6
2.0 Methodology 7
Step 1 Determining the supply chain risks of pandemic-related medical items 7
Step 2 OIA request (our OIA 2020/02) 7
Step 3 Collecting responses and other relevant correspondence 7
Step 4 Analysing the data set 8
3.0 Analysis of time taken for DHBs to respond 10
3.1 Introduction 10
3.2 Results 10
3.3 Key findings 13
4.0 Analysis of stock held by each DHB by range 14
4.1 Introduction 14
4.2 Key findings 14
5.0 Analysis of stock held by each DHB by volume 15
5.1 Introduction 15
5.2 Results 15
6.0 Observations 22
6.1 Summary 22
6.2 Three major suggestions for consideration 22
References 34
List of Appendices
Appendix 1: ‘OIA 2020/02: Open Letter to District Health Boards’ 23
Appendix 2: DHB research data (medical items required for pandemics held by district health boards) 24
Appendix 3: Graph of masks per person by DHB over the time it took DHBs to respond 25
Appendix 4: Analysis of PPE volumes with respect to DHB staff and DHB populations 26
Appendix 5: Graphs relating to mask analysis by demographic 32List of Figures Figure 1: Deprivation and geographic differences between DHBs 9 Figure 2: Timeliness of DHB responses 13 Figure 3: Total number of different products held by each DHB 14 Figure 4: Average masks per person by DHB 15 Figure 5: Average gloves per person by DHB 16 Figure 6: Average goggles per person by DHB 16 Figure 7: Average gowns per person by DHB 17 Figure 8: Ventilators per person by DHB 17 Figure 9: CT scanners per person by DHB 18 Figure 10: Oxygen tanks per person 18 Figure 11: Masks per person for by the percentage of the DHB’s population living in high deprivation areas 19 Figure 12: Masks per person by the percentage of the DHB’s population that is of Mäori descent 20 Figure 13: Masks per person by the percentage of the DHB’s population that is over 65 years old 20 Figure 14: Masks per person by the percentage of the DHB’s population living in rural areas 21 List of Tables Table 1: DHB responses as at 17 September 2020 10 Table 2: Status of DHB responses as at 17 September 2020 11 List of Tables in Appendices Table 4.1: Stock by DHB Staff 26 Table 4.2: Stock by DHBs population 28
1.0 Introduction
1.1       Purpose
This research aims to analyse and compare stock levels and types of personal protective equipment (PPE)
held across district health boards (DHBs) with respect to characteristics associated with DHB populations.
Populations differ by scale, density, ethnicity, age profile and deprivation (Simpson, 2020). Through
comparison of DHBs and associated demographics, it is clear that there is a correlation between deprivation
and poor health status (Simpson, 2020).

This analysis aims to identify what type of PPE-related shortages exist, in the hope that this will help with
preparations for future city/regional lockdowns. Overall, the research aims to explore the current status of PPE
practices and stock that exist across DHBs and how it could adversely impact New Zealand during future viral
outbreaks.

Since mid-January 2020, the Institute has been trying to ascertain stock levels of PPE, as well as other
pandemic-related medical items (e.g. CT scanners, ventilators, oxygen tanks) held by DHBs and the Ministry
of Health (MOH). The Institute is particularly interested in the impact that pandemics may have on the
availability, accessibility and distribution of PPE and other pandemic-related medical items throughout
New Zealand, especially in response to COVID-19. Our interest is in the identification and management of
supply-chain risks for future pandemics and the extent to which the current systems are working effectively
and align with the 2017 New Zealand Influenza Pandemic Plan, in particular page 13. (MOH, 2017a).

Of key importance is the National Health Emergency Plan, which details the responsibilities of the Ministry
and DHBs in managing and using these significant national resources.

                                    WORKING PAPER 2020/12 | MCGUINNESS INSTITUTE                               5
During the pandemic, the Institute has been requesting information through the Official Information Act
(OIA) about stocks of PPE and other pandemic-related medical items, as well as about how these stocks
are being managed and who is responsible/accountable for that management. In relation to COVID-19,
the Institute sent a number of OIA requests to government, including an OIA to DHBs on 25 March 2020
(see Appendix 1), with the intention of gathering information to understand New Zealand’s current stock
levels and stock types. The response by each DHB can be found on the Institute’s publications page, under
correspondence/OIAs.
In April 2020, the OAG agreed with the Ministry of Health to independently review the Ministry’s
management of PPE during the early stages of the country’s response to COVID-19. The aim was to do a
relatively rapid review given the high level of public interest in PPE. John Ryan, Controller and Auditor-
General, outlined what OAG found in their rapid review:
The Ministry did not regularly review DHBs’ plans to ensure that they were kept current and that they
were well aligned with the Ministry’s overall plans. We found some misalignment in the plans about
roles and responsibilities for both planning for, and providing PPE in a pandemic, which led to confusion.
The gaps in the planning also meant that the Ministry was not well positioned to ensure that PPE was
available in enough quantities throughout the country to meet the demand caused by the pandemic.
The health and disability system is semi-devolved, with distributed responsibilities and often complex
arrangements between the Ministry, DHBs, and other organisations. The Ministry is responsible for
monitoring and forecasting usage of the national reserve of PPE, and prioritising and allocating supplies
when needed.
However, in early February 2020, the Ministry did not know what PPE stock the DHBs held in their
reserve supplies or have a system to forecast demand. The devolved system of managing and
distributing PPE stock for operational use was not able to manage the increased flow of stock needed
during the Covid-19 response, and DHBs identified that some of the national reserve stock DHBs held
had expired. (OAG, 2020)
The purpose of this working paper is to add to this narrative and highlight not only the data evidenced at
that point of time but what a better system might look like. Given the importance of this work and the wide
public interest in PPE during times of a pandemic, the Institute may repeat this work in the future to see if
better alignment in the plans about roles and responsibilities have occurred and whether a better system of
stock management across DHBs has been implemented. Thank you for your interest in this research.
1.2 Purpose of Project: PandemicNZ
This working paper forms part of Project PandemicNZ, which aims to help New Zealand prepare for
future pandemics, as well as manage and learn from the current COVID-19 pandemic. Project PandemicNZ
draws together early Institute publications as well as an increasingly comprehensive suite of research and
publications relating to the COVID-19 pandemic.
This working paper follows on from previous PandemicNZ publications/initiatives that focus on
COVID-19. The first publication in this project was 2006/01 - Managing the Business Risk of a Pandemic:
Lessons from the Past and a Checklist for the Future (2006) followed by Lessons from the West African Ebola
Outbreak in Relation to New Zealand’s Supply Chain Resilience (2015). To learn more about recent research,
please see our PandemicNZ project page on our website. Recent initiatives include:
• SupplyNZ: Winning the war against COVID-19 is a sub-project of PandemicNZ, and aims to connect makers,
suppliers and purchasers of important equipment in the battle against COVID-19.
• An analysis of the 2020 NZNO PPE Survey.
6 WORKING PAPER 2020/12 | MCGUINNESS INSTITUTE2.0 Methodology
Given that the Institute is independent of government and therefore only has access to publicly available
information, our approach has been to request information directly from DHBs under the OIA. The Institute
believes that timely, complete and accurate information is necessary to inform not only decision makers, but
the wider public service and interested citizens. This information is critical: if we know we do not have the
required PPE and other essential pandemic-related medical items to manage a large outbreak, the country’s
only alternative is a lockdown at the border. Collecting and sharing information about our healthcare
system’s lack of preparedness for a pandemic is an important part of shaping public behaviour and gathering
support for lockdowns during this pandemic. We hope the collected information will help New Zealand
navigate this pandemic in other ways as well and, crucially, redesign the health system in preparation for
future pandemics. This point is discussed further in the Observations section (see page 22).
Our method involves four steps:
Step 1: Determining the supply chain risks for pandemic-related
medical items
The Institute has identified three types of audiences that are interested in stocks of key medical items that are
essential to manage outbreaks of COVID-19:
a. health care workers, enabling them to stay safe while treating patients (e.g. PPE);
b. patients, enabling them to get the best medical care while keeping family and caregivers safe (e.g.
ventilators); and
c. the wider population, differentiating between people that are infected and not infected (e.g. testing
equipment).
A list of the resulting medical stock is contained in our first OIA request (see Appendix 1).
Step 2: OIA request (our OIA 2020/02)
On 25 March 2020, the Institute sent an ‘Open Letter to District Health Boards’ requesting quantifiable data
relating to PPE stock levels. The research presented in this work has resulted from stock levels included in
the DHB responses to the OIA request. The request was published on the McGuinness Institute website as an
open letter (see Appendix 1).
Step 3: Collecting responses and other relevant correspondence
DHB responses and correspondence were processed as they were received. Soft and hard copy folders were
made for each OIA.
• All correspondence was then aggregated and uploaded to the McGuinness Institute website where it
could be viewed publicly as part of our online OIA schedule found on the McGuinness Institute website
under McGuinness Institute Correspondence/OIAs. The correspondence schedule contains all necessary
information related to our OIA 2020/02, such as title, subject matter, affiliated party/recipient, date sent,
date received, reference number and status.
• All data from that correspondence was compiled on an excel and is available as an additional document
on the McGuinness Institute website under Working Papers – Working paper 2020/12. The excel
contains all the actual stock levels that were obtained from the responses by DHBs. A small image of the
excel is contained in Appendix 2.
Note:
1. Auckland DHB and Tairäwhiti DHB (and their associated populations) have been excluded from
Step 4 as they did not provide the Institute with any data.
WORKING PAPER 2020/12 | MCGUINNESS INSTITUTE 72. Canterbury DHB and West Coast DHB reported their stock levels together as West Coast DHB
draw all their stock from Canterbury DHB. Given this, we reduced Canterbury DHB numbers by
West Coast DHB numbers to ensure there was no double counting.
Step 4: Analysing the data set
The data used for this analysis was gathered from DHB responses to the OIA request. DHBs responded to
the OIA at different times, which impacted the ability to meaningfully compare stock levels. Because of
this, all DHB-specific observations from this analysis have been made based off stock levels as they were
received. Therefore, as our analysis does not use stock levels at a specific point in time, the data cannot be
easily compared between DHBs and as such should not be used to make specific decisions for any one DHB.
Instead, the value of this type of analysis is the story it tells about the management of stock between April
and September across New Zealand.
To compare volumes of stock held across each DHB, the Institute collated the individual types (and
amounts) of stock into larger groups. For example, various types of masks (surgical, N95, etc.) and their
respective quantities were grouped together under ‘total masks’. This was necessary because we found that
there was not a clear product code for items across the DHBs. Note that grouping was applied in all instances
where it was possible.
The next step was to then analyse and compare data between DHBs. Section 3.2 includes analysis on the
range and volume of PPE stock held across DHBs. The analysis takes into account the number of staff
employed at each DHB as well as the populations serviced by each district.
It is important to appreciate the length of time it took for all responses to come in – five months and 19
days in total. We received the first response on 28 April 2020 and the last on 17 September (see Figure 1). As
mentioned, we considered this when gathering the data and realised that this enabled us to see a clear trend
of stock decreasing over time. This implied that any restocking of the DHBs was either too small or not
happening at all (see Appendix 3).
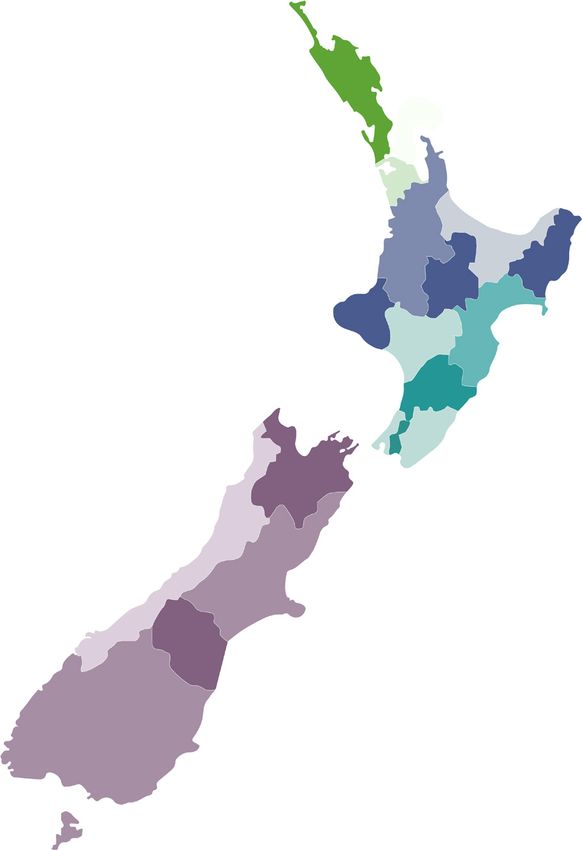
8 WORKING PAPER 2020/12 | MCGUINNESS INSTITUTEFigure 1: Deprivation and geographic differences between DHBs
Source: New Zealand Health and Disability System Review (published March 2020).
Northern reigion DHBs Midland reigion DHBs
Northland Waikato
Population 176,954 Population 412,924
37.7% 33.7% 25.2% 22.7%
19.5% 49.0% 15.6% 20.1%
Waitematā Bay of Plenty
Population 614,114 Population 234,355
8.2% 9.9% 24.9% 24.9%
13.8% 6.3% 19.4% 19.7%
Auckland Tairāwhiti
Population 531,201 Population 48,778
18.3% 8.0% 48.1% 50.1%
11.0% 0.2% 15.2% 25.2%
Counties Manukau Lakes
Population 532,203 Population 109,230
35.9% 15.7% 34.3% 34.6%
11.5% 6.9% 15.9% 20.5%
Taranaki
Population 118,878
15.4% 19.1%
Southern reigion DHBs 17.4% 24.0%
Nelson Marlborough
Population 149,549
8.9% 10.4%
Central reigion DHBs
21.3% 20.7%
West Coast Hawke’s Bay
Population 32,444 Population 164,608
10.4% 11.9% 27.7% 25.8%
18.3% 43.4% 18.5% 13.0%
Canterbury Whanganui
Population 557,137 Population 64,308
9.4% 9.0% 36.6% 26.5%
15.6% 14.0% 19.4% 19.5%
South Canterbury Mid Central
Population 59,804 Population 177,403
9.4% 8.5% 25.8% 19.9%
22.0% 30.6% 17.6% 18.4%
Southern Wairarapa
Population 326,275 Population 44,642
11.9% 10.0% 20.4% 17.3%
16.8% 23.9% 21.2% 25.3%
Hutt Valley
Population 148,581
19.8% 17.3%
14.6% 2.1%
Legend
% Share in high deprivation areas Capital and Coast
Population 314,662
% Share Māori
% Share over 65 12.3% 11.4%
% Share in rural areas 13.1% 0.9%
Figure 1 taken from Health and Disability System Review (published March 2020) illustrates deprivation and
geographic differences between New Zealand’s DHBs. The Institute has used these figures alongside the data
received from OIAs to frame our analysis.
WORKING PAPER 2020/12 | MCGUINNESS INSTITUTE 93.0 Analysis of time taken for DHBs to respond
3.1 Introduction
This section provides an analysis of the response timeframes for each DHB, throughout the total six-month
research period. This was important to analyse as it indicated the challenges DHBs faced to provide this
information. We had expected this information would be easy for DHBs to provide given they were required
to keep a record of stock for accounting purposes and the MOH had to review stock usage and availability,
such as ‘Local and regional supplies usage reporting and forecasting’ under the National Health Emergency
Plan: National Reserve Supplies Management and Usage Policies (MOH, 2013, p. 2, 9).
The process of collecting responses and gathering data was challenging. Over this research period, DHBs
either:
a. completed the full request;
b. extended the response period (under s 15A of the Official Information Act 1982);
c. transferred the request to the MOH or regional health centre (under s 14 of the Official Information
Act 1982);
d. refused to respond (under s 18(f) of the Official Information Act 1982); or
e. failed to respond.
All DHBs that initially rejected the request were able to provide the Institute with at least partial
information. One DHB, however, acknowledged the request, but did not provide any information. Table
1 (below) illustrates the different responses by each DHB and Table 2 illustrates the request status as at 17
September 2020 (the final date that the Institute received correspondence).
3.2 Results
Table 1: DHB responses as at 17 September 2020
District health board 1st response 2nd response 3rd response
Auckland DHB (ADHB) Extended under s 15A Transferred to MOH
(31 March 2020) under s 14 (7 May 2020)
Bay of Plenty DHB Completed full request
(BOPDHB) (28 April 2020)
Canterbury DHB Completed full request
(CDHB) (4 June 2020)
Capital & Coast DHB Rejected under s 18(f) (1 Completed full request
(CCDHB) May 2020) (20 August 2020)
Counties Manukau Rejected under s 18(f) Completed partial Transferred to the
DHB (CMDHB) (6 April 2020) request (8 May 2020) Northern Region
Health Coordination
Centre under s 14 (7
August 2020)
Hawke's Bay DHB Completed full request
(HBDHB) (20 August 2020)
Hutt Valley DHB Rejected under s 18(f) (1 Completed full request
(HVDHB) May 2020) (17 September 2020)
Lakes DHB Completed full request Completed full request
(1 May 2020) (3 August 2020)
MidCentral DHB Rejected under s 18(f) Completed partial Completed full request
(MDHB) (27 March 2020) request (20 May 2020) (11 August 2020)
Nelson-Marlborough Extended under s 15A Completed partial Completed full
DHB (NMDHB) (24 April 2020) request (30 April 2020) request (28 May 2020)
10 WORKING PAPER 2020/12 | MCGUINNESS INSTITUTEDistrict health board 1st response 2nd response 3rd response
Northland DHB Rejected under s 18(f) Completed partial Completed full
(NDHB) (30 March 2020) request (6 May 2020) request (20 August
2020)
South Canterbury DHB Completed partial Completed full request
(SCDHB) request (8 May 2020) (17 September 2020)
Southern DHB (SDHB) Rejected under s 18(f) Completed partial
(3 April 2020) request (28 May 2020)
Tairāwhiti DHB (TDH) OIA acknowledged (27
August 2020)
Taranaki DHB (TDHB) Rejected under s 18(f) Completed partial Completed full
(30 March 2020) request (7 May 2020) request (31 July 2020)
Waikato DHB Rejected under s 18(f) Accepted and logged Completed full
(17 April 2020) (24 July 2020) request (27 August
2020)
Wairarapa DHB Completed partial Completed full request
(WRDHB) request (8 May 2020) (17 August 2020)
Waitematā DHB Rejected under s 18(f) Completed partial Transferred to the
(30 March 2020) request (11 May 2020) Northern Region
Health Coordination
Centre under s 14 (7
August 2020)
West Coast DHB Completed full request
(WCDHB) (4 June 2020)
Whanganui DHB Completed partial Completed full request
(WDHB) request (1 March 2020) (22 May 2020)
Note: The process of receiving responses from all DHBs was challenging. Because of this, the Institute
generated two additional requests that were related to the first OIA. These were:
(i) Specific request on masks (sent 30 April 2020): Requested DHBs that rejected the OIA under s 18(f) of
the Official Information Act 1982 to disclose the approximate number of (a) P2 (or equivalent) masks and (b)
surgical masks held within their respective stores and the date of the most recent stocktake. The aim was to
at least gain an understanding of mask stocks across all DHBs.
(ii) Reminder request (sent 17 July 2020): Reminded DHBs that had not provided a full answer to the
original OIA (dated 25 March 2020) to complete it as soon as possible. The Institute included an empty Excel
spreadsheet template based off of the response from BOPDHB to aid responses.
Table 2: Status of DHB responses as at 17 September 2020
District health Date of Date of Date of Comments in Status
board response from response most recent regard to DHB
DHB to partial from DHB to correspondence responses
request full request
(masks only)
Auckland DHB 7 May 2020 OIA transferred Transferred
(ADHB) to MOH (under
s 14)
Bay of Plenty 28 April 2020 28 April 2020 28 April 2020 OIA Completed
DHB (BOPDHB) comprehensively
answered
Canterbury DHB 26 May 2020 4 June 2020 4 June 2020 OIA Completed
(CDHB) comprehensively
answered
WORKING PAPER 2020/12 | MCGUINNESS INSTITUTE 11District health Date of Date of Date of Comments in Status
board response from response most recent regard to DHB
DHB to partial from DHB to correspondence responses
request full request
(masks only)
Capital & Coast 1 May 2020 20 August 27 August 2020 OIA Completed
DHB (CCDHB) 2020 comprehensively
answered
Counties 8 May 2020 7 August 2020 OIA transferred Transferred
Manukau DHB to the Northern
(CMDHB) Region Health
Coordination
Centre (NHRCC)
(under s 14)
Hawke's Bay 30 April 2020 20 August 20 August 2020 OIA Completed
DHB (HBDHB) 2020 comprehensively
answered
Hutt Valley DHB 17 September 17 September OIA Completed
(HVDHB) 2020 2020 comprehensively
answered
Lakes DHB 1 May 2020 3 August 3 August 2020 OIA Completed
2020 comprehensively
answered
MidCentral DHB 20 May 2020 11 August 11 August 2020 OIA Completed
(MDHB) 2020 comprehensively
answered
Nelson- 30 April 2020 28 May 2020 28 May 2020 OIA Completed
Marlborough comprehensively
DHB (NMDHB) answered
Northland DHB 6 May 2020 20 August 20 August 2020 OIA Completed
(NDHB) 2020 comprehensively
answered
South 8 May 2020 17 September 17 September OIA Completed
Canterbury DHB 2020 2020 comprehensively
(SCDHB) answered
Southern DHB 28 May 2020 28 May 2020 OIA partially Incomplete
(SDHB) answered
Tairāwhiti DHB 27 August 2020 OIA Incomplete
(TDH) acknowledged,
but nothing
more
Taranaki DHB 7 May 2020 13 August 13 August 2020 OIA Completed
(TDHB) 2020 comprehensively
answered
Waikato DHB 27 August 27 August 2020 OIA Completed
2020 comprehensively
answered
Wairarapa DHB 8 May 2020 21 August 21 August 2020 OIA Completed
(WRDHB) 2020 comprehensively
answered
Waitematā DHB 11 May 2020 7 August 2020 OIA transferred Transferred
to the Northern
Region Health
Coordination
Centre (NHRCC)
(under s 14)
12 WORKING PAPER 2020/12 | MCGUINNESS INSTITUTEDistrict health Date of Date of Date of Comments in Status
board response from response most recent regard to DHB
DHB to partial from DHB to correspondence responses
request full request
(masks only)
West Coast DHB 26 May 2020 4 June 2020 4 June 2020 OIA Completed
(WCDHB) comprehensively
answered
Whanganui DHB 1 May 2020 22 May 2020 22 May 2020 OIA Completed
(WDHB) comprehensively
answered
Order of DHB responses and their respective population sizes
Figure 2: Timeliness of DHB responses
[[Figure 1]]
700,000
Waitematā DHB
600,000 CDHB CMDHB
ADHB
500,000
DHB Population
Waikato DHB
400,000 SDHB CCDHB
300,000 BOPDHB TDHB
NDHB
MDHB HBDHB
2 00,000 NMDHB HVDHB
Lakes DHB
100,000 WDHB WRDHB TDH SCDHB
WCDHB
0
34 37 43 58 64 72 72 128 128 131 135 135 145 148 148 148 155 155 176 176
Days to respond since sending out the OIA
Key: Completed OIA Transferred OIA Incomplete OIA
Figure 2 illustrates the time period of correspondence between the Institute and each DHB. The graph
compares the days it took (x-axis) and the size of each DHB’s respective population (y-axis). This indicates
whether the size of the DHB had an impact on the time it took to respond to the OIA. It is important to
note that the dates presented on Figure 2 are either (i) when the Institute received the completed OIA request,
or (ii) when the Institute received the latest correspondence (in the case where the OIA request was not
completed). The types of responses (complete, transferred or incomplete) are distinguished by colour (see key).
3.3 Key findings
• Two DHBs (SDHB and TDH) did not complete the OIA request. Their responses took 64 days
(when a rejection was received) and 155 days (when an acknowledgement was received but nothing
more), respectively.
• A district’s population size did not have an impact on the DHB’s ability to respond.
• The average number of days for those that did complete a response was 114 days.
• BOPDHB, NMDHB and WDHB took the least time to complete the request – 34, 37, and 58 days
respectively.
• Waikato DHB, HVDHB, SCDHB took the most time to complete the request – 155, 176 and 176 days
respectively.
WORKING PAPER 2020/12 | MCGUINNESS INSTITUTE 134.0 Analysis of stock held by each DHB by range
4.1 Introduction
From the comparison of the range of PPE stock held between DHBs, the Institute has been able to identify
which DHBs have the largest range of PPE stock and what products are most commonly held between DHBs.
We also found that a lot of the DHBs had different product codes as ways of identifying the same items. To
give an example of this, Mask Procedure Ear Loop Adult Blue 4-ply ASTM Level 2 Help-It was given the code
301325 by BOPDHB, 00010199 by CCDHB and 1000628 by HBDHB. Of the 12 DHBs that responded with a
product code, there were six different codes used, with the majority being the same as BOPDHB’s response. In
this study, we used BOPDHB’s codes as they were the first to respond and their products seemed to be most
commonly used throughout the DHBs.
Figure 3: Total number of different products held by each DHB
Total number of different products [[Figure 3]]
60
50
40
Number of products
30
20
10
0
B
HB
B
B
B
HB
HB
HB
HB
B
B
B
HB
B
B
H
B
B
B
HB
H
DH
DH
DH
DH
DH
DH
DH
DH
DH
DH
DH
TD
CD
PD
ND
RD
CD
TD
SD
AD
SC
CM
CC
HV
HB
NM
W
M
o
s
ā
BO
W
W
ke
at
at
em
La
aik
W
ait
W
DHBs
4.2 Key findings
• Waikato DHB, BOPDHB and WRDHB held the highest range of PPE products at the time stocks were
taken – 54, 27 and 21 items, respectively.
• CMDHB and seven other DHBs held the lowest range of PPE products at the time the stocks were taken
– 1 and 2 items, respectively.
• HBDHB and SCDHB were the only DHBs that completed the request yet held zero PPE products.
However, this outcome resulted from inconsistent product codes and consequently the inability to
complete the stock take in the format the Institute provided.
• The most commonly held products were:
• Handwash Gel 500mL Ethyl Alcohol 70% Microshield Angel Clear Schulke – held by 12 DHBs,
• Mask Respirator Particulate N95 Regular Flat-Fold Fluidshield Halyard – held by 7 DHBs, and
• Wipe Surface Disinfection 33x22cm Reynard – also held by 7 DHBs.
14 WORKING PAPER 2020/12 | MCGUINNESS INSTITUTE5.0 Analysis of stock held by each DHB by volume
5.1 Introduction
PPE stock volumes presented in this section have been analysed with respect to three different variables.
Firstly, with respect to populations serviced by each DHB, and secondly, with respect to DHB staff numbers,
and thirdly, with respect to demographics across districts. Analysing data with respect to the above variables
allows for a deeper understanding of how PPE stocks compare on micro (staff) and macro (population and
demographic) scales. The staff number figures used were based off those provided by the MOH dated March
2017, while the population statistics were based off figures provided in the New Zealand Health and Disability
System Review published March 2020 (see Figure 3).
Note: Analysis of PPE stock for DHB staff excluded ventilators, CT scanners and oxygen tanks as staff do not
require these products to protect themselves against COVID-19.
5.2 Results
The results have been separated into three different categories: population, staff numbers, and demographics.
(a) Stock by the number of citizens serviced by each DHB
Please see Appendix 4 to view the data that the following observations have been based off.
(i) Analysis of Masks
• The stock of masks per capita of each DHB diminished over time; this is evidenced by the fact that the
later a DHB provided stock levels (in response to our OIA) the fewer masks were in stock per capita. Put
another way, the earlier data was provided, the more masks were available. See Appendix 3.
Figure 4: Average masks per person by DHB
14
12
10
8
6
4
2
0
B
B
B
B
HB
B
B
HB
e m HB
HB
HB
HB
B
B
HB
B
HB
DH
DH
DH
DH
DH
DH
DH
DH
DH
PD
D
ND
RD
CD
SD
TD
sD
HV
NM
HB
M
SC
CM
CC
W
o
ā
BO
W
W
ke
at
at
La
aik
W
ait
W
• BOPDHB had the highest proportionate number of masks (12.6 masks per person). In contrast, TDHB
had the lowest proportionate number of masks (0.04 masks per person). See graph above.
WORKING PAPER 2020/12 | MCGUINNESS INSTITUTE 15(ii) Analysis of Gloves
Figure 5: Average gloves per person by DHB
70
60
50
40
30
20
10
0
B
W B
NM B
B
at H
B
B
HB
aik DH B
CM B
La H B
B
B
B
HB
W B
HB
HB
B
HB
DH
H
DH
DH
DH
DH
DH
DH
DH
DH
H
e m TD
DH
sD
AD
PD
ND
CD
RD
TD
SD
CC
HV
HB
W
M
C
SC
o
ā
BO
ke
at
W
ait
W
• BOPDHB had the highest proportionate number of gloves (63.1 gloves per person). In contrast, MDHB
had the lowest proportionate number of gloves (0.04 gloves per person).
Note: WDHB gave their number of gloves in terms of how many boxes, and did not specify how many gloves
in each box.
(iii) Analysis of Goggles
Goggles
Figure 6: Average goggles per person by DHB per person [[Figure 6]]
0.6
0.5
0.4
0.3
0.2
0.1
0
HB
B
W B
ke B
NM B
HB
HB
B
at B
B
HB
B
B
at H
B
B
W B
HB
CM B
B
DH
DH
DH
H
H
H
H
DH
H
DH
DH
DH
DH
DH
e m TD
PD
ND
RD
CD
D
TD
SD
sD
CD
AD
CC
HV
HB
W
M
SC
o
ā
BO
La
aik
W
ait
W
• BOPDHB had the highest proportionate number of goggles (0.6 goggles per person). In contrast,
NMDHB had the lowest proportionate number of goggles (0.0007 goggles per person).
16 WORKING PAPER 2020/12 | MCGUINNESS INSTITUTE(iv) Analysis of Gowns
Figure 7: Average gowns per personGowns
by DHB per person [[Figure 7]]
9
8
7
6
5
4
3
2
1
0
W B
B
ke B
HB
HB
aik DH B
B
B
B
HB
W B
B
at H
B
NM B
HB
HB
HB
B
B
H
DH
DH
H
DH
DH
DH
DH
DH
DH
DH
DH
e m TD
PD
ND
RD
TD
SD
sD
CD
AD
C
CM
CC
HV
HB
W
M
SC
o
ā
BO
at
La
W
ait
W
• BOPDHB had the highest proportionate number of gowns (8.1 gowns per person). In contrast,
NMDHB had the lowest proportionate number of gowns (0.07 gowns per person).
(v) Analysis of Ventilators
Ventilators
Figure 8: Ventilators per person by DHB per person [[Figure 8]]
0.00025
0.0002
0.00015
0.0001
0.00005
0
W B
B
B
H
La D HB
W B
HB
CM B
at B
B
B
NM B
at B
HB
HB
HB
B
B
HB
HB
H
DH
DH
DH
DH
em DH
DH
DH
DH
H
TD
DH
DH
CD
AD
PD
ND
CD
RD
SD
sD
HV
HB
W
M
SC
T
CC
o
ā
BO
ke
aik
W
ait
W
• Waikato DHB held the single highest number of ventilators (69). However, SCDHB and BOPDHB had
the most ventilators per person (1 for every 5,000 people). MDHB and WRDHB had the least number of
ventilators per person (1 for every 22,000 people).
WORKING PAPER 2020/12 | MCGUINNESS INSTITUTE 17(vi) Analysis of CT Scanners
Figure 9: CT scanners per person by DHB
CT Scanners per person [[Figure 9]]
0.000035
0.00003
0.000025
0.00002
0.000015
0.00001
0.000005
0
BO B
B
B
H
NM B
B
at B
La H B
CM B
at B
B
B
HV B
HB
HB
W B
HB
B
HB B
HB
DH
H
H
DH
DH
DH
DH
em H
DH
DH
DH
TD
H
DH
DH
W es D
CD
AD
PD
ND
CD
RD
SD
TD
W
M
SC
CC
o
ā
W
k
aik
ait
W
• CDHB held the single highest number of CT scanners (6). However, WCDHB had the most CT
scanners per person (1 for every 32,444 people). MDHB had the least number of CT scanners per person
(1 for every 177,403 people).
(vii) Analysis of Oxygen Tanks
Figure 10: Oxygen tanks per person
Oxygen tanks per person [[Figure 10]]
0.003
0.0025
0.002
0.0015
0.001
0.0005
0
at B
B
W B
at B
HB
W B
HB
NM B
B
B
HB
B
B
H
B
ke B
HB
HB
CM B
B
em DH
DH
H
DH
H
H
H
DH
DH
DH
DH
DH
DH
DH
TD
PD
ND
RD
CD
SD
D
sD
CD
AD
T
CC
HV
HB
W
M
SC
o
ā
BO
La
aik
W
ait
W
• HBDHB held the single highest number of oxygen tanks (406), and also had the most oxygen tanks per
person (1 for every 405 people). NDHB had the least number of oxygen tanks per person (1 for every
176,954 people).
(b) Stock by DHB staff numbers
Please see Appendix 4 to view the data that the following observations have been based off.
• BOPDHB had the highest proportionate number of masks. At the time stock was taken, BOPDHB was
able to supply 2515 masks per staff member. In contrast, TDHB had the lowest proportionate number
of masks – able to supply only 8.1 masks per staff member.
18 WORKING PAPER 2020/12 | MCGUINNESS INSTITUTE• BOPDHB had the highest proportionate number of gloves. At the time stock was taken, BOPDHB was
able to supply 12,559 gloves per staff member. In contrast, MDHB had the lowest proportionate number
of gloves – able to supply only 7.7 gloves per staff member.
• BOPDHB had the highest proportionate number of goggles. At the time stock was taken, BOPDHB was
able to supply 113 goggles per staff member. In contrast, NMDHB had the lowest proportionate number
of goggles – able to supply only 0.2 goggles per staff member.
• BOPDHB had the highest proportionate number of gowns. At the time stock was taken, BOPDHB was
able to supply 1614 gowns per staff member. In contrast, WDHB had the lowest proportionate number
of gowns – able to supply only 12.9 gowns per staff member.
(c) Analysis of Volume of Masks by Demographics
• As masks are arguably the single most important PPE product, the Institute believed that it was
necessary to undertake specific analysis in this regard. The analysis had a primary focus on the number
of masks available (per person) with respect to minority groups for each DHB. The population
characteristics of interest were residents living in areas of high deprivation, residents who identify as
Mäori, residents aged 65 years and older and residents living in rural areas. The population characteristics
were taken from the New Zealand Health and Disability System Review published March 2020 (see Figure
1). For more data on this please see Appendix 5.
(i) Population with high deprivation
Figure 11: Masks per person by the percentage of the DHB’s population living in high deprivation areas
High Deprivation [[Figure 11]]
14
BOPDHB
12
10
Average masks per person
8
6
CDHB
4 NMDHB
WDHB
MDHB TDHB
WRDHB Waitematā DHB
HVDHB SDHB WCDHB SDCHB
2 Lakes DHB HBDHB
NDHB Waikato DHB
CMDHB CCDHB
0
3 7.7 3 6.6 3 5.9 3 4.3 27.7 25.8 25.2 24.9 20.4 19.8 15.4 12.3 11.9 10.4 9.4 9.4 8.9 8.2
% of the DHB's population living in high deprivation areas
• Associated with the highest percentage (38%) of residents living in areas of high deprivation, NDHB had
the ability to supply 0.8 masks per person serviced by the DHB. In contrast, associated with the lowest
percentage (8%) of residents living in areas of high deprivation, Waitematä DHB had the ability to
supply 0.6 masks per person serviced by the DHB at the time stock was taken.
WORKING PAPER 2020/12 | MCGUINNESS INSTITUTE 19(ii) Population of Mäori descent
Figure 12: Masks per person by the percentage of the DHB’s population that is of Māori descent
Māori [[Figure 12]]
14
BOPHB
12
10
Average masks per person
8
6
WDHB NMDHB
MDHB SDHB CDHB
4
WRDHB
Lakes DHB NDHB BOPDHB SCDHB
HBDHB Waikato DHB Waitematā DHB
2 CCDHB
HVDHB
TDHB CMDHB
0
3 4.6 33.7 26.5 25.8 24.9 22.7 19.9 19.1 17.3 17.3 15.7 11.9 11.4 10.4 10 9.9 9 8.5
% of the DHB's population that is Māori
• Associated with the highest percentage (35%) of Mäori residents, Lakes DHB had the ability to supply
1.7 masks per person serviced by the DHB. In contrast, associated with the lowest percentage (9%) of
Mäori residents, SCDHB had the ability to supply 2 masks per person serviced by the DHB at the time
stock was taken.
(iii) Population over 65
Figure 13: Masks per person by the percentage of the DHB’s population that is over 65 years old
Over 65 years old [[Figure 13]]
14
BOPDHB
12
10
Average masks per person
8
6
NMDHB
4
WDHB CDHB
MDHB
WRDHB SDHB HVDHB CCDHB
SCDHB HBDHB WCDHB
2 Lakes DHB Waikato DHB Waitematā DHB
NDHB
TDHB CMDHB
0
22 21.3 21.2 19.5 19.4 19.4 18.5 18.3 17.6 17.4 16.8 15.9 15.6 15.6 14.6 13.8 13.1 11.5
% of the DHB's population over 65 years old
• Associated with the highest percentage (22%) of residents aged 65-years and older, SCDHB had the
ability to provide 2.0 masks per person serviced by the DHB. In contrast, associated with the lowest
percentage (12%) of residents aged 65-years and older, CMDHB had the ability to supply 0.2 masks per
person serviced by the DHB at the time stock was taken.
20 WORKING PAPER 2020/12 | MCGUINNESS INSTITUTE(iv) Rural Population
Figure 14: Masks per person by the percentage of the DHB’s population living in rural areas
Rural [[Figure 14]]
14
BOPDHB
12
10
Average masks per person
8
6
MDHB CDHB
4 NMDHB
SCDHB WDHB
Waitematā DHB
WRDHB SDHB
WCDHB Waikato DHB
2 Lakes DHB HBDHB CMDHB
CCDHB
NDHB
HVDHB
TDHB
0
49 43.4 3 0.6 25.3 24 23.9 20.7 20.5 20.1 19.7 19.5 18.4 14 13 6.9 6.3 2.1 0.9
% of the DHB's population living in rural areas
• Associated with the highest percentage (49%) of residents living in rural areas, NDHB had the ability
to supply 0.8 masks per person serviced by the DHB. In contrast, associated with the lowest percentage
(1%) of residents living in rural areas, CCDHB had the ability to supply 0.2 masks per person serviced
by the DHB at the time stock was taken.
WORKING PAPER 2020/12 | MCGUINNESS INSTITUTE 216.0 Observations
6.1 Summary
The research process as a whole has indicated weaknesses associated with PPE systems within DHBs across
New Zealand. This process has been difficult; namely due to the time it took for DHBs to respond (in some
cases, up to six months) and DHBs being responsible for their own PPE procurement. These difficulties
(alongside others) associated with the data collection process expresses that not all DHBs have:
a. effective processes in place to be able to easily identify their inventory (especially in times of high demand);
b. certainty over who is responsible for reporting stock levels (and possibly procurement); and who is to be
held accountable when stocks are not maintained regularly .
Analysis regarding the range and volume of stocks has also indicated that a lack of a consistent product code
exists for PPE across all DHBs (including certain items that also form part of the national reserve supply).
This suggests there has been no central direction provided to DHBs, as PPE stock levels do not appear to be
controlled or monitored. This has been indicated both by:
(i) the time taken for some responses; and
(ii) the large variance of the amounts of stock between DHBs (even for those of similar sizes).
This means that the MOH cannot easily identify PPE shortages and plan effectively. The Institute’s opinion
is that the lack of central direction represents a failure of risk management.
The experienced weaknesses within New Zealand’s PPE protocols and procurement systems places emphasis
on how poor risk management (especially in the face of large-scale, uncertain, and complex public health
events) has the potential derail a country (e.g. USA’s COVID-19 response). It is dangerous when issues
associated with systems responsible for risk management only present themselves in response to shocks. The
lack of central oversight highlights that DHBs across New Zealand were not ready to deal with COVID-19.
This draws attention to the effectiveness of other risk management systems that exist in New Zealand that
may also be outdated and unprepared to deal with other types of emergencies. How can New Zealand ensure
that our systems are robust and able to deal with shocks without finding out the hard way?
6.2 Three major suggestions for consideration
In light of the discrepancies that this research has indicated, the Institute would like to make the following
suggestions:
1. PPE procurement and protocol should have a standardised product code across all DHBs. This would
enable consistent and confident communication of PPE levels between the MOH and DHBs, ensuring
that supply shortages are identified before they become an issue. Create a standardised product code
system to go with this that will ensure PPE across different DHBs is the same.
2. Establish a real-time PPE stock reporting system that is publicly accessible. This would ideally be run by
a central organisation (such as the MOH or a health coordination body) and would allow for the DHBs
to know exactly how much they have and whether they need to restock.
3. Put in place a minimum level of stock of pandemic PPE per capita and ensure each DHB can meet these
requirements.
What is clear is that DHBs are required to collect stock level data for accounting and governance purposes
and a simple systemised system could be put in place that is accurate, meaningful and timely. The Institute
hopes that such a system as outlined in this working paper could easily be designed, implemented and made
available to the those working in the healthcare system as well as members of the general public. It could also
be easily audited so that there is complete trust in the stock the country holds going forward.
22 WORKING PAPER 2020/12 | MCGUINNESS INSTITUTEAppendix 1: ‘OIA 2020/02: Open Letter to District
Health Boards’
25 March 2020
Open Letter to District Health Boards
National Reserve Supply (NRS) stored by DHBs
Firstly, thank you to each and every DHB staff member throughout New Zealand working hard on the front line
to protect New Zealanders in these uncertain times. We appreciate how busy you are at this time but we believe it
is timely for each of New Zealand’s District Health Boards (DHB) to make public its register of all the medical
items it stores on behalf of the National Reserve Supply (NRS). Making the extent of the NRS available to the
public will enable New Zealand to use the opportunity that the COVID–19 Alert 4 provides. This window will
enable New Zealand to:
1. know what medical items need to be rationed early and/or substituted;
2. fill supply gaps (e.g. Hamilton-based brewery Good George is now producing hand sanitiser); and
3. order medical items from other countries (e.g. Australia, China or Singapore).
Since late January the McGuinness Institute has been trying to understand what supply chain risks might arise if
the epidemic in China became a pandemic. We have organised these risks into three categories of supply chain
management, those impacting on:
1. healthcare workers, enabling them to stay safe while treating patients (e.g. personal protective
equipment [PPE]);
2. patients, enabling them to get the best medical care (e.g. ventilators); and
3. the wider population, differentiating between people that are infected and not infected (e.g. testing equipment).
We are working with a diverse number of people on this issue who would like to know this information, such as
philanthropists, manufacturers, procurement officers, doctors and nurses. To this end we are asking all DHBs to
share with us, and ideally place on their websites, the following information as applicable on the items listed
below: the locations (e.g. hospital name), quantities, brand names, number of uses (i.e. are they disposable or
reusable?), purchase dates and expiry dates:
1. Gowns
2. Masks
3. Goggles
4. Gloves
5. Disinfectant (e.g. bleach)*
6. Hand sanitiser*
7. Oxygen tanks*
8. CT scanners*
9. Medical ventilators*
The items asterisked above are ones for which we understand the information might need to be sought from
hospitals in your district. For this reason, we thought a two batch approach to supplying this information might be
realistic, Batch 1 being the PPEs (1–4 above) and Batch 2 (5–9).
We are confident the lockdown will prevent the escalation of COVID–19 cases, but New Zealand needs to be prepared
for the possibility that the lockdown and the quarantine of arrivals were actioned too late. The Institute explores low
probability/high magnitude events, and as such, we believe DHBs hold critical information that should be made public
to enable any supply chain gaps (if they exist) to be filled.
Please do not hesitate to contact me if you have any further questions or comments.
Ngā mihi,
Wendy McGuinness
Chief Executive
WORKING PAPER 2020/12 | MCGUINNESS INSTITUTE 23Appendix 2: DHB research data (medical items required for pandemics held by district health boards) Appendix 2 includes quantifiable data received from DHBs regarding stock levels of a range of medical items required for pandemics held in their respective stores. 24 WORKING PAPER 2020/12 | MCGUINNESS INSTITUTE
Appendix   3: Graph
      Days taken        of masks
                 to respond          perOIA
                            to the initial person
                                             and howbythat
                                                        DHB    over
                                                           effects
the timemasks
         it took   DHBsfor
               per person  toeach
                               respond
                                   DHB's respective population
                                                [[Appendix 3]]
                    14
                                BOPDHB                                       MDHB
                    12                                                               TDHB
                    10                                                               Lakes DHB
 Masks per person

                                                                                      Waitematā DHB
                    8
                                                                                       CMDHB
                    6                                                                            NDHB
                                                                                       WRDHB
                    4                                WCDHB                                            SCDHB
                                 NMDHB     WDHB                                            HBDHB
                    2                              CDHB                                        Waikato DHB
                                                SDHB                                        CCDHB        HVDHB
                    0
                    -2 0   20   40       60        80        100       120          140       160      180     200
                                         Days by the DHBs to respond to the initial

Appendix 3 shows that there is a strong negative relationship between masks per person and the amount of
time it took for the DHBs to respond to our OIA. This indicates that, over time, the number of masks per
person diminishes, implying little restocking was undertaken by DHBs.

                                     WORKING PAPER 2020/12 | MCGUINNESS INSTITUTE                                25
Appendix 4: Analysis of PPE volumes with respect to
DHB staff and DHB populations
Table 4.1: Stock by DHB Staff
(Source: MOH, 2017b)
Number of Total Stock Stock per staff member
staff
DHB EMPLOYED Total Masks Total Total Total Total Total Total Total
FTE (N95, P2, Gloves Goggles Gowns Masks Gloves Goggles Gowns
as at Procedure, (Latex, per per per per
31-Mar-17 or Nitrile) employee employee employee employee
equivialent)
Auckland 3345 NA NA NA NA NA NA NA NA
District
Health
Board
(ADHB)*
Bay of 1178 2963250 14795400 133443 1901345 2515 12559 113 1614
Plenty
District
Health
Board
(BOPDHB)
Canterbury 3358 1044843 2144459 19389 54312 311 639 6 16
District
Health
Board
(CDHB)
Capital & 1976 68322 377850 25797 74455 35 191 13 38
Coast
District
Health
Board
(CCDHB)
Counties 2574 90255 NA NA NA 35 NA NA NA
Manukau
District
Health
Board
(CMDHB)*
Hawkes 910 292650 853800 20427 84875 322 938 22 93
Bay District
Health
Board
(HBDHB)
Hutt Valley 760 57645 104000 20802 35460 76 137 27 47
District
Health
Board
(HVDHB)
Lakes 517 183960 843770 49008 60860 356 1632 95 118
District
Health
Board
Mid Central 965 503775 7481 4675 41761 522 7 5 43
District
Health
Board
(MDHB)
Nelson- 616 504450 621500 104 10680 819 1009 0.68 17
Marlborough
District
Health
Board
(NMDHB)
26 WORKING PAPER 2020/12 | MCGUINNESS INSTITUTENumber of Total Stock Stock per staff member
staff
DHB EMPLOYED Total Masks Total Total Total Total Total Total Total
FTE (N95, P2, Gloves Goggles Gowns Masks Gloves Goggles Gowns
as at Procedure, (Latex, per per per per
31-Mar-17 or Nitrile) employee employee employee employee
equivialent)
Northland 950 146120 556,312 300 33047 154 586 0 35
District
Health
Board
(NDHB)
South 306 120924 835100 7130 NA 395 2729 23 NA
Canterbury
District
Health
Board
(SCDHB)
Southern 1578 376570 NA NA NA 239 NA NA NA
District
Health
Board
(SDHB)*
Tairāwhiti 273 NA NA NA NA NA NA NA NA
District
Health
Board
(TDH)*
Taranaki 612 4974 971600 650 15655 8 1588 1 26
District
Health
Board
(TDHB)
Waikato 2465 278943 1317500 31360 40335 113 534 13 16
District
Health
Board
Wairarapa 241 107970 83900 12647 10820 448 348 52 45
District
Health
Board
(WRDHB)
Waitematā 2664 345410 NA NA NA 130 NA NA NA
District
Health
Board*
West Coast 305 64607 132601 1199 3358 212 435 4 11
District
Health
Board
(WCDHB)
Whanganui 384 207970 792 7179 4956 542 2 boxes 19 12.9
District (boxes)
Health
Board
(WDHB)
Note: NA - Not available
WORKING PAPER 2020/12 | MCGUINNESS INSTITUTE 27Table 4.2: Stock by DHBs population
(Source: Simpson, 2020)
Breakdown of populations of the DHBs (Based off of the Total Stock
numbers in Figure 2)
Total % Share % Share % Share % Share Total Total Total Total
Popu- in high Māori over 65 in rural Masks Gloves Goggles Gowns
lation depri- areas (N95, (Latex,
vation P2, Nitrile)
areas Proce-
dure, or
equiv-
ialent)
Auckland 531201 18.3 8 11 0.2 NA NA NA NA
District Health
Board (ADHB)*
Bay of Plenty 234355 24.9 24.9 19.4 19.7 2963250 14795400 133443 1901345
District Health
Board (BOPDHB)
Canterbury 557137 9.4 9 15.6 14 1044843 2144459 19389 54312
District Health
Board (CDHB)
Capital & Coast 314662 12.3 11.4 13.1 0.9 68322 377850 25797 74455
District Health
Board (CCDHB)
Counties 552203 35.9 15.7 11.5 6.9 90255 NA NA NA
Manukau
District Health
Board (CMDHB)*
Hawkes Bay 164608 27.7 25.8 18.5 13 292650 853800 20427 84875
District Health
Board (HBDHB)
Hutt Valley 148581 19.8 17.3 14.6 2.1 57645 104000 20802 35460
District
Health
Board (HVDHB)
Lakes District 109230 34.3 34.6 15.9 20.5 183960 843770 49008 60860
Health Board
Mid Central 177403 25.8 19.9 17.6 18.4 503775 7481 4675 41761
District Health
Board (MDHB)
Nelson- 149549 8.9 10.4 21.3 20.7 504450 621500 104 10680
Marlborough
District Health
Board (NMDHB)
Northland 176954 37.7 33.7 19.5 49 146120 556,312 300 33047
District Health
Board (NDHB)
South 59804 9.4 8.5 22 30.6 120924 835100 7130 NA
Canterbury
District Health
Board (SCDHB)
28 WORKING PAPER 2020/12 | MCGUINNESS INSTITUTEStock per person
Ventilators CT Oxygen Masks Gloves Goggles Gowns Ventilators CT Oxygen
Scanners tanks per per per per per person Scanners tanks per
person person person person per person
person
NA NA NA NA NA NA NA NA NA NA
47 3 297 13 63 1 8 0 0 0
43 6 4 2 4 0 0 0 0 0
28 2 2 Bulk with 0 1 0 0 0 0 0
a stock of
portable
oxygen
cylinders
NA NA NA 0 NA NA NA NA NA NA
17 + 7 due 1 347 x A 2 5 0 1 0 0 0
size, 14 x
D2 size, 3
x Manpaks
(15 x G size
each) (406
Total)
7 1 1 Bulk with 0 1 0 0 0 0 0
a stock of
portable
oxygen
cylinders
6 1 1 Bulk 2 8 0 1 0 0 0
8 1 45 x A size 3 0 0 0 0 0 0
oxygen,
10 D size
oxygen, 8
x Entonox
A size, 4x
entonox
D size, 5 x
medical Air
(72 total)
24 2 NA 3 4 0 0 0 0 NA
12 2 1 1 3 0 0 0 0 0
Table 4.2:12Stock by DHBs
1 population
1 Bulk with 2 14 0 NA 0 0 0
a stock of
portable
oxygen
cylinders
WORKING PAPER 2020/12 | MCGUINNESS INSTITUTE 29Breakdown of populations of the DHBs (Based off of the Total Stock
numbers in Figure 2)
Total % Share % Share % Share % Share Total Total Total Total
Popu- in high Māori over 65 in rural Masks Gloves Goggles Gowns
lation depri- areas (N95, (Latex,
vation P2, Nitrile)
areas Proce-
dure, or
equiv-
ialent)
Southern 326275 11.9 10 16.8 23.9 376570 NA NA NA
District Health
Board (SDHB)*
Tairāwhiti 48778 48.1 50.1 15.2 25.2 NA NA NA NA
District Health
Board (TDH)*
Taranaki District 118878 15.4 19.1 17.4 24 4974 971600 650 15655
Health Board
(TDHB)
Waikato District 412924 25.2 22.7 15.6 20.1 278943 1317500 31360 40335
Health Board
Wairarapa 44642 20.4 17.3 21.2 25.3 107970 83900 12647 10820
District Health
Board (WRDHB)
Waitematā 614114 8.2 9.9 13.8 6.3 345410 NA NA NA
District Health
Board*
West Coast 32444 10.4 11.9 18.3 43.4 64607 132601 1199 3358
District Health
Board (WCDHB)
Whanganui 64308 36.6 26.5 19.4 19.5 207970 792 7179 4956
District Health boxes
Board (WDHB)
30 WORKING PAPER 2020/12 | MCGUINNESS INSTITUTEStock per person
Ventilators CT Oxygen Masks Gloves Goggles Gowns Ventilators CT Oxygen
Scanners tanks per per per per per person Scanners tanks per
person person person person per person
person
NA NA NA 1 NA NA NA NA NA NA
NA NA NA NA NA NA NA NA NA NA
NA NA NA 0 8 0 0 NA NA NA
69 3 397 1 3 0 0 0 0 0
2 + 2 due 1 1 large 2 2 0 0 0 0 0
November tank, 40
2020 smaller
reserve
tanks,
variable
stock of
transport-
able tanks
NA NA NA 1 NA NA NA NA NA NA
5 1 25 2 4 0 0 0 0 0
4 1 1 3 0 boxes 0 0 0 0 0
Note: NA - Not Available
WORKING PAPER 2020/12 | MCGUINNESS INSTITUTE 31Appendix 5: Graphs relating to mask analysis by
demographic
(Source: Simpson, 2020)
Note: As mentioned earlier, WCDHB provided their response with CDHB as total PPE stocked between
them. For this analysis we divided the total number of masks proportionately between them in order to
make the data shown in the graphs more accurate
Graph 5.1: Percentage of the DHBs population living in high deprivation areas
High Deprivation [[Graph 5.1]]
14
BOPDHB
12
10
Masks per person
NMDHB
8
SCDHB
6 CDHB WDHB
4 WCDHB
WRDHB MDHB
SDHB
2 HBDHB Lakes DHB
TDHB
Waitematā DHB Waikato DHB NDHB
0 CCDHB HVDHB CMDHB
0% 5% 10% 15% 20% 25% 30% 35% 4 0%
Percentage of the DHBs population living in high deprivation areas
As seen in Graph 5.1, there is almost no trend between the number of masks per person as the percentage of
the population living in high deprivation areas increases.
Graph 5.2: Percentage of the DHBs population that is of Māori descent
Māori [[Graph 5.2]]
14
BOPDHB
12
10
Masks per person
8
WCDHB
6 SDCHB
WRDHB
CDHB MDHB
4
NMDHB HVDHB WDHB
2 SDHB
HBDHB Lakes DHB
Waitematā DHB CMDHB NDHB
TDHB Waikato DHB
0 CCDHB
0% 5% 10% 15% 20% 25% 30% 35% 4 0%
Percentage of the DHBs population that is Māori
Graph 5.2 shows a slight positive trend between the percentage of the population that is Mäori and the number
of masks per person. However, this trend is not significant enough to make assumptions based on this.
32 WORKING PAPER 2020/12 | MCGUINNESS INSTITUTEGraph 5.3: Percentage of the DHBs population that is over 65 years old
Over 65 years old [[Graph 5.3]]
14
BOPDHB
12
10
Masks per person
8 CMDHB
6 Waitematā DHB MDHB
CDHB WDHB
4 HVDHB NMDHB
Lakes DHB
WCDHB WRDHB
2 CCDHB SCDHB
HBDHB
Waikato DHB SDHB
0 TDHB NDHB
0% 5% 10% 15% 20% 25%
-2
Percentage of the DHBs population that is over 65 years old
Graph 5.3 shows a strong positive trend between the percentage of each DHB’s population over 65 years old,
and the number of masks per person. This means that the higher the percentage of the DHB’s population
that is over 65, the more masks will be available to the people within that DHB.
Graph 5.4: Percentage of the DHBs population living in rural areas
Rural [[Graph 5.4]]
14
BOPDHB
12
10
Masks per person
8 HBDHB
6 CDHB
CCDHB MDHB
HVDHB WDHB
4
Waitematā DHB NMDHB WRDHB
2 SCDHB WCDHB
Lakes DHB
CMDHB Waikato DHB SDHB NDHB
0 TDHB
0% 10% 20% 30% 4 0% 50% 60%
Percentage of the DHBs population living in rural areas
Graph 5.4 shows a slight positive trend between the percentage of each DHB’s population living in rural
areas and the number of masks per person. However, much like Graph 5.2, this isn’t a significant enough
trend to make assumptions off.
WORKING PAPER 2020/12 | MCGUINNESS INSTITUTE 33You can also read