EPIC Economic Performance Indicators for Cape Town - 2018: Quarter 3 (July - September) - Invest Cape Town
←
→
Page content transcription
If your browser does not render page correctly, please read the page content below
EPIC
Economic Performance Indicators for Cape Town

2018: Quarter 3 (July - September)
Introduction
This is the 22nd edition of the EPIC publication, which presents and analyses economic (and
related) trends in Cape Town on a quarterly basis. This edition focuses on the third quarter of
2018, covering the period 1 July to 30 September 2018.

Rationale for a quarterly economic publication
Accurate and up-to-date economic information is critical in providing direction for
economic development and related strategies. It is essential to understand the nature,
composition and performance of the local economy to monitor its status and know what
must be done. While there is a wealth of economic statistics and information available for
Cape Town, it often exists in discrete, isolated parcels customised to serving a specific
purpose at a given time. Furthermore, in most cases, relevant economic information is only
presented on an annual basis. This period is sometimes simply too long to inform immediate
policy decisions or to get a proper grasp of the dynamic nature of economic trends. These
factors underpin the need for a consolidated, quarterly economic performance publication
for the City of Cape Town.

Acknowledgements
The EPIC quarterly publication is a product of the Organisational Policy and Planning
Department of the City of Cape Town. The publication is authored, consolidated and edited
by the Economic Research Unit within the City’s Research Branch, Department of
Organisational Policy and Planning.

Produced by the Economic Research Unit

Manager: Research                            Head: Economic Research
Carol Wright                                 Paul Court

Editor-in-chief                              Project managers and authors
Paul Court                                   Dilshaad Gallie
                                             Monique Petersen
Authors
Layarn Booley
Namhla Malgas
Nicole Londt
Meagan Jooste Upadhyaya

Email: economic.research@capetown.gov.za

Online     access:       http://www.capetown.gov.za/work%20and%20business/doing-business-in-the-
city/business-support-and-guidance/economic-reports/Economic%20resources%20and%20publications

Additional sources of information:
City of Cape Town, Transport Development Authority: Suzelle Williams, Marius Crous and
Lizanne Ryneveldt
City of Cape Town, Water & Sanitation: Cheryl Kessler
Cape Town Tourism: Roxanne Lombard and Nolubabalo Manona
Wesgro: Latecia Philips

                                                                                               i
Contents
Introduction ................................................................................................................................................... i
Acknowledgements .................................................................................................................................... i
1. Economic Growth .............................................................................................................................. 3
a. Quarter-on-quarter GDP-R growth rate .................................................................................... 3
b. Sectoral drivers of economic growth in the Western Cape ................................................. 4
2. Inflation ................................................................................................................................................ 5
a. Inflation overview........................................................................................................................... 5
b. Geographical inflation ................................................................................................................. 6
3. Labour Market .................................................................................................................................... 7
a. Cape Town’s labour market performance .............................................................................. 7
b. Employment comparison of metros ........................................................................................... 7
c. Unemployment in Cape Town .................................................................................................... 8
d. Sector employment trends for Cape Town .............................................................................. 9
4. Infrastructure ..................................................................................................................................... 10
a. Container handling ..................................................................................................................... 10
b. Airport statistics ............................................................................................................................. 11
c. Water.............................................................................................................................................. 12
5. Tourism ................................................................................................................................................ 13
6. Additional Indicators ....................................................................................................................... 15
a. Building developments ............................................................................................................... 15
b. Commercial property developments...................................................................................... 16
c. New vehicle sales ........................................................................................................................ 17
Reference List ............................................................................................................................................ 18
Abbreviations ............................................................................................................................................ 19
List of tables
Table 1: Official (strict) versus expanded (broad) unemployment rates ........................................ 9
Table 2: Income derived from tourist accommodation, Quarter 3, 2017 versus Quarter 3, 2018
..................................................................................................................................................................... 13
List of figures
Figure 1: Real GGP growth for the Western Cape, Quarter 1, 2008 to Quarter 3, 2018 ............... 3
Figure 2: Sectoral real GDP-R growth rates in the Western Cape, Quarter 3, 2018 ...................... 4
Figure 3: CPI and PPI trends for South Africa, January 2013 to September 2018 .......................... 6
Figure 4: CPI inflation rate at a provincial level, July to September 2018 ....................................... 6
Figure 5: Employment comparison with other metros, Quarter 2, 2018 versus Quarter 3, 2018 . 8
Figure 6: Quarterly and annual change in employment per sector for Cape Town, Quarter 3,
2018 ............................................................................................................................................................... 9
Figure 7: Total containers handled (TEUs), January 2014 to September 2018 .............................. 10
Figure 8: Total passenger movements at South Africa’s major airports, January 2014 to
September 2018 ....................................................................................................................................... 11
Figure 9: Daily average water production (7 day average) in Cape Town ................................ 12
Figure 10: Potable water consumption by use category (2017/2018) .......................................... 13
Figure 11: Total visits to the top 5 tourist destinations of Cape Town, Quarter 1, 2013 to Quarter
3, 2018 ......................................................................................................................................................... 14
Figure 12: Building plans submitted to the City of Cape Town, 2012-2018 ................................... 15
Figure 13: Office/banking space sector developments, January 2016 to September 2018 .... 16
iiCAPE TOWN OVERVIEW – 2018 Q3
Cape Town gross geographic product &
employment contributions to SA, 2017e
100%
42.3%
75% 48.0%
2.0%
50% 1.7% 10.0%
7.7%
13.1% 15.3%
25%
7.5% 7.0%
8.3% 9.7%
Of South Africa’s R3 150 995 million gross
domestic product (GDP) generated in the third 9.6% 9.6%
quarter of 2018, the Western Cape accounted 0%
for R432 924 million. Whilst GDP data is not Employment GDP
available at the city-level on a quarterly basis, (formal + informal) (current prices)
annually, Cape Town typically contributes Cape Town eThekwini Ekurhuleni
a
around 71% of the provincial GDP. Johannesburg Nelson Mandela Bay Tshwane
Mangaung Buffalo City Rest of SA
During the third quarter of 2018, the Western
Cape had a quarter-on-quarter GDP growth rate Cape Town gross value added (GVA) versus
of 2,0%, compared to a national growth rate of national GVA, 2017f
b
2,2%.
Agriculture 2.6%
1.0% SA GVA
In 2017, South Africa had a GDP per capita, of Mining 8.0% Cape Town GVA
R82 262, while the Western Cape’s GDP per 0.2%
13.2%
capita was R97 983 and Cape Town’s was Manufacturing 14.4%
c
R106 839. Electricity 3.7%
2.1%
Construction 3.9%
4.7%
Trade 15.0%
17.9%
9.9%
4,9% 5,6% Transport 11.9%
Finance 20.2%
29.7%
Community services 23.5%
At the end of the third quarter of 2018, South 18.2%
Africa had a lower rate of inflation of 4,9%, than 0% 10% 20% 30% 40%
d
the Western Cape which had a rate of 5,6%.
South Africa has 56 521 948
people: 6 510 312 (11,4%) live in
the Western Cape and, of those, In the third quarter of 2018, tourists and residents made 1 831 298
4 174 510 are resident in Cape visits to Cape Town’s five major attractions.
i
g
Town.
Of the 9 578 187 passenger movements
In 2017 South Africa had a Gini through South Africa’s three international
coefficient of 0,63, while Cape j
airports during the third quarter of 2018,
Town had a slightly lower value 2 578 380 were through Cape Town
h
of 0,61. International Airport.
k
a,b. At constant 2010 prices. Source: Quantec, 2018. h. Source: IHS Markit, 2018.
c,f. At current prices. Source: IHS Markit, 2018. i. Source: Cape Town Tourism and Wesgro, 2018.
d, g. Source: Statistics South Africa (StatsSA), 2018. j. Cape Town, OR Tambo and King Shaka.
e. GGP at current prices. Source: IHS Markit, 2018. k. Source: ACSA, 2018.
1
EPIC Economic Performance Indicators for Cape Town 2018 Quarter 3LABOUR OVERVIEW – 2018 Q3
The Working-Age working-age population The Strictly Unemployed
Population is all persons includes only people
aged 15-64 years old. who are actively
labour force seeking work (i.e.
‘searching
unemployed’).
The Labour Force comprises employed
all persons who are
employed plus The Broadly
searching Unemployed includes
unemployed.
unemployed the ‘searching
non-searching unemployed’ as well as
unemployed ‘discouraged’ and
The Employed are those ‘other non-searching’
who, during a reference job seekers.
week, did any work for at
least 1 hour or had a job or A ‘discouraged job seeker’ is a person who was not employed during the
business (even if reference period, was available, but did not take active steps to find work
temporarily absent). during the last 4 weeks.
South Africa Cape Town
2018 Quarter 3
Recorded Q-on-Q Y-on-Y Recorded Q-on-Q Y-on-Y
Working-age population 37 985 153 611 2 912 14 55
Labour Force 22 589 219 187 2 035 -4 23
Employed: total 16 380 92 188 1 606 1 61
(thousands, ‘000’s)
Employed: Formal sector 11 255 -65 -125 1 319 20 46
Number
Employed: Informal sector 3 017 188 327 179 -5 3
Unemployed 6 209 127 -1 429 -5 -38
Not economically active 15 395 -66 424 878 18 32
Discouraged work-seekers 2 733 -131 297 17 3 -2
Other not economically active 12 662 65 127 860 14 34
Official/strict unemployment 27,5 0,3 -0,2 21,1 -0,2 -2,1
(percentage, %)
Broad/expanded Unemployment 37,3 0,1 0,5 22,9 0,3 -2,1
Rate
Absorption 43,1 – 0.0 -0,2 55,1 -0,3 1,0
Labour Force Participation 59,5 0,4 -0,4 69,9 -0,4 -0,5
increase decrease improvement deterioration – No change (due to rounding)
Source: Statistics South Africa, Quarterly Labour Force Survey, 2018 Quarter 3, October 2018.
Note:
- A ‘quarter-on-quarter’ comparison is between the current quarter and the previous quarter (for example: Quarter 3, 2018 versus Quarter
2, 2018).
- A ‘year-on-year’ comparison is between the same quarters in two consecutive years (for example: Quarter3, 2018 versus Quarter 3,
2017).
2
EPIC | Economic Performance Indicators for Cape Town | 2018: Quarter 31. Economic Growth
a. Quarter-on-quarter GDP-R growth rate
The Western Cape economy contributes around 14% of South Africa’s gross domestic
product (GDP). The province’s economic performance is strongly related to the country’s
economic performance and, in line with the growth of the national economy (by 2,2%) in the
third quarter, the Western Cape economy grew by 2%, improving by a significant 4,1
percentage points on the previous quarter’s growth rate of -2,1% 1. This meant that the
province exited its technical recession (two consecutive quarters of negative quarter-on-
quarter economic growth). As with growth at a national level, the recovery of the third
quarter was driven by the manufacturing and finance 2 sectors which grew by 7,3% and 2,2%
quarter-on-quarter, respectively. However, unlike growth at the national level, the Western
Cape’s agricultural sector recorded another substantial contraction of -32,2% quarter-on-
quarter, with the sector likely still experiencing the impact of the drought and the resultant
strain on water resources. As figure 1 shows, on a year-on-year basis, the province’s economy
contracted by 0,1% in the third quarter of 2018, its second consecutive year-on-year
contraction. This is indicative of the cumulative effects of a number of previous quarters of
weak economic growth.
While GDP-R statistics for Cape Town are not available on a quarterly basis, the performance
of the metropolitan municipality’s economy can be expected to typically mirror that of the
provincial economy. This is because the city contributes around 71% of the provincial
economic output (IHS Markit, 2018). On average, in the last 10 years, the variation of the
city’s GGP growth rate from the provincial rate has been 0,2 of a percentage point. If this
were to hold true for the third quarter of 2018, a plausible range for Cape Town’s quarter-on-
quarter economic growth is between 1,8% and 2,2%. However, the sizeable impact of the
agricultural sector’s contraction on the provincial growth rate in the third quarter, means that
this growth range may not be applicable for Cape Town in this particular quarter – this is
discussed further toward the end of the chapter.
Figure 1: Real GGP growth for the Western Cape, Quarter 1, 2008 to Quarter 3, 2018
Quarter-on-quarter Year-on-year percentage
6
4
2
0
2008q1
2008q2
2008q3
2008q4
2009q1
2009q2
2009q3
2009q4
2010q1
2010q2
2010q3
2010q4
2011q1
2011q2
2011q3
2011q4
2012q1
2012q2
2012q3
2012q4
2013q1
2013q2
2013q3
2013q4
2014q1
2014q2
2014q3
2014q4
2015q1
2015q2
2015q3
2015q4
2016q1
2016q2
2016q3
2016q4
2017q1
2017q2
2017q3
2017q4
2018q1
2018q2
2018q3
-2
-4
-6
Source: Quantec, December 2018.
1 Quarterly GDP growth for the second quarter of 2018 has been revised from -2,3% to -2,1% (Quantec,
2018).
2 Quarterly GDP growth for the finance sector in the Western Cape for the second quarter of 2018 has
been revised from 1,9 to 1,8 (Quantec, 2018).
3
EPIC | Economic Performance Indicators for Cape Town | 2018: Quarter 3b. Sectoral drivers of economic growth in the Western Cape
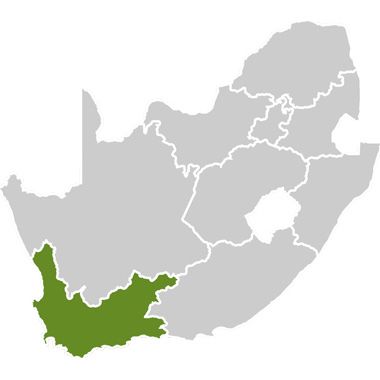
The Western Cape economy’s recovery in the third quarter of 2018 is characterised by mixed
performances across its sectors. The most prominent contributors to the Western Cape’s total
gross value added (GVA) in the third quarter of 2018 were the finance (31,3%), trade (16,1%)
and manufacturing (15,2%) sectors (Quantec, 2018). Six sectors contributed positively to the
province’s quarterly economic growth rate; the manufacturing sector contributed 1,10
percentage points to GVA growth, followed by finance with 0,72, transport with 0,60 and
trade with 0,56 of a percentage point. The agricultural sector, despite constituting a relatively
small share of the Western Cape’s total GVA (2,9%), was the largest negative contributor to
growth in the third quarter, reducing growth by 1,21 percentage points alone. The next
largest reduction in economic growth came from the construction sector which reduced
growth by 0,13 of a percentage point.
The scale of the decline in the agricultural sector in the Western Cape (-32,2%) - following
large contractions in the previous two quarters - points to the severe cumulative impact that
years of below average rainfall have had on agricultural production. The mining sector
experienced the next largest contraction (-11,7%), whilst the construction sector slipped back
into negative growth (from 2% in the previous quarter to -2,8%). Both the transport and trade
sectors - which are amongst the province’s largest contributors to GVA - recorded positive
growth in the third quarter (5,7% and 3,4%, respectively), improving by 10,6 and 4,7
percentage points, respectively. Encouragingly, the Western Cape’s largest sector, the
finance and business services sector, continued its trend of improvement on the previous
quarter’s performance to grow at 2,2% in the third quarter, up by 0,4 of a percentage point.
Similar sectoral growth rates can be expected for Cape Town, as the city is the major
contributor to most economic sectors in the province. In particular, it comprises 82% of the
Western Cape’s finance and business services, 77% of its transport, 72% of its wholesale and
retail trade, 68% of its manufacturing, and 62% of its construction sectors (IHS Markit, 2018). As
such, the city is likely to have experienced very similar growth rates to those at a provincial
level in these sectors in the third quarter of 2018.
Figure 2: Sectoral real GDP-R growth rates in the Western Cape, Quarter 3, 2018
quarter-on-quarter % change percentage
Agriculture, forestry and fishing -32.2
Mining and quarrying -11.7
Manufacturing 7.3
Electricity and water -0.5
Construction -2.8
Wholesale & retail trade; hotels & restaurants 3.4
Transport and communication 5.7
Finance, real estate and business services 2.2
Community, social and other personal services 0.6
General government services 1.5
-40 -30 -20 -10 0 10
Source: Quantec, December 2018.
In contrast to Cape Town’s contribution to the tertiary sector output of the province, its’
contribution to the province’s total primary sector GGP is only 19% (IHS Markit, 2018). Thus, it is
4
EPIC | Economic Performance Indicators for Cape Town | 2018: Quarter 3difficult to make inferences about the performance of the city’s primary sector based on
primary sector GGP growth in the Western Cape. However, even if Cape Town’s primary
sector (agriculture, in particular) did mirror provincial trends, it is unlikely that this would have
had a large impact on the overall growth rate of the city, as the primary sector contributes
only 1% to Cape Town’s total GGP. Rather, the performance of the city’s economy in the
third quarter of 2018 would have been driven by the performance of the finance, trade,
manufacturing and transport sectors, which, in 2017, comprised 30%, 18%, 14% and 12% of
the city’s economy, respectively. Given that the agricultural sector weighed so heavily on
economic growth at a provincial level in the third quarter, there is strong reason to believe
that Cape Town would have performed slightly better than the provincial economy during
this period.
2. Inflation
Price fluctuations of goods and services in an economy are measured by the consumer price
index (CPI) inflation rate and producer price index (PPI) inflation rate. The CPI measures the
change in the cost of living for households and the PPI measures the change in the cost of
production.
a. Inflation overview
In the third quarter of 2018, the CPI increased in comparison to the second quarter of 2018.
As illustrated in figure 3, the CPI recording for July was 5,1%, decreasing slightly to 4,9% in
August and remaining unchanged (at 4,9%) in September 2018. Although headline inflation
increased compared to the end of the second quarter, it remained below the upper inflation
target range. According to Statistics South Africa (2018), the main contributors to the
increase in the CPI include housing and utilities, and transport, of which the latter was mainly
driven by public transport. According to the Monetary Policy Committee (MPC) statement of
September 2018 (South African Reserve Bank [SARB], 2018), the impact of the 1 percentage
point increase in value added tax (VAT) in April remains muted and the higher headline
inflation is a result of a weaker rand exchange rate, with the rand depreciating by 7,3%
against the US dollar (USD) since July 2018, and higher international oil prices.
Similar to the movement of CPI, the PPI increased when compared to the end of the second
quarter of 2018, increasing from 5,9% in June 2018 to 6,1% in July. It continued to rise to 6,3% in
August but decreased slightly to 6,2% in September. The main inflationary contributors to PPI
throughout the third quarter of 2018 (in terms of final manufactured products) were the
prices of coke, petroleum, chemical, rubber and plastic products; as well as food products,
beverages and tobacco products in August, which was driven by an increase in the food
category.
Figure 3 also illustrates changes in the repurchase rate (repo rate). As indicated in the graph,
the repo rate was reduced in March 2018 and remained unchanged (at 6,5%) throughout
the second and third quarter. There was however significant pressure to increase the rate at
the September meeting of the MPC, with three members (out of the seven) being in favour
of an increase of 25 basis points (SARB, 2018). This is indicative of the MPCs concerns about
the “deteriorating inflation outlook” and increased related risks and uncertainties.
5
EPIC | Economic Performance Indicators for Cape Town | 2018: Quarter 3Figure 3: CPI and PPI trends for South Africa, January 2013 to September 2018
Repo Rate CPI PPI Reserve Bank inflation target range Percentage
10
9
8
7
6
5
4
3
2
1
0
Q1 Q2 Q3 Q4 Q1 Q2 Q3 Q4 Q1 Q2 Q3 Q4 Q1 Q2 Q3 Q4 Q1 Q2 Q3 Q4 Q1 Q2 Q3
2013 2014 2015 2016 2017 2018
Source: CPI and PPI extracted from Statistics South Africa, 2018, and repurchase rate extracted from
SARB, 2018.
b. Geographical inflation
The Western Cape recorded an inflation rate of 5,6% at the end of the third quarter of 2018.
This was higher than its inflation rate at the end of the second quarter of 2018, which was
5,4%. Although remaining within the inflation target range at the end of the quarter, the
provincial inflation rate remained higher than the national rate of 4,9%. Figure 4 illustrates
inflation rates recorded in the third quarter of 2018 across all nine provinces in the country. In
comparison to the end of the second quarter of 2018, eight provinces recorded an increase
in inflation rates by the end of the third quarter of 2018. Free State is the only province that
recorded a lower inflation rate, from 4,6% at the end of the second quarter, to 4,5% at the
end of the third quarter of 2018. The Western Cape once again recorded the highest inflation
rate throughout the third quarter with an average of 5,8%, followed by Gauteng (5,2%), and
the Eastern Cape and Free State at 4,6%, whilst Limpopo recorded the lowest average
inflation rate (4,1%) in the third quarter of 2018.
Figure 4: CPI inflation rate at a provincial level, July to September 2018
July 2018 August 2018 September 2018 Reserve Bank inflation target range Percentage
7%
6%
5%
4%
3%
2%
1%
0%
Western Cape
Northern
Mpumalanga
Gauteng
KwaZulu-Natal
North West
Limpopo
Eastern Cape
Free State
Cape
Source: Statistics South Africa, November 2018.
Food price inflation in the Western Cape was 2,9% in August 2018 and increased slightly to
3,1% in September 2018, whilst nationally it was 2,6% in August 2018, increasing to 2,9% in
6
EPIC | Economic Performance Indicators for Cape Town | 2018: Quarter 3September 2018. Despite the provincial food price inflation once again exceeding that of
the national level, the disparity between the two decreased considerably in the third quarter.
Rather, the higher overall inflation rate at the provincial level for the third quarter of 2018 can
largely be attributed to housing and utilities’ price inflation which was recorded at 7,4% in
September for the Western Cape and 5,2% at the national level. Within this category the
disparity between prices at the provincial and national levels was notably driven by an
increase in electricity and other fuels’ price inflation. Water and other services’ 3 price
inflation in the Western Cape remained high in the third quarter, although declined slightly
from 9,9% in July and August, to 9,8% in September 2018, significantly lower than the inflation
rate in this category at a national level which was 10,9% in September.
Private transport fuel price inflation increased significantly in the third quarter. From recording
16,4% in June 2018, private transport fuel price inflation in the Western Cape increased to
25,9% in July, thereafter declining slightly to 24% in August and 18,8% in September, mirroring
national trends. This is reflective of the continuing increases in fuel prices which amounted to
an additional cumulative 32 cents on the price of petrol in the third quarter of 2018
(Automobile Association of South Africa, 2018). The upward pressure on fuel price inflation
could be attributed to the increasing international oil prices, which peaked at 79,80 USD per
barrel in May 2018 (since 2014), as well as the depreciating rand, as noted by the MPC (SARB,
2018).
3. Labour Market
The labour market is the point at which economic production meets human development.
As such employment creation and unemployment reduction are top priorities for all spheres
of government. Labour market performance is tracked through a variety of indicators, many
of which are reflected on in this section.
a. Cape Town’s labour market performance
In the third quarter of 2018, Cape Town’s working age population (2,9 million) increased on
both a quarter-on-quarter and year-on-year basis. The labour force decreased by 3 777 on a
quarter-on-quarter basis but increased by 22 958 on a year-on-year basis to a total of 2,04
million individuals in the third quarter of 2018. Employment in the third quarter of 2018
increased on both a quarter-on-quarter (1 450) and year-on-year (61 010) basis to record 1,6
million individuals. Encouragingly, this is the ninth consecutive quarter of positive employment
growth. The proportionally larger increase in the working-age population than in
employment in the third quarter of 2018, meant that the labour absorption rate decreased to
55,1% from 55,4% in the second quarter of 2018. The labour force participation rate declined
to 69,9% in the third quarter of 2018 from a previous recording of 70,3% in the second quarter
of 2018.
b. Employment comparison of metros
To measure Cape Town’s job creation performance, a comparison with other metropolitan
municipalities (metros) in the country is helpful. In the third quarter of 2018, Cape Town had
the second largest number of employed people, with 1,6 million people employed in the
city, second only to Johannesburg where 2 million people were employed. This is to be
expected as Johannesburg has a significantly larger population.
3 As defined by Statistics South Africa, this category includes water supply, rates, taxes and levies
(Statistics South Africa, 2017).
7
EPIC | Economic Performance Indicators for Cape Town | 2018: Quarter 3Turning attention to employment trends in the third quarter of 2018, Cape Town was the only
metro that displayed both positive quarter-on-quarter and year-on-year growth (see figure
5). Ekurhuleni added the most jobs (with an increase of 31 787 in employment) whilst
Johannesburg shed the most jobs (with a reduction of 20 388 in employment) when
compared to the previous quarter. On a year-on-year basis, Cape Town had the largest
increase in employment (61 010 jobs) with eThekwini (54 052 jobs) and Johannesburg (48 475)
following closely. Ekurhuleni shed the most jobs (with a reduction of 28 757 in employment)
when compared to the third quarter of 2017. Tshwane and Nelson Mandela Bay reflected
negative year-on-year employment growth.
Figure 5: Employment comparison with other metros, Quarter 2, 2018 versus Quarter 3, 2018
2018:Q2 2018:Q3 Employment
(millions)
2.0
1.5
1.0
0.5
0.0
Cape Town Tshwane Nelson Mandela Johannesburg Ekurhuleni eThekwini
Bay
Source: Statistics South Africa, Quarter Labour Force Survey, 2018 Quarter 3, October 2018.
c. Unemployment in Cape Town
Cape Town experienced a decrease in the number of unemployed people on both a
quarter-on-quarter and year-on-year basis by 5 227 and 38 054 individuals, respectively, in
the third quarter of 2018. This resulted in the strict unemployment rate decreasing by 0,2 of a
percentage point, on a quarter-on-quarter basis, to 21,1%. The youth unemployment rate in
Cape Town, defined as the strict unemployment rate for individuals aged 15 to 24, was
estimated at 44,3% in the third quarter of 2018, having decreased significantly from 49,4% in
the previous quarter, and [also] having decreased from 47,3% in the third quarter of 2017.
While this is below the national rate of 52,9% (decreasing from 53,7% previous quarter), it is
nonetheless markedly high by developing-country standards and continues to pose a key
challenge to economic policymakers in the city.
Whilst traditional comparisons of Cape Town’s unemployment trends with that of South Africa
as a whole are important, it is perhaps more revealing to compare these trends to other
metros that have similar labour market dynamics (see table 1). Ekurhuleni was the only metro
to experience a decline in both its unemployment rates (strict and expanded).
Johannesburg, Nelson Mandela Bay and Tshwane, on the other hand, all experienced
increases in both their unemployment rates. Nelson Mandela Bay had the highest strict and
expanded unemployment rates (36,4% and 36,7%, respectively), while eThekwini had the
lowest strict unemployment rate (18,2%) and Cape Town had the lowest expanded
unemployment rate (22,9%). Notably, table 1 indicates the large differences in the
relationship between strict and expanded unemployment rates in each of the six metros,
with Nelson Mandela Bay recording 0,22 of a percentage point difference between the two
rates of unemployment, whereas eThekwini recorded a 9,28 percentage points difference.
Cape Town continues to record relatively low differences between the two rates of
8
EPIC | Economic Performance Indicators for Cape Town | 2018: Quarter 3unemployment, remaining below 2 percentage points for the past six quarters. This can be
attributed to the city having a relatively small number of discouraged work-seekers in the
metro (second lowest after Nelson Mandela Bay metro).
Table 1: Official (strict) versus expanded (broad) unemployment rates
Official (strict) Expanded (broad)
Metro
2018: Q3 2018: Q2 2017: Q3 2018: Q3 2018: Q2 2017: Q3
Cape Town 21,1 21,3 23,2 22,9 22,6 25,0
eThekwini 18,2 19,3 23,3 27,5 27,2 30,5
Ekurhuleni 30,9 33,4 32,2 35,6 37,4 35,0
Johannesburg 29,2 28,5 29,6 31,5 30,8 31,2
Nelson Mandela Bay 36,4 35,0 36,0 36,7 35,2 36,2
Tshwane 29,4 28,7 27,9 34,9 34,8 31,6
Source: Statistics South Africa, Quarterly Labour Force Survey, 2018 Quarter 3, October 2018.
d. Sector employment trends for Cape Town
Figure 6 presents the change in the level of employment by sector within Cape Town in the
third quarter of 2018. Five sectors made a positive contribution to employment when
compared to the previous quarter, with the highest contributions recorded in the finance,
real estate and business services (32 321), community, social and other personal services
(8 485), as well as transport and communication (5 535) sectors. Trade, hotels and restaurants
(4 267), as well as electricity and water (2 466) sectors were more modest contributors to
employment. The main job-shedding sectors in Cape Town in the third quarter of 2018, as
compared to the previous quarter, were manufacturing (-27 449), private households
(-12 731) and construction (-9 775).
Figure 6: Quarterly and annual change in employment per sector for Cape Town, Quarter 3, 2018
Quarterly change Annual change
Agriculture, forestry and fishing
Mining and quarrying
Manufacturing
Electricity and water
Construction
Trade, hotels and restaurants
Transport and communication
Finance, real estate and business services
Community, social and other personal services
Private households
Other
-40 000 -30 000 -20 000 -10 000 0 10 000 20 000 30 000 40 000
Source: Statistics South Africa, Quarterly Labour Force Survey, 2018 Quarter 3, October 2018.
On a year-on-year basis Cape Town’s labour market displayed a better performance with
the majority of sectors adding positively to employment. Overall, eight sectors added to
employment growth whereas two sectors recorded employment losses when compared to
the third quarter of 2017. Community, social and other personal services (26 256), finance,
9
EPIC | Economic Performance Indicators for Cape Town | 2018: Quarter 3real estate and business services (24 935) as well as trade, hotels and restaurants (20 388)
sectors made the largest contributions to employment. Further positive contributions were
recorded within construction (13 703), agriculture, forestry and fishing (6 884) as well as
private households (4 478) sectors. Minimal positive employment contributions were
experienced within transport and communication, as well as mining and quarrying. Similar to
its quarter-on-quarter performance, the manufacturing sector shed the most jobs (-36 188)
with the electricity and water sector (-2 392) following thereafter.
4. Infrastructure
Cape Town is often promoted as the gateway to South Africa, and to Africa more generally.
This status is sustained by the city’s well-developed transportation infrastructure, with Cape
Town being home to South Africa’s second-busiest airport as well as (historically) its’ second-
busiest container port. This section reviews infrastructure developments in relation to Cape
Town’s port and airport, as well as in terms of water production and consumption, in light of
the drought the Western Cape is facing.
a. Container handling
Container traffic is very seasonal, as figure 7 indicates, thus it is best to compare total
containers handled over the period of a year. The number of containers handled at the Port
of Cape Town decreased from 229 881 in the third quarter of 2017 to 220 947 in the third
quarter of 2018, reflecting a negative growth rate of 3,89%. In the third quarter of 2018, the
Port of Durban was once again the largest container handling port in the country
(comprising 61,27% of all containers handled in South Africa), followed by the Port of Cape
Town (16,90%) and the Port of Ngqura (15,89%). Moreover, the Port of Cape Town managed
to outperform the Port of Ngqura in the third quarter of 2018 and therefore maintained its
position as the second-largest container handling port.
Figure 7: Total containers handled (TEUs), January 2014 to September 2018
TEUs
South Africa Cape Town Ngqura Durban
500 000
450 000
400 000
350 000
300 000
250 000
200 000
150 000
100 000
50 000
0
Q1 Q2 Q3 Q4 Q1 Q2 Q3 Q4 Q1 Q2 Q3 Q4 Q1 Q2 Q3 Q4 Q1 Q2 Q3
2014 2015 2016 2017 2018
Source: Transnet National Ports Authority, November 2018.
The Port of Durban handled 801 017 twenty-foot equivalent units (TEUs) in the third quarter of
2018, recording an increase in container handling of 6,84% compared to the same period in
2017. In contrast the Ports of Cape Town and Ngqura experienced decreases in container
10
EPIC | Economic Performance Indicators for Cape Town | 2018: Quarter 3handling, contributing towards total container handling at a national scale decreasing by
0,15% year-on-year in the third quarter of 2018.
b. Airport statistics
Cape Town International Airport is South Africa’s second-busiest airport, after OR Tambo
International Airport in Johannesburg. It recorded 2,58 million total passenger movements in
the third quarter of 2018 compared to 5,50 million passenger movements at OR Tambo
International and 1,50 million at King Shaka International airports during the same period.
Figure 8 indicates the pronounced degree of seasonality in Cape Town’s air passenger
movements, with these consistently declining in the second quarter when the city enters its
winter months and picking up again towards the fourth quarter with the onset of summer. This
is reflected in the increase experienced during the third quarter of 2018, as compared to the
previous quarter.
Figure 8: Total passenger movements at South Africa’s major airports, January 2014 to September 2018
OR Tambo International Cape Town International King Shaka International Number of
passengers
2 000 000
1 500 000
1 000 000
500 000
0
Q1 Q2 Q3 Q4 Q1 Q2 Q3 Q4 Q1 Q2 Q3 Q4 Q1 Q2 Q3 Q4 Q1 Q2 Q3
2014 2015 2016 2017 2018
Source: Airports Company South Africa, November 2018.
Total passenger movements at Cape Town International in the third quarter of 2018 was
1,12% higher compared to the third quarter of 2017, when 2,55 million passenger movements
were recorded. Despite the relatively low year-on-year growth, this signalled an
improvement following three consecutive quarters of declining year-on-year performance.
OR Tambo International observed a minimal year-on-year increase (0,01%) in total passenger
movements in the third quarter of 2018, whilst King Shaka International saw the highest year-
on-year increase of 5,76%. This included another peak above the 500 000 monthly total
passenger movement mark for the airport in July 2018.
Following dampened tourist activity, in part as a result of the drought, passenger arrivals’
data reflect improvements. Total passenger arrivals at Cape Town International increased by
2,45% in the third quarter of 2018, as compared to the third quarter 2017, with international
arrivals recording a year-on-year increase of 17,45% and domestic arrivals returning to a
positive year-on-year growth rate of 2,40%.
11
EPIC | Economic Performance Indicators for Cape Town | 2018: Quarter 3c. Water
Cape Town recently experienced its worst drought in recorded history. The City of Cape
Town (City/CCT) has, for a number of years, had a range of demand and supply-side
management instruments in place to enable the sustainable provision of water; however, in
light of the severity of the drought and the impact this had on dam levels, a number of these
measures had to be accelerated. The City is now working on determining the best approach
for securing water resilience for the water supply system (CCT, 2018a).
On the demand-side, in the third quarter, the City had a range of water restrictions and tariffs
in place to bring water demand in line with the total water supply target of a maximum of
450 million litres (Ml) per day 4. On a quarter-on-quarter basis water production declined by
0,2% in the third quarter of 2018 relative to the second quarter of 2018. As figure 9 shows,
however, while water production 5 in the city marginally declined, relative to the previous
quarter, it was still above the 450 Ml per day target applicable to this period.
Figure 9: Daily average water production (7 day average) in Cape Town
Target (Megalitres/day) Average Production (Megalitres/day) Production (Ml/day)
1200
1000
800
600
400
200
01-Jul-15
01-Nov-15
01-Sep-15
01-Jul-16
01-Nov-16
01-Sep-16
01-Jul-17
01-Nov-17
01-Jan-15
01-Sep-17
01-Jul-18
01-Oct-15
01-Jan-16
01-Sep-18
01-Feb-15
01-Oct-16
01-Jan-17
01-May-15
01-Oct-17
01-Jan-18
01-Jun-15
01-Feb-16
01-Aug-15
01-May-16
01-Feb-17
01-Dec-15
01-Jun-16
01-Aug-16
01-May-17
01-Jun-17
01-Feb-18
01-Mar-15
01-Apr-15
01-Dec-16
01-Aug-17
01-May-18
01-Mar-16
01-Apr-16
01-Dec-17
01-Jun-18
01-Aug-18
01-Mar-17
01-Apr-17
01-Mar-18
01-Apr-18
Source: Department of Water & Sanitation, CCT, 2018b.
Drinking water consumption in 2017/2018, as illustrated in figure 10, was largely dominated by
domestic 6 and commercial (retail and office spaces) categories, which respectively
accounted for approximately 67,7% and 14,6% of total water consumption. This was followed
by other customer types (6%), City-owned facilities and City departments (5,6%), industry
(4,5%) and government (1,7%) (CCT, 2018b).
4 The maximum water supply target increased to 500 Ml per day on the 1 October 2018, enabled by a
relatively good rain season (CCT, 2018c).
5 Readers are cautioned not to interpret this water production indicator as synonymous with water
consumption in Cape Town, as it includes losses (for example, due to leaks), as well as treated water
provided to external customers like neighbouring municipalities.
6 Which comprises the following categories: houses (51,1%), flats and complexes (9,1%), informal
settlements (5,1%) and domestic other (2,4%).
12
EPIC | Economic Performance Indicators for Cape Town | 2018: Quarter 3Figure 10: Potable water 7 consumption by use category (2017/2018)
2.4% 1.7%
Houses
4.5%
5.1% Retail and Office spaces
5.6% Flats and complexes
Other
6.0%
City-owned facilities and City Departments
51.1%
Informal Settlements
9.1%
Industry
Domestic other
14.6% Government
Source: Department of Water & Sanitation, CCT, 2018b.
5. Tourism
Cape Town is a well-known tourist destination, both locally and internationally, and the
tourism sector is a valuable contributor to the city’s economy. The occupancy and revenue
figures presented in table 2 are derived from a monthly survey 8 of an average of 90 tourism
accommodation establishments in the Cape Town metropolitan area (Cape Town Tourism,
2018). Occupancy rates at city accommodation establishments decreased by an average
of 5,1 percentage points in the third quarter of 2018 compared to the same period in 2017.
The month of September recorded the highest occupancy rate (63,6%) in the third quarter of
2018, but recorded a year-on-year decrease of 5 percentage points when compared to
September 2017. The average room rate decreased by R2, year-on-year, in the third quarter
of 2018 while the revenue per room decreased by R77 over the same period.
Table 2: Income derived from tourist accommodation 9, Quarter 3, 2017 versus Quarter 3, 2018
Third-quarter
July August September
average
Indicator 2018 2017 2018 2017 2018 2017 2018 2017
Occupancy 50,6% 56,0% 56,7% 61,1% 63,6% 68,6% 57,0% 62,1%
rate
Average R 1 452 R 1 501 R 1 542 R 1 521 R 1 572 R 1 000 R1 522 R1 524
room rate
Revenue per R 734 R 840 R 874 R 937 R 1 000 R 1 063 R 869 R 947
room
Source: Derived from Cape Town Tourism data, Selected Accommodation Establishments, November
2018.
7 Water that is of a safe drinking standard.
8 Important to note is that the monthly survey varies every month in both sample size and the specific
respondents.
9 As the sample changes with each monthly survey conducted (see previous footnote 10), the data
applicable to the previous quarter (e.g. occupancy rate of 60,7% for the second quarter of 2017) will
differ from that published in the appropriate past copy of EPIC (i.e. EPIC 2017: Q2 reports an
occupancy rate of 59,2% for the second quarter of 2017).
13
EPIC | Economic Performance Indicators for Cape Town | 2018: Quarter 3Lower occupancy rates could be explained by possible lingering negative perceptions
associated with the water crisis, an increase in the supply of tourism beds in the past year,
slow economic growth and the imposition of a VAT increase, further constraining consumer
spending on luxury activities such as vacations. The occupancy data also shows that one of
the outcomes of the constraints mentioned above was that tourists opted for the less costly
means of traveling, reflected in the high occupancy rate of backpacker accommodation
(64,1%) for the third quarter of 2018.
On a quarter-on-quarter basis, the highest number of tourist visits (43 168) was reflected for
Table Mountain Park: Cape of Good Hope, also reflecting the highest growth rate of 21,04%
when compared to the same quarter of the previous year. Table Mountain Aerial Cableway
observed the highest quarter-on-quarter decline in number of tourist visits (-8 177) and the
highest negative growth rate (-3,63%) when compared to the previous quarter. On a year-
on-years basis, out of the five major Cape Town tourist attractions 10, Kirstenbosch National
Botanical Gardens reflected the highest increase in the number of visitors (24 362) with a
positive growth rate of 13,94%, while Robben Island reflected the highest decline in number
of visitors (-16 080) with a negative growth rate of 20,76% when compared to the previous
year’s third quarter. It is important to note the overall declining trend in the number of visitors
to Robben Island which could be attributed largely to the increasing number of ferry
cancellations over the last three months (August-October). Inconsistency in the weather
conditions has been noted as reasons for cancellations (Maliti, 2018).
Figure 11: Total visits to the top 5 tourist destinations of Cape Town, Quarter 1, 2013 to Quarter 3, 2018
Cape Point Boulders Cableway Kirstenbosch Robben Island Thousand
160
140
120
100
80
60
40
20
0
Q1 Q2 Q3 Q4 Q1 Q2 Q3 Q4 Q1 Q2 Q3 Q4 Q1 Q2 Q3 Q4 Q1 Q2 Q3 Q4 Q1 Q2 Q3
2013 2014 2015 2016 2017 2018
Source: Derived from Wesgro and Cape Town Tourism data, November 2018.
Figure 11 illustrates that Cape Town’s attractions are subject to strong seasonality, with peak
visitor activity occurring in the summer period from November to March. The lowest tourist
visitor numbers are seen during the period May to July, which are Cape Town’s winter
months. Overall, total visits to the five major attractions declined by 0,22% in the third quarter
of 2018 compared to the same period in 2017. This was likely influenced by the same factors
highlighted for the decrease in occupancy rates, i.e. decreased discretionary spending, and
possible lingering negative perceptions of the destination.
10 Includes, Cape of Good Hope, Boulders Beach, Table Mountain Aerial Cableway, Kirstenbosch
National Botanical Gardens and Robben Island; excludes the V&A Waterfront.
14
EPIC | Economic Performance Indicators for Cape Town | 2018: Quarter 36. Additional Indicators
In addition to macroeconomic indicators, administrative data capture specific consumer
trends and provide strong indications of the performance of the local economy. In
particular, building plan statistics and property development are key indicators of the levels
of confidence in the economy, while passenger vehicle sales mirror trends in the business
cycle and are regarded as a leading indicator of GDP growth.
a. Building developments
The economic growth data for the third quarter of 2018 highlights that output at a national
level in the construction industry declined by 2,7% quarter-on-quarter, following a brief uptick
of positive growth in the previous quarter. On a year-on-year basis the sector recorded its fifth
consecutive contraction (-1%) (Quantec, 2018). Mirroring national trends, the Western
Cape’s construction industry contracted by 2,8% quarter-on-quarter and 1% year-on-year in
the third quarter of 2018. After declining by 14 points in the second quarter of 2018, the First
National Bank (FNB)/BER composite Building Confidence Index 11 (BER, 2018) remained
unchanged in the third quarter of 2018 at 29 index points. This has been the index’s lowest
level since the third quarter of 2012. According to the BER, even though the index remained
flat, there were still notable changes in confidence among the sub-sectors, highlighting a
significant drop in non-residential contractors’ business confidence (from 40 to 18), whilst the
business confidence of architects saw a slight improvement (from 40 to 47).
Figure 12: Building plans submitted to the City of Cape Town, 2012-2018
2012 2013 2014 2015 2016 2017 2018 Thousand
9
8.1 8.0 8.0
7.7 7.7 8
7.3 7.5 7.5
7.1 7.2 7.3 7.2
6.9 6.9 6.8 6.9 6.6 6.8 6.9
6.6 6.6 7
6.3 6.3 6.4
6.0 6.0
6
5.2
5
4
3
2
1
0
January-March (Q1) April-June (Q2) July-September (Q3) October-December (Q4)
Source: Transport Development Authority: Business Support Department, CCT, November 2018.
Building plans submitted to the City in the third quarter of 2018 decreased by 9% from the
previous quarter. Figure 12 provides an annual comparison of the number of building plans
submitted in each of the quarters over the past seven years, thereby controlling for seasonal
trends in the building and construction industry. Building plans submitted to the City in the
11The FNB/BER Building Confidence Index captures the percentage of architects, quantity surveyors,
and contractors and manufacturers of building material, who are satisfied with or wary of the prevailing
business conditions.
15
EPIC | Economic Performance Indicators for Cape Town | 2018: Quarter 3third quarter of 2018 decreased by 3,8% compared to the corresponding period in 2017,
declining for the second consecutive quarter in 2018.
b. Commercial property developments
The performance of the commercial property market can be tracked in a number of ways.
An indicative trend analysis is provided in figure 13 by review of the observed variation in the
quarterly office vacancy rate, the total floor area of completed office buildings added to
the office property stock, the total floor area of completed office building alterations and
the quarter-on-quarter percentage change in provincial GVA for the finance and business
services sector. The finance, business and real estate services sector is the largest in Cape
Town and as such property developments in this sector are a useful measure of economic
activity.
In the third quarter of 2018, construction of 62 594m2 of new office or banking space was
reported to have been completed, as well as 8 648 m2 of office or banking space alterations.
In terms of new office or banking space for the third quarter of 2018, a large increase of
293,8% in quarter-on-quarter completions was recorded, partly as a result of the new
development in Sable Park, Century City (16 000 m2); although this completion took place in
the second quarter, its effects [on the new buildings’ completion data] carried through to
the third quarter of 2018 (Jones Lang LaSelle [JLL], 2018).
Figure 13: Office/banking space sector developments, January 2016 to September 2018
Total floor area Percentage
100 000 10%
8%
80 000
6%
60 000
4%
40 000
2%
20 000
0%
0 -2%
Q1 Q2 Q3 Q4 Q1 Q2 Q3 Q4 Q1 Q2 Q3
2016 2017 2018
Total floor area of alterations
5 203 1 294 11 934 5 008 622 1 086 1 672 5 027 3 729 11 782 8 648
of office/bank space
Total floor area of completed
70 67113 04512 951 1 953 7 548 3 629 17 164 2 346 13 36815 89362 594
new office/bank space
Office vacancy rate 7.20% 7.80% 7.60% 7.60% 7.60% 7.30% 6.80% 6.90% 6.90% 7.00% 7.20%
Quarter-on-quarter change in
finance, real estate and 2.5% 3.5% 2.4% 2.6% -0.5% 3.1% 1.9% 2.5% 1.1% 1.8% 2.2%
business services' GDP
Source: Transport Development Authority: Business Support Department, CCT, November 2018;
Quantec, December 2018, Jones Lang LaSelle, September 2018 and South African Property Owners
Association [SAPOA], October 2018.
As figure 13 shows, Cape Town’s office vacancy rate continued to increase, by 0,2
percentage points to 7,20% in the third quarter of 2018, and remains the lowest vacancy rate
across the five largest metropolitan municipalities (SAPOA, 2018). This increase may in part be
16
EPIC | Economic Performance Indicators for Cape Town | 2018: Quarter 3attributable to the office development in Century City which was completed in quarter two
of 2018, continuing to place further upward pressure on the vacancy rate (JLL, 2018).
According to SAPOA (2017), a sustained improvement in the office vacancy rate (i.e. return
to the natural vacancy rate), depends on the long-term strength of key economic drivers
such as economic growth and business confidence. While the finance and business services
sector in the Western Cape reported an increase in quarter-on-quarter GVA growth from
1,8% 12 in the second quarter to 2,2% in the third quarter of 2018, this is still too low to have a
meaningful impact on the office vacancy rate.
c. New vehicle sales
Total vehicle market sales increased in the Western Cape to 14 901 in the third quarter of
2018 from a previous recording of 14 401 in the second quarter of 2018. Year-on-year results
reflect a slight decrease in vehicle sales of 4,97% (779 units) from the 15 680 total vehicles sold
in the corresponding period of 2017. Passenger vehicle sales in the Western Cape (private
consumer segment of the market) increased from 9 144 in the second quarter of 2018 to 9
981 in the third quarter of 2018, whilst the year-on-year results indicate a decrease of 3,78%
(392 passenger vehicles), as compared to the 10 373 vehicles sold in the third quarter of 2017.
On a national level, a year-on-year decrease of 0,26% was observed with a total of 94 249
passenger vehicle sales in the third quarter of 2018, as compared to 94 494 passenger
vehicles sold in the third quarter of 2017. Decreasing passenger vehicle sales in the third
quarter of 2018 may be attributed to a weaker GDP outcome in the short and medium term
that adversely impacted consumers’ purchasing power (Omarjee, 2018).
12 Quarterly GVA growth for the finance and business services sector for the second quarter of 2018 has
been revised from 1,9% to 1,8% (Quantec, 2018).
17
EPIC | Economic Performance Indicators for Cape Town | 2018: Quarter 3Reference List
Airports Company South Africa (ACSA), 2018, Passenger movements.
Bureau for Economic Research (BER), 2018, FNB/BER Building Confidence Index, Quarter 3,
2018.
Cape Town Tourism, 2018a, Accommodation Performance Review and Forecast Report, July
to September 2018.
Cape Town Tourism, 2018b, Highlights and Monthly Dashboards, July to September 2018.
City of Cape Town, 2018a, Water Outlook 2018 Report, Department of Water and Sanitation,
Available:
http://resource.capetown.gov.za/documentcentre/Documents/City%20research%20re
ports%20and%20review/Water%20Outlook%202018%20July%202018.pdf.
City of Cape Town, 2018b, Water production and consumption, September 2013 to
September 2018, Water and Sanitation Department.
City of Cape Town, 2018c, Dam levels continue steady rise as restrictions are lowered, 1
October 2018, http://www.capetown.gov.za/Media-and-
news/Dam%20levels%20continue%20steady%20rise%20as%20restrictions%20are%20lowe
red, [2018, November 19].
City of Cape Town, 2018d, Building developments, January 2011 to September 2018,
Transport Development Authority: Business Support Department.
IHS Markit, 2018, Regional eXplorer.
Jones Lang LaSalle (JLL), 2018, Cape Town City Report, September 2018.
Maliti, S., 2018, Cancellation of ferries causes outrage, Weekend Argus, 18 November,
https://www.iol.co.za/weekend-argus/news/cancellation-of-ferries-causes-outrage-
18157717, [2018, November 19].
National Association of Automobile Manufacturers of South Africa, 2018, New vehicle sales,
March 2008 to September 2018.
Omarjee, L., 2018, New vehicle sales disappoint, expected to remain under pressure, fin24, 3
September, https://www.fin24.com/Economy/new-vehicle-sales-disappoint-expected-
to-remain-under-pressure-20180903, [2018, November 8].
Quantec, 2018, EasyData.
South African Property Owners Association (SAPOA), 2018, Office Vacancy Report, October
2018.
South African Reserve Bank (SARB), 2018, Statement of the Monetary Policy Committee, 20
September 2018.
Statistics South Africa, 2018, various publications.
The Automobile Association of South Africa, 2018, Fuel Pricing, Available online at -
https://www.aa.co.za/fuel-pricing
Transnet National Ports Authority of South Africa, 2018, Transnet Port Terminals: Ports Statistics.
Wesgro, 2018, Cape Town attractions: July to September 2018.
18
EPIC | Economic Performance Indicators for Cape Town | 2018: Quarter 3Abbreviations
ACSA: Airports Company South Africa
BER: Bureau for Economic Research
CCT/City: City of Cape Town
CPI: consumer price index
EPIC: Economic Performance Indicators for Cape Town
FNB: First National Bank
GDP: gross domestic product
GDP-R: regional gross domestic product
GGP: gross geographic product
GVA: gross value added
Ml: million litres
MPC: Monetary Policy Committee
PPI: producer price index
SARB: South African Reserve Bank
TEU: twenty-foot equivalent unit
USD: United States dollar
V&A: Victoria and Alfred
VAT: value-added tax
19
EPIC | Economic Performance Indicators for Cape Town | 2018: Quarter 3You can also read