Substance Misuse Prevention Needs Assessment, Idaho 2019
←
→
Page content transcription
If your browser does not render page correctly, please read the page content below

Substance Misuse Prevention Needs Assessment, Idaho 2019 |0
Acknowledgments
The development of this publication was funded through the Strategic Prevention Framework
Partnerships for Success Grant through the Substance Abuse and Mental Health Administration.
Preparing the 2019 State of Idaho Substance Abuse Needs Assessment was a collaborative of Idaho’s
State Epidemiological Outcomes Workgroup (SEOW), through the Office of Drug Policy. The material
represents the work of multiple contributors who offered the insight, discussion, and research necessary
to conduct a statewide needs assessment.

SEOW members include:

 Thomas Strauss, Chairman Idaho Statistical Analysis Center, Idaho State Police
 Cheryl Foster, Coordinator Idaho Office of Drug Policy
 Christopher Murphy         Bureau of Vital Records and Health Statistics, Division of Public Health,
                            Dept. of Health and Welfare
 Pam Harder                 Bureau of Vital Records and Health Statistics, Division of Public Health,
                            Dept. of Health and Welfare
 Megan Hearn                Drug Overdose Prevention Program, Division of Public Health, Dept. of
                            Health and Welfare
 Misty Kifer                Idaho Statistical Analysis Center, Idaho State Police
 Thomas Strauss             Idaho Statistical Analysis Center, Idaho State Police
 Janeena White              Idaho Department of Corrections
 Esmeralda Pina Herrera     Counter Drug, Idaho National Guard
 Monty Prow                 Idaho Department of Juvenile Corrections
 Tanea Parmenter            Bureau of Criminal Identification, Idaho State Police
 Tammara Tarvin             Idaho Sheriffs Association
 Steve Rich                 Idaho Department of Transportation
 Brett Van Anne             Idaho State Police
 Melinda Smyser             Idaho Office of Drug Policy

Section on socio-economic factors was contributed by Andrew Casio, intern at the Idaho Office of Drug
Policy.

For more information contact:

Cheryl Foster
Sr. Research Analyst
Idaho Office of Drug Policy
Cheryl.Foster@odp.idaho.gov
208-854-3048

Substance Misuse Prevention Needs Assessment, Idaho 2019                                                |1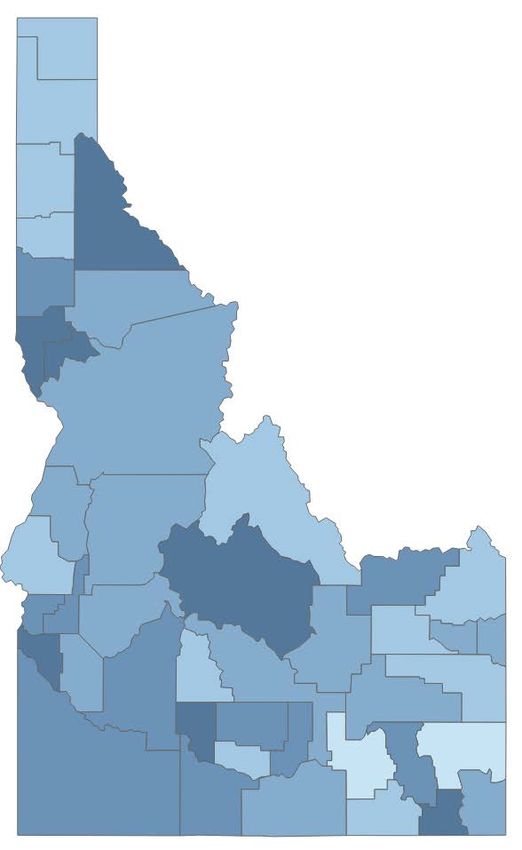
Table of Contents
  Acknowledgments .............................................................................................. 1
  2019 Summary Findings ..................................................................................... 5
  Introduction to Indicators .................................................................................. 7
    Data Types ............................................................................................................................................... 7
    Geographic Areas .................................................................................................................................... 8
    Priority Populations ................................................................................................................................. 8

  Demographic and Socioeconomic Factors ......................................................... 9
    Tribal Reservation Demographics ............................................................................................................ 9
    Public Health District Demographics ..................................................................................................... 10
       Population per Square Mile, 2018 ..................................................................................................... 11
       Population Growth, 2010-2018 ......................................................................................................... 11
       Median Age, 2018 .............................................................................................................................. 12
       Civilian Veteran Status, 2018 ............................................................................................................. 12
       Educational Attainment, 2018 ........................................................................................................... 13
       Unemployment Rate, 2018 ................................................................................................................ 13
       Median Household Income, 2018 ...................................................................................................... 14
       Income Below the Poverty Line, 2018 ............................................................................................... 14
    Socio-Economic Factors ......................................................................................................................... 15

  Risk and Protective Factors .............................................................................. 16
    Mental Health Indicators ....................................................................................................................... 16
       Any Mental Illness in the Past Year .................................................................................................... 16
       Serious Mental Illness in the Past Year .............................................................................................. 17
       Received Mental Health Services in the Past Year ............................................................................. 17
       Major Depressive Episode in the Past Year ........................................................................................ 18
       Serious Thoughts of Suicide in the Past Year ..................................................................................... 18

  Substance Indicators - Prescription Pain Medicine .......................................... 20
    Risk......................................................................................................................................................... 20
       Perception of Harm ............................................................................................................................ 20
    Consumption ......................................................................................................................................... 21
       Opioid Prescribing Rate per 100 Persons ........................................................................................... 21
       Pain Reliever Misuse in the Past Year ................................................................................................ 22
Substance Misuse Prevention Needs Assessment, Idaho 2019                                                                                                 |2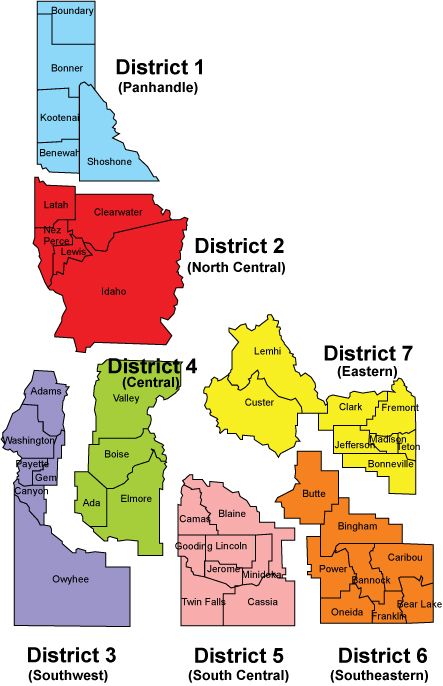
Youth Lifetime Prescription Drug Use without a Doctor’s Prescription ............................................. 22
  Consequence ......................................................................................................................................... 23
     Prescription Drug Overdose Deaths ................................................................................................... 23
     Estimated Prescription Drug/Narcotic Offenses ................................................................................ 25

Substance Indicators - Alcohol ......................................................................... 26
  Risk......................................................................................................................................................... 26
     Perception of Harm ............................................................................................................................ 26
  Consumption ......................................................................................................................................... 26
     Underage Drinking ............................................................................................................................. 27
     Heavy and Binge Drinking .................................................................................................................. 28
  Consequence ......................................................................................................................................... 28
     Liquor Law Violations ......................................................................................................................... 29
     Alcohol: Driving Under the Influence Arrest Rates ............................................................................ 29
     Alcohol-Involved Crashes ................................................................................................................... 29

Substance Indicators - Tobacco and Nicotine Products ................................... 31
  Risk......................................................................................................................................................... 31
     Perception of Harm ............................................................................................................................ 31
  Consumption ......................................................................................................................................... 32

Substance Indicators – Marijuana .................................................................... 34
  Risk......................................................................................................................................................... 34
     Perception of Harm ............................................................................................................................ 34
  Consumption ......................................................................................................................................... 36
  Consequence ......................................................................................................................................... 37

Substance Indicators - Methamphetamine ...................................................... 38
  Consumption ......................................................................................................................................... 38
  Consequence ......................................................................................................................................... 39

Substance Indicators - Heroin .......................................................................... 40
  Risk......................................................................................................................................................... 40
  Consumption ......................................................................................................................................... 40
  Consequence ......................................................................................................................................... 41

Substance Misuse Prevention Needs Assessment, Idaho 2019                                                                                                     |3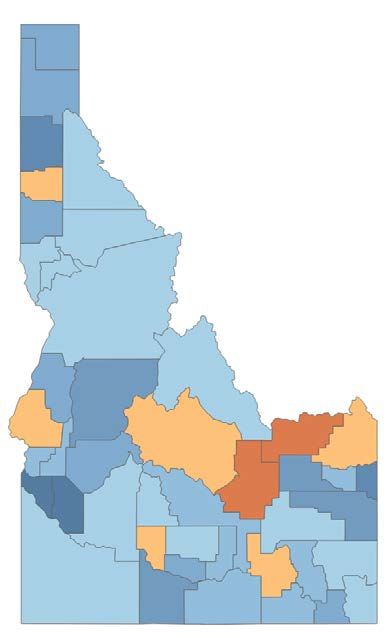
Data Resources for Local Prevention Practioners ............................................ 42
  Indicators Idaho ..................................................................................................................................... 42
  Public Health Data ................................................................................................................................. 42
     Drug Overdose Prevention Program – Idaho Opioid Dashboard ....................................................... 42
     Idaho Behavioral Risk Factor Surveillance System Results ................................................................. 42
     Interactive Substate Estimates from National Survey of Drug Use and Health ................................. 42
  Crime Statistics ...................................................................................................................................... 42
  Crash Statistics ....................................................................................................................................... 42

Public Health District Area Resources .............................................................. 43
  Behavioral Health Boards ...................................................................................................................... 43
     Idaho Region 1 ................................................................................................................................... 43
     Idaho Region 2 ................................................................................................................................... 43
     Idaho Region 3 ................................................................................................................................... 43
     Idaho Region 4 ................................................................................................................................... 43
     Idaho Region 5 ................................................................................................................................... 43
     Idaho Region 7 ................................................................................................................................... 43

References ........................................................................................................ 44

Substance Misuse Prevention Needs Assessment, Idaho 2019                                                                                                |4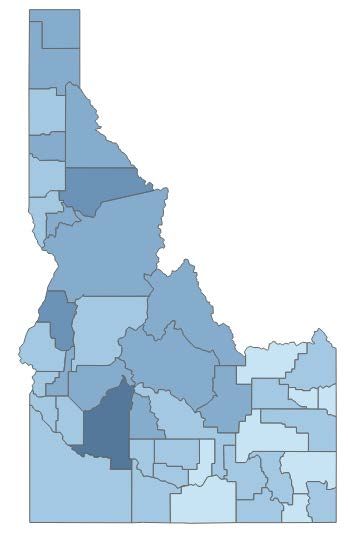
2019 Summary Findings
Population Stability – The composition and structure of Idaho’s population is different than the rest of
the United States in many ways. Idaho has a vast rural landscape with a few small but growing urban
areas. The overall population per square mile is 21 for the state, compared to 93 nationally. Idaho’s
population growth has outpaced the nation’s. Additionally, there is a migration from rural to urban
areas. The disparities in population shift range from -13% to +15% growth. 1

Economic Health – Idaho has one of the lowest unemployment rates in the country at 2.9%. 2 However,
the median household income ($53,089) is significantly less than the nation’s ($60,293). Idaho also has
a low level of educational attainment compared to the nation. Only 26.9% of Idahoans 25 and older
have a bachelor’s degree, compared to 31.5% in the nation.1

Mental Health –The National Survey of Drug Use and Health consistently ranks Idaho at the bottom of
the nation for indicators of mental illness. For example, Idaho’s ranking for having a major depressive
episode in the past year is #49 for those aged 1 –17 and #48 for those 18–25. Those aged 18 -25 report
significantly worse outcomes than those 26 and older in all indicators. 3

Prescription Drugs – Sales of retail oxycodone are slightly higher than the national average, but Idaho’s
numbers have decreased nearly 30% from 2016 to 2018 from 17,013 per 100,000 population to 12,072
per 100,000 population4. The percentage of Idaho high school students that misused prescription drugs
decreased by 29% between 2011 and 2019. 5 Between 2016 and 2018, the percent decrease for those
aged 18-25 was 35% and 20% for those over 25.3

Alcohol – Underage drinking is identified as a problem across Idaho. Almost 15% of Idaho’s 9th – 12th
graders surveyed drank alcohol (other than a few sips) before age 13 and 27% had at least one drink in
the past 30 days.5 Less than half of Idahoans perceive binge drinking as a great risk. Adults 26 and older
and those aged 12 – 17 are more likely to think that having five or more drinks once or twice a week is a
great risk, at 46.1% and 43.4% respectively, compared to 37.7% of those aged 18 - 25.3

Marijuana – The normalization of marijuana has led to an increase in use among Idaho’s adult and
youth population. Marijuana use within the past 30 days has increased from 6.9% to 8.2% in Idaho since
2011.3 The YRBS reports that 17% of Idaho youth used marijuana in the past 30 days, and 30% at least
once in their lifetime.5

1
  U.S. Census Bureau. 2012-2018 American Community Survey, 5-Year Estimates. 2019.
2 Bureau of Labor Statistics. 2019. "Unemployment Rates for States."
3
  Substance Abuse and Mental Health Services Administration. 2015-2018. National Survey of Drug Use and Health
4
  Automated Reports and Consolidated Ordering System (ARCOS). 2018. ARCOS Retail Drug Summary Reports. Drug
Enforcement Administration.
5 Idaho State Department of Education. 2019. "Idaho Youth Risk Behavior Survey."

Substance Misuse Prevention Needs Assessment, Idaho 2019                                                         |5
Tobacco or Nicotine – Approximately 5% of young Idahoans aged 12 –17 report using tobacco in the
past month, while those aged 18-25 and 26 and older report usage rates of 27% and 23% respectively. 6
However, vaping has skyrocketed in the nation and Idaho. Although it is technically not a tobacco
product, the nicotine content in vape products makes it equally or more addicting. 7 The YRBS reported
nearly 23% of Idaho’s high school students used a vaping product in the past 30 days. 8

Other Drugs – The use and trafficking of methamphetamines and heroin remain problematic for Idaho’s
law enforcement and medical personnel. The five-year arrest rate for methamphetamines was 111.3%,
while the heroin arrest-rate trend is 395.6%. 9 However, the percent of people reporting illicit drug use
other than marijuana has decreased since 2016. The decreases are from 3.0% to 2.4% for those aged
12-17, 7.1% to 4.9% for those 18-25, and 2.7% to 2.3% for those 26 and older.6

Prevention Programs – Funding from the Substance Abuse Block Grant and the Strategic Prevention
Framework Partnerships for Success Grant provide prevention program to 69 sub receipts and the seven
public health districts around the state.

6
  Substance Abuse and Mental Health Services Administration. 2015-2018. National Survey of Drug Use and Health
7
  Jankowski, Mateusz, et al. 2019. "E-Cigarettes are More Addictive Than Traditional Cigarettes - A Study in Highly Educated
Young People." Int J Environ Res Public Health
8
  Idaho State Department of Education. 2019. "Idaho Youth Risk Behavior Survey."
9
  Idaho State Police. 2018. National Incidence-Based Reporting System. Uniform Crime Reporting Program

Substance Misuse Prevention Needs Assessment, Idaho 2019                                                                 |6
Introduction to Indicators
The State of Idaho’s Substance Misuse Prevention Needs Assessment supports directors and
practitioners of primary prevention programs conducted around the state. It provides a yearly update
of the relevant national, state and local statistics related to the practice of substance misuse prevention.
The Statewide Epidemiological Outcomes Workgroup (SEOW) is responsible for reviewing the data
submitted in this needs assessment, setting priorities based on the data, and making recommendations
to the state and local areas for prevention programming and activities.

This assessment includes three categories of indicators:

   •   Demographic and Socioeconomic Indicators
   •   Risk and Protective Indicators
   •   Substance Misuse Indicators

Data Types
There are two primary types of quantitative data used for indicators in this needs assessment:
administrative data and survey data. It is important to understand the strengths and limitations of each
source.

Administrative data come directly from government records and provide actual counts of items, events,
or individuals. Examples of administrative data are crime statistics, vital records, crash statistics, and
quantities of substances. These statistics are only as good as the information recorded by individuals.
Many professionals such as coroners and police officers are allowed discretion in what is submitted in
their records; therefore administrative data should not always be considered a complete picture.

Most national studies are conducted using various types of survey data. The most frequently cited
surveys in this needs assessment are the American Community Survey (ACS) conducted by the U.S.
Census, the Current Population Survey (CPS) conducted by the Bureau of Labor Statistics, and several
surveys conducted by the Centers for Disease Control and Prevention: The National Survey of Drug Use
and Health (NSDUH), the Youth Risk Behavior Survey (YRBS), and the Behavioral Risk Factor Surveillance
System (BRFSS). All of these studies are conducted nationally and designed to provide state-level data
each year the survey is conducted. Although care is taken to account for variance and non-response,
survey data are only as good as what is provided by the surveyed individuals.

In some cases this needs assessment may reference research studies published in scientific or academic
journals, as well as other types of records or survey data to provide additional information. The Office
of Drug Policy conducts the Idaho Healthy Youth Survey (IHYS) every two years to provide local school
districts information on their student population regarding substance misuse. At this time, state
statistics cited from the IHYS should not be considered as robust as national surveys.

Substance Misuse Prevention Needs Assessment, Idaho 2019                                         |7
Geographic Areas
As often as possible, this needs assessment will provide data or links to data available at a county or
public health district level. Sources for county level data may come from administrative data from Idaho
state agencies or US Census ACS 5-year estimates. In some cases, it is possible to combine multiple
years of survey data to estimate substate region level statistics. The Idaho Department of Health and
Welfare may aggregate BRFSS data to provide information by public health district, as shown below.

         Seven Idaho Public Health Districts                  Five American Indian Reservations in Idaho

District 1     Panhandle Health District                                 •   Coeur d’Alene
District 2     North Central Health Department                           •   Duck Valley
District 3     Southwest District Health                                 •   Fort Hall
District 4     Central District Health Department                        •   Kootenai
District 5     South Central Public Health District                      •   Nez Perce
District 6     Southeastern Idaho Public Health
District 7     Eastern Idaho Public Health District

Priority Populations
Where available, data will be analyzed to address the following priority populations:
•     Young adults
•     Veterans
•     Racial and ethnic minorities, namely American Indian and Hispanic populations

Substance Misuse Prevention Needs Assessment, Idaho 2019                                     |8
Demographic and Socioeconomic Factors
Idaho is a geographically large state with vast frontier expanses and relatively few heavily populated
areas. The state of Idaho is predominately rural in character and culture, reflecting traditional morals,
values, and lifestyles, with pockets of cultural and ethnic diversity. According to the United States
Census Bureau, Idaho’s largest metropolitan area, the Treasure Valley which includes both Ada and
Canyon Counties, contains nearly 40% of the state’s population. Idaho’s urban, suburban, rural and
tribal lands have very different historical, social, and cultural features. Each community’s needs and
perspectives regarding alcohol, tobacco, and other drugs (ATOD) may differ from those of other groups
and cultures. Within these communities, prevention efforts must focus on the role social and economic
conditions play in problems associated with ATOD and the need to engage community leaders and
networks in prevention.
The following tables and maps highlight demographic characteristics by geographic area in Idaho. Except
for the unemployment rate, the data used in the following tables and maps are from the 2018 American
Community Survey 5-year estimates.
Tribal Reservation Demographics
Metric Coeur d'Alene Duck Valley Fort Hall Kootenai Nez Perce
Total Population 7,805 1,351 5,894 67 18,770
Population
Density Population per Square
14.9 3.0 7.2 16.0 15.7
Mile
Percent Hispanic Alone 5.4% 4.0% 13.0% 4.0% 5.1%
Percent Native
20.0% 94.0% 63.6% 68.7% 14.3%
Priority American Alone
Populations
Percent Aged 18-24 6.8% 5.6% 11.4% 9.0% 7.0%
Percent Civilian
12.4% 5.7% 7.0% 8.9% 12.3%
Veterans
Percent 25 or Older
with a Bachelor's 18.3% 14.5% 10.4% 2.6% 16.2%
Degree or Higher
Economic Median Household
$48,182 $35,750 $39,309 $49,375 $42,123
Factors Income
Percent Individuals
Living Below the Poverty 18.5% 36.2% 24.5% 28.4% 16.2%
Level
U.S. Census Bureau. 2012-2018 American Community Survey, 5-Year Estimates. 2019
Substance Misuse Prevention Needs Assessment, Idaho 2019 |9Public Health District Demographics
% Growth
District Name Population Percent of State
2010-2019
District 1 Panhandle 240,202 14% +11.7%
District 2 North Central 109,674 6% +3.6%
District 3 Southwest 290,788 17% +14.3%
District 4 Central 515,900 29% +18.0%
District 5 South Central 199,069 11% +7.1%
District 6 Southeastern 175,077 10% +3.1%
District 7 Eastern 223,498 13% +9.0%
Idaho Population 1,754,208 100% +11.7
2014-2018 American Community Survey 5-year estimates, Census.
Mean % Under
Ages Native Bachelor’s Household Poverty
Population 18-25 Hispanic American Educational Income Level*
Attainment
District 1 240,202 7.1% 4.4% 1.6% 23.1% $69,343 11.7%
District 2 109,674 13.3% 4.2% 3.5% 28.1% $61,309 13.1%
District 3 290,788 9.0% 23.2% 1.8% 17.3% $59,864 11.9%
District 4 515,900 8.7% 8.7% 0.9% 36.3% $82,910 9.7%
District 5 199,069 8.3% 24.4% 1.7% 20.4% $65,368 12.4%
District 6 175,077 9.2% 11.8% 4.2% 23.3% $64,891 12.3%
District 7 223,498 12.2% 11.6% 1.1% 29.3% $70,408 13.0%
Idaho 1,754,208 9.3% 12.7% 1.7% 26.9% $70,620 11.5%
2014-2018 American Community Survey 5-year estimates, Census.gov; *2000-2019 US Bureau of the Census, Small Area
Income and Poverty Estimates.
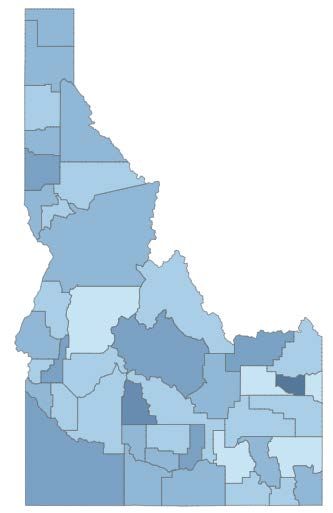
Substance Misuse Prevention Needs Assessment, Idaho 2019 |10Population per Square Mile, 2018 10
)
21 The U.S. Census estimates that Idaho has a
total population of 1,754,208.
State
93 445.5 According to the 2018 Census estimate, the
average number of people per square mile
National nationally was 92.6, compared to 21.2 in
Idaho. Approximately 65% (1,145,043) of
Idaho’s population reside in an urban
county.
The counties with the highest number of
people per square mile were Ada County
(445.5), Canyon County (378.8), and
Kootenai County (129.7). The counties with
0.5 the lowest number of people per square
mile were Clark County (0.5), Custer County
(0.9), and Camas County (1.0).
Population Growth, 2010-201810
The urban counties were often the fastest
12% 19.5
growing from 2010-2018. Ada and Canyon
counties grew 19.5% and 18.0% respectively.
State
Only seven counties exceeded the statewide
6% average of 11.7%, while eight counties
experienced negative growth during the
National
same time frame. Clark and Butte counties
experienced double-digit declines (-13.1%,
10.4%). The other counties had modest
gains in population.
-13.1
10
U.S. Census Bureau. 2012-2018 American Community Survey, 5-Year Estimates. 2019.
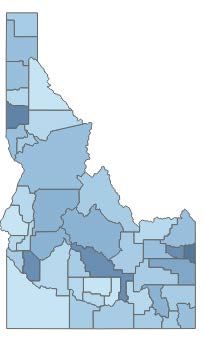
Substance Misuse Prevention Needs Assessment, Idaho 2019 |11Median Age, 2018 11
Idaho has a slightly younger population
relative to the United States as a whole,
37 55.0
with a median age of just 36.6. Madison
and Latah counties are by far the youngest
State
in the state with a median age of just 23.3
38 and 29.7 respectively. This is a natural
result of being dominated by the college
National towns of Rexburg and Moscow, both of
which contain major regional universities.
Despite this, Idaho does have a rapidly
aging population, with the median age
rising by two years between 2010 and
2018, twice the national rate. Over that
same time, the percentage of residents
aged 65 or older has increased by 3.4
23.2 points from 12.4% to 15.8%.
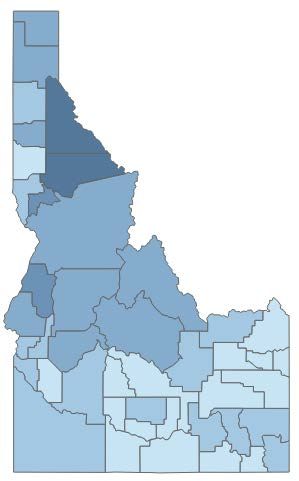
Civilian Veteran Status, 2018
Idaho has a relatively large population with
10%
23.6
veteran status, 9.8% of Idahoans over 18
State having served in the military compared to
8.2% overall in the United States. The rural,
8% mountainous counties of Northern and
Central Idaho, concentrated in health
National districts 1 and 2, have especially large
veteran populations. However, Elmore
3.1 County (District 4) has by far the largest
proportion of veterans of any county in the
state due to Mountain Home Air Force Base.
11
U.S. Census Bureau. 2012-2018 American Community Survey, 5-Year Estimates. 2019
Substance Misuse Prevention Needs Assessment, Idaho 2019 |12Educational Attainment, 2018 12
27% Of those age 25 and older, the U.S.
percentage of bachelor’s degree or higher is
State 45.1 31.5%, and the U.S. rate of high school
32% graduates (and equivalents) is 87.7%.
National
Idaho’s rate of high school graduate is higher
than the nation’s at 90.6%. However,
Idaho’s bachelor’s degree rate is less at
26.9% Only nine counties have a rate higher
than the state’s, the highest being Latah
County at 45.1%. The county with the
lowest educational attainment of a
bachelor’s degree is Lincoln.
10.1
Unemployment Rate, 2018 13
Idaho has consistently had a lower average
employment rate than the rest of the United
States. The Benchmarked Average Annual
2018 rate for Idaho is 2.8% compared to
3.9% for the U.S. The estimated rates in
2.8% 2019 for Idaho are 2.9% and the U.S. at
State 6.7 3.7%.
3.9% Within the state, the counties with the
National highest unemployment rates in 2018 were
Clearwater at 6.7% and Shoshone at 5.7%.
The counties with the lowest unemployment
rate were Madison County at 1.7% and
Franklin at 2.1%.
2.1
12
U.S. Census Bureau. 2012-2018 American Community Survey, 5-Year Estimates. 2019
13 Idaho Department of Labor. 2020. "State of Idaho Resident Labor Force."
Substance Misuse Prevention Needs Assessment, Idaho 2019 |13Median Household Income, 2018
Idaho’s median income significantly lags the
$53K nation’s at $53,089 per Idaho household
compared to $60,293 for U.S. households.
State
$68,818
$60K Only two counties in Idaho have a median
household income higher than the national
National
average: Teton at $68,818 and Ada at
$63,137.
Shoshone County has the lowest median
income at $36,7839.
Source: ACS 2018 5-Year Estimates
$35,341 Income and benefits (in 2018 inflation-
adjusted dollars): Median household
income
Income Below the Poverty Line, 2018
14%
State
14%
National
30.5 With a nation and state poverty rate at 14%,
Madison County has the highest percentage
of people below the poverty line at 30.5%.
Neighboring Teton County has the lowest
percent at 6.1%.
6.1
Source: ACS 2018 5-Year Estimates
Percentage of People whose income in the
past 12 months is below the poverty level.
Substance Misuse Prevention Needs Assessment, Idaho 2019 |14Socio-Economic Factors
Analysis by Andrew Casio
While there is a correlation between poverty and
substance use, the relationship is extremely complex.
While communities with a greater prevalence of
poverty do tend to have more overdoses as well as
alcohol related deaths, no correlation exist with
incidence of drug related crime and poverty.
What this may suggest is the phenomenon of overdoses
exists independently of substance abuse. Notably,
Hispanics have a higher risk of substance use over their
lifetime, and yet the risk of overdose or alcohol related
deaths for Hispanics is nearly one third that of non-
Hispanics. Despite being traditionally seen as a natural
outcome of lifetime substance abuse, overdoses can be
reevaluated instead as a result of cultural attitudes,
socio-economic factors, and addiction liability.
R-Squared: 0.1836; P-value: 0.0047. Excludes Madison, Clark
counties as outliers.
R-Squared: 0.0837, P-value 0.0630. Excludes Madison, Camas
counties as outliers. A weak-positive correlation between
poverty and drug overdoses is observed.
R-Squared: 0.0242, P-value: 0.2015. Correlation is not
statistically significant.
Sources:
Race/ethnicity differences between alcohol, marijuana, and co-occurring alcohol and marijuana use disorders and their association with public
health and social problems using a national sample. (2012). The American Journal on Addictions.
https://www.sciencedirect.com/science/article/pii/S037687161501618X?casa_token=hKMdkl5HRlMAAAAA:X4AcCL5fMVW8-
orAV_TDWryw6SJotcWlfyH02iPduntKYDZDW63M-t99tSmn9fcxmD3ktaY9RPwJ
Evaluation of race and ethnicity on alcohol and drug testing of adolescents admitted with trauma. (2003). Journal of Academic Emergency
Medicine.
“Idaho Drug Overdose Deaths – 2018.”(2019) Idaho Department of Health and Welfare.
National Incidence-Based Reporting System. (2018). Idaho State Police.
Genetic predisposition to substance addiction among American Indians. (2012). American Journal of Psychiatry.
Substance Misuse Prevention Needs Assessment, Idaho 2019 |15Risk and Protective Factors
Mental Health Indicators
The following mental health indicators are taken from the National Survey on Drug Use and Health.
Where available, three years of results are provided from the 2015-2016, 2016-2017, and 2017-2018
surveys. Outcomes are provided by age group – young adults 18 – 25 and adults 26 and older. A few
measures include the 12 – 17 age group, which is included if available. State rankings include the
District of Columbia and range from #1 to #51.
Data is provided for the regional health districts based on the NSDUH Substate Area report referencing
data for ages 12 and older aggregating results from the 2014-2016 surveys.
Any Mental Illness in the Past Year
The number of youth aged 18 – 25 reporting any mental illness in the past year has risen steadily in both
the U.S. and Idaho. In the overall U.S., individuals over the age of 26 had a steady rate of around 17.7%,
while Idaho’s rate increased. For the 2017-2018 NSDUH survey, Idaho ranks #47 for youth aged 18-25
and #50 for those ages 26 and older.
Any Mental Illness in the Past Year, by Age Group, Percentages, Annual Averages (NSDUH 2017-2018)
Ages 18-25 Ages 26+
35%
30.5%
27.8% 35%
30%
25.1% 30%
23.9%
25% 24.6%
26.0% 23.5%
25% 21.0%
23.9% 19.8%
20% 21.9%
20.9% 20%
15% 17.5% 17.4% 17.7% 17.9%
2015 2016 2017 2018 15%
2015 2016 2017 2018
US 18-25 Idaho 18-25 US 26+ Idaho 26+
The rates of mental illness for those ages 12 and older in the substate areas between 2014 and 2016 are
not widely varied.
Mental Illness Rates in Substate Areas (NSDUH 2014-2016)
Idaho Region 1 Region 2 Region 3 Region 4 Region 5 Region 6 Region 7
21.6% 20.8% 20.4% 21.8% 22.8% 20.8% 21.8% 21.1%
Substance Misuse Prevention Needs Assessment, Idaho 2019 |16Serious Mental Illness in the Past Year
The trend lines for reporting serious mental illness is similarly sloped to those for any mental illness, but
the percentages are much smaller. Idaho’s 18-25 youth report rates of 5.6% in 2015 to 8.9% in 2018,
compared to the US rates of 4.9% to 7.6%. Those over the age of 26 fare better, reporting rates of 4.3%
to 5.0% for Idaho and 3.9% to 4.1% nationally. Idaho’s state rankings have improved in this category for
2017-2018. Idaho ranks #42 for ages 18-25, up from #46 in 2016-2017; and #43 for ages 26 and over,
up from #51 (last).
Serious Mental Illness in the Past Year, NSDUH
10%
7.9%
8% 7.2%
6.7%
5.6% 6.7%
6% 7.6%
4.9% 5.5% 5.1%
4.7%
4% 4.1%
3.9%
2%
0%
2015 2016 2017 2018
US 18-25 Idaho 18-25 US 26+ Idaho 26+
The rates of serious mental illness in the substate areas between 2014 and 2016 are not widely varied.
Serious Mental Illness Rates in Substate Areas (NSDUH 2014-2016)
Idaho Region 1 Region 2 Region 3 Region 4 Region 5 Region 6 Region 7
4.85% 4.85% 4.76% 5.33% 4.60% 4.98% 5.01% 4.73%
Received Mental Health Services in the Past Year
Again, Idaho ranks in the bottom quartile for received Mental Health Services in the Past Year.
Idaho’s U.S. Ranking by Age Group (NSDUH)
18-25 26+
2016 #44 #36
2017 #41 #39
2018 #43 #48
A higher percentage of individuals aged 12 and older received mental health services in Region 4
compared to Region 5.
Received Mental Health Services in the Past Year in Substate Area (NSDUH 2014-2016)
Idaho Region 1 Region 2 Region 3 Region 4 Region 5 Region 6 Region 7
16.8% 17.3% 17.2% 16.0% 18.0% 14.9% 16.7% 16.4%
Substance Misuse Prevention Needs Assessment, Idaho 2019 |17Major Depressive Episode in the Past Year
A larger percentage of Idaho’s youth reported having a major depressive episode in the past year (2017-
2018 NSDUH).
Major Depressive Episode in the Past Year
NSDUH 2017-2018
20%
16.7% 16.8%
16% 13.8% 13.4%
12%
6.1% 7.0%
8%
4%
0%
Ages 12-17 Ages 18-25 Age 26+
US Idaho
Again, Idaho’s state ranking is near the bottom for most age groups reporting having a major depressive
episode in the past year.
Idaho’s U.S. Ranking, NSDUH
12-17 28-25 26+
2016-2017 #50 #44 #45
2017-2018 #49 #48 #29
The rates of having a major depressive episode in the past year are not widely varied by substate areas
between 2014 and 2016.
Major Depressive Episode Rates in Substate Areas (NSDUH 2014-2016)
Idaho Region 1 Region 2 Region 3 Region 4 Region 5 Region 6 Region 7
7.4% 6.9% 7.6% 7.2% 8.0% 7.0% 7.4% 7.2%
Serious Thoughts of Suicide in the Past Year
The number of individuals reporting serious thoughts of suicide has decreased over the past three years.
However, Idaho’s rates are still above the nation’s and the ranks are near the bottom.
Idaho U.S. Ranking, NSDUH
18-25 26+
2015-2016 #30 #42
2016-2017 #40 #44
Substance Misuse Prevention Needs Assessment, Idaho 2019 |182017-2018 #41 #51
Serious Thoughts of Suicide, Ages 18+, NSDUH
5.5% 5.6%
6.0%
4.8%
5.0% 4.4%
4.0%
4.3% 4.2%
3.0% 4.0% 4.0%
2.0%
1.0%
0.0%
2014-2015 2015-2016 2016-2017 2017-2018
US Idaho
The rates of serious thoughts of suicide in the past year are not widely varied by substate areas between
2014 and 2016 (ages 18+).
Serious Thoughts of Suicide in the Past Year (NDUH 2014-2016)
Idaho Region 1 Region 2 Region 3 Region 4 Region 5 Region 6 Region 7
4.8% 4.6% 4.5% 5.2% 4.8% 4.3% 4.9% 4.9%
Substance Misuse Prevention Needs Assessment, Idaho 2019 |19Substance Indicators - Prescription Pain Medicine
Opioids are a class of drugs that include prescription pain relievers, as well as the illegal drug heroin, and
synthetic opioids such as fentanyl. The drug works by binding to opioid receptors on the nerve cells in
the brain and body to reduce pain and suppress coughs. It can also cause intense euphoria or high that
leads the body to dependence and/or addiction. Side effects include sleepiness, constipation, and
nausea, while symptoms of an overdose may include shallow breathing, slowed heart rate and loss of
consciousness.
Risk
Perception of Harm
Questions from the 2018 Idaho Behavioral Risk Factor Surveillance System were used to ascertain
perceptions of harm when people use prescription painkillers more frequently or in higher doses than
prescribed or when they use without a prescription. Sex, age group, and income categories were
statistically associated with perceptions of harm.
Income less Income greater
All Adults Male Female
Risk Perception than $35,000 than $35,000
No Risk 1.3% 1.8% 0.8% 2.3% 0.9%
Slight Risk 3.8% 4.5% 3.1% 6.3% 2.6%
Moderate Risk 16.6% 19.3% 13.9% 18.6% 15.8%
Great Risk 78.3% 74.4% 82.2% 72.8% 80.6%
Risk Perception All Ages 18-24 25-34 35-44 45-54 55-64 65+
No Risk 1.3%Consumption
Opioid Prescribing Rate per 100 Persons
According to the Centers for Disease Control and Prevention’s U.S. Prescribing Rate Maps, the rate of
retail opioid prescriptions dispensed in Idaho was 53.4 per 100 persons in 2019, down from 70.3 per 100
persons in 2017. Although this was a 24% decrease, Idaho still remains higher than the national average
of 46.7 opioid prescriptions dispensed per 100 persons. 14
Nez Perce County (142.2), Caribou (91.6), Twin Falls County (90.7), Bannock County (81.8), Butte (76.2)
and Bonneville (75.5) all fall within the top 10th percentile of all counties in the nation for opioid
prescribing rate per 100 persons. 15
According to the Automation of Reports and Consolidated System (ARCOS), which is a database of
controlled substance transactions, in 2018, Idaho was above the national average in the rate of retail
oxycodone distributed. ARCOS is a database of controlled substance transactions destined for
pharmacies, hospitals, or physicians’ offices, collected from manufacturers and distributors, and
reported to the Drug Enforcement Administration (DEA). The rates reported are based on population
estimates in 2010.
Among all opioids within the ARCOS database, oxycodone and hydrocodone have the highest retail
distribution per 100,000 in Idaho. In 2018, 212,925.62 grams of oxycodone and 201,065.09 grams of
hydrocodone were distributed to pharmacies, hospitals, and physicians’ offices in Idaho.
Between 2014 and 2018, the retail distribution of grams of oxycodone per 100,000 population in the
United States decreased by 28%. During the same time period, in Idaho, the retail distribution of grams
of oxycodone per 100,000 population decreased by 19%. The rate in Idaho had been consistently lower
than that of the United States until 2018 when retail distribution in Idaho was greater than that in the
United States. 16
Retail Distribution of Oxycodone
per 100,000
20,000
10,000
0
2014 2015 2016 2017 2018 2019
US Idaho
2019 ARCOS Summary Report
14
https://www.cdc.gov/drugoverdose/maps/rxrate-maps.html
15
https://www.cdc.gov/drugoverdose/maps/rxcounty2019.html
16
2018. ARCOS Retail Drug Summary Reports. Drug Enforcement Administration, United States Department of Justice,
Diversion Control Division.
Substance Misuse Prevention Needs Assessment, Idaho 2019 |21Between 2014 and 2018, the retail distribution of grams of hydrocodone per 100,000 population in the
United States decreased by 40%. During the same time period, in Idaho, the retail distribution of grams
of hydrocodone per 100,000 population decreased by 27%. The rate in Idaho has been consistently
above that of the United States. 17
Retail Distribution of
Hydrocodone per 100,000
20,000
15,000
10,000
5,000
0
2014 2015 2016 2017 2018 2019
US Idaho
2019 ARCOS Summary Report
In 2018, Idaho ranked 6th in the nation for the highest retail distribution per 100,000 population of
hydrocodone.15
Pain Reliever Misuse in the Past Year
According to the National Survey on Drug Use and Health (NSDUH), in 2017/2018, among all 50 states
and D.C., Idaho ranked 27th among individuals 12 and older for pain reliever misuse in the past year.
This item on the NSDUH was revised in 2016, so estimates cannot be reliably compared to previous
years. Misuse is defined as use in any way not directed by a doctor, including use without a prescription
of one’s own; use in greater amounts, more often, or longer than told; or use in any other way not
directed by a doctor. Approximately 4.3% of Idahoans reported past year pain reliever misuse compared
to 4.2% nationally. Idahoans aged 18 - 25 were significantly more likely to report pain reliever misuse
than other age groups; 7.2% reported misusing pain relievers in the past year. 18
Youth Lifetime Prescription Drug Use without a Doctor’s Prescription
According to the Youth Risk Behavior Survey (YRBS) in 2019, 14.2% of high school students in Idaho
reported taking prescription drugs not prescribed by a doctor or differently than how a doctor told them
to use it one or more times during their life. The Idaho trend matches the national trend.
17
2018. ARCOS Retail Drug Summary Reports. Drug Enforcement Administration, United States Department of Justice,
Diversion Control Division.
18
Substance Abuse and Mental Health Services Administration. 2015-2018. National Survey of Drug Use and Health. Center
for Disease Control and Prevention.
Substance Misuse Prevention Needs Assessment, Idaho 2019 |22The percentage of Idaho high school students that misused prescription drugs decreased by 29%
between 2011 and 2019.
Between 2011 and 2019, the percentage of
Idaho high school that reported having ever used YRBS Lifetime Misuse
prescription drugs without a doctor’s
25.0%
prescription has decreased, with the percentage
in Idaho hovering slightly below that of the 20.0%
United States 20.1%
15.0% 16.8%
16.3%
According to the Idaho Department of 13.9% 14.2%
Education’s 2019 YRBS report, females 10.0%
(compared to males) were significantly more
5.0%
likely to report having ever used a prescription
drug without a doctor’s prescription. Further, 0.0%
academic achievement is significantly associated 2011 2013 2015 2017 2019
with prescription drug use; those with lower
US Idaho
grades are more likely to report using
prescription drugs at least once in their
lifetimes. 19
Consequence
Prescription Drug Overdose Deaths
Opioids, including prescription pain relievers, heroin, and fentanyl, lead drug-induced deaths in Idaho.
Although Idaho does not require coroners to report toxicology from drug overdose deaths, 58% of
deaths with drugs identified from 2015 to 2019, of the deaths where one or more drugs was identified,
were identified as opioid-involved. Not including deaths, opioid overdoses also accounted for nearly 16
out of every 10,000-emergency department visit in 2019. 20
19
Idaho State Department of Education. 2019. "Idaho Youth Risk Behavior Survey."
20
Idaho Department of Health and Welfare, Drug Overdose Prevention Program. October 2020.
Substance Misuse Prevention Needs Assessment, Idaho 2019 |23The following chart shows the number and age-adjusted rate (AAR) of drug overdose deaths, total, and
reporting prescription pain reliever opioid involvement by year: Idaho residents, 2009-2018.
Number and Age-Adjusted Rate for Drug Overdose
300 Deaths 8
250 7
200 6
150 5
4.8 4.6
4.3 4.4 4.3 4.4
100 4.1 4
3.7 3.8
3.5
50 3
0 2
2009 2010 2011 2012 2013 2014 2015 2016 2017 2018
Total Drug Overdose Deaths Prescription Pain Reliever Opioids AAR
Idaho Department of Health and Welfare, Vital Records and Statistics, Drug Overdose Deaths 2018
The following table shows the number of drug overdose deaths with one or more drugs reported, and
drug overdose deaths by type of opioid and type of non-opioid drug(s) reported on the death certificate
by Public Health District of residence (HD): Idaho residents, 2014-2018 (aggregate). 21
Drug Overdose Deaths reporting Region Region Region Region Region Region Region
Opioids 1 2 3 4 5 6 7
Natural and synthetic opioids 5 15 29 92 30 51 17
*Oxycodone/Hydrocodone/Codeine 45 14 24 76 28 40 16
*Morphine 19 9 24 3 15 1
Methadone 9 4 4 25 8 15 7
Synthetic opioid other than 17 6 10 48 9 14 11
methadone
Other/unspecified narcotic 5 5 2 4 2 9 7
Idaho Department of Health and Welfare, Vital Records and Statistics, Drug Overdose Deaths 2018
21
Idaho Department of Health and Welfare, Drug Overdose Deaths – 2018.
Substance Misuse Prevention Needs Assessment, Idaho 2019 |24Estimated Prescription Drug/Narcotic Offenses
According to the National Incidence Based Reporting System (NIBRS), estimates for prescription drug-
related arrests have more than doubled between 2009 - 2018.
5-Year Arrest trend 2014 – 2018 = 17.3%
10-Year Arrest Rate Trend 2009-2018 = 85.4%
Counties with the highest arrest rates per 1,000 residents are Clark (3.46), Adams (3.09), and Benewah
(2.27). 22
For county level records, please view www.isp.idaho.gov/pgr/sac/drug-crime-data
22
Idaho State Police. 2018. National Incidence-Based Reporting System. Uniform Crime Reporting Program
Substance Misuse Prevention Needs Assessment, Idaho 2019 |25Substance Indicators - Alcohol
Risk
Perception of Harm
According to the NSDUH, Idahoans’ perception of great risk from having five or more drinks of an
alcoholic beverage once or twice a week is slightly lower than the national percentage. The difference is
not statistically significant. 23
Perceptions of Great Risk from Having Five or More Drinks of an Alcoholic Beverage Once or Twice a
Week, by Age Group, NSDUH
Ages Idaho 2017 Idaho 2018 U.S. 2017 U.S. 2018
12 - 17 42.2% 40.9% 43.8% 43.4%
18 - 25 36.1% 34.8% 37.5% 37.7%
26+ 43.8% 45.7% 45.7% 46.1%
Consumption
According to the Idaho State Liquor Division, the sales of 9-liter cases increased 17.5% from 1,050,000 in
2015 to 1,234,000 in 2019. The apparent per capita consumption of distilled spirits has increased 1.53
to 1.64 from 2015 to 2018, an increase of 7%. The rate has been consistently lower than that of the
United States. 24
According to the NSDUH in 2017/2018 among all 50 states and D.C., Idaho ranked 44th, 49th, 48th, and
43rd among individuals 12 and older (45.2%), 12 to 17 (7.8%), 18 to 25 (47.1%), and 26 and older
(50.2%), respectively, for past month alcohol use. These rankings are down for Idahoans in all age
groups.21
NSDUH, Alcohol Use in the Past Month. Ages 12+
State 2015-2016 2016-2017 2017-2018
Total U.S. 51.21% 51.21% 51.37%
Idaho 44.62% 46.47% 45.23%
23
Substance Abuse and Mental Health Services Administration. 20105-20018 National Survey of Drug Use and Health
24
Idaho State Liquor Division. 2020. “2019 Annual Report”
Substance Misuse Prevention Needs Assessment, Idaho 2019 |
26For Idahoans aged 18+, it is estimated that:
State & National Alcohol Use
• 632,000 Idahoans used alcohol in the
60% 55%
past month; 51%
• 301,000 Idahoans engaged in binge 50%
drinking in the past month; 40%
• 75,000 Idahoans struggled with Alcohol 30% 24% 26%
Use Disorder in the past year; 20%
• 72,000 Idahoans needed treatment for 10% 6% 6%
alcohol use but did not receive it. 25 0%
Past Month Alcohol Use Past Month Binge Alcohol Use Disorder
Alcohol Use
Idaho U.S.
Underage Drinking
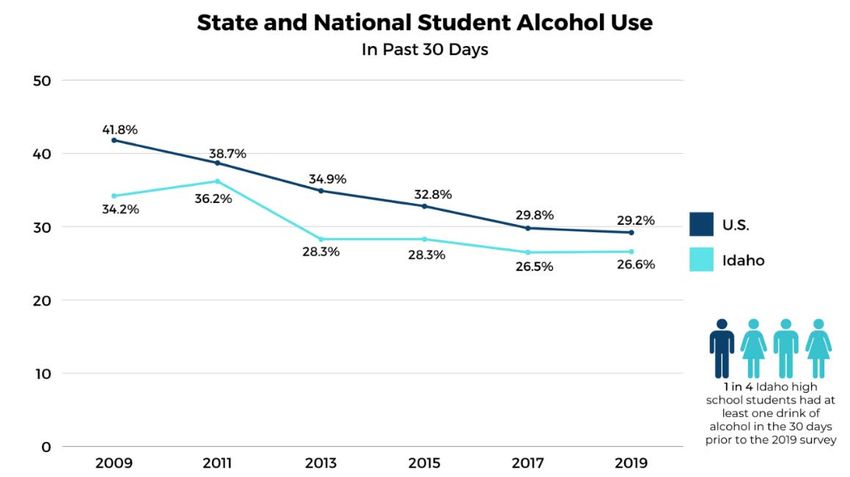
Alcohol use has decreased among high school students. According to the Idaho Youth Behavior Risk
Survey (YRBS) in 2019, the percentage of high school students in Idaho reporting alcohol use and binge
drinking in the past 30 days decreased significantly since 2009 (see charts and table below). 26
According to the 2019 Idaho Youth Risk Behavior Survey Idaho students reported alcohol as the most
used substance, with 39.1% of high schoolers having used alcohol at least once in their lifetime.24
One in four Idaho high school students Fifteen percent of students
27% reported having at least one drink of 15% reported having their first drink of
alcohol on one or more of the past 30 alcohol before the age of 13
days. (other than a few sips).
25
Substance Abuse and Mental Health Services Administration. 2015-2018 National Survey of Drug Use and Health
26
Idaho State Department of Education. 2019. “Idaho Youth Behavior Risk Survey”
Substance Misuse Prevention Needs Assessment, Idaho 2019 |27Heavy and Binge Drinking
Binge Drinking: The National Institute of Alcohol Abuse and Alcoholism defines binge drinking as a
pattern of drinking that brings blood alcohol concentration (BAC) levels to 0.08 g/dL. This typically
occurs after 4 drinks for women and 5 drinks for men—in about 2 hours.
Heavy Alcohol Use: Substance Abuse Mental Health Services (SAMHSA) defines heavy alcohol use as
binge drinking on 5 or more days in the past month.
According to the YRBS, the percentage of students who had five or more drinks of alcohol in a row, that
is, within a couple of hours, on one or more of the past 30 days. 27
Binge Drinking Among High School Students25
2005 2007 2009 2011 2013 2015 2017 2019
Idaho 28.30% 30.40% 22.30% 21.80% 18.2% 15.60% 15.3% 15.9%
U.S 25.50% 26.00% 24.20% 21.90% 20.8% 17.70% 13.5% 13.7%
According to the Behavioral Risk Factor Surveillance System (BRFSS) the percentage of adults 18 and
over in Idaho reporting heavy drinking and binge drinking have not changed significantly since 2012. 28
Heavy and Binge Drinking, Idaho BRFSS 2018
18.0% 16.1%
14.9% 14.8% 15.1% 15.1%
16.0% 14.1% 14.1%
14.0%
12.0%
10.0%
8.0%
6.0%
7.0% 6.7% 6.7%
4.0% 5.7% 6.2%
5.0% 5.3%
2.0%
0.0%
2012 2013 2014 2015 2016 2017 2018
Heavy Binge
Consequence
Nationally, an estimated 95,000 people (approximately 68,000 men and 27,000 women) die from
alcohol-related causes annually, making alcohol the third leading preventable cause of death in the U.S.
behind tobacco, poor diet, and physical inactivity. 29 In Idaho, each year 437 deaths and 12,311 years of
potential life are lost due to the harms resulting from excessive alcohol use. 30
27
Idaho State Department of Education. 2019. “Idaho Youth Behavior Risk Survey
28
Idaho Department of Health and Welfare. 2019. Behavioral Risk Factor Surveillance System.
29
National Institute on Alcohol Abuse and Alcoholism. October 2020. " Alcohol facts and statistics."
30
Centers for Disease Control and Prevention. 2019. "Prevention Status Reports by State, Idaho Summary."
Substance Misuse Prevention Needs Assessment, Idaho 2019 |28Liquor Law Violations
The rate of liquor law violations has decreased dramatically since 2009 – from 4.19 per 1,000 residents
to 0.63 per 1,000 residents. The trends are as follows:
• 5-year arrest trend 2014 – 2018 = - 57.2%
• 10-Year Arrest Rate Trend 2009-2018 = - 85.1% 31
Alcohol: Driving Under the Influence Arrest Rates
Rates of arrests for driving under the influence have leveled out in the past five years after a large
decrease from 2009. The 2009 arrest rate was 7.95 per 1,000 residents to 4.50 per 1,000 residents in
2018.
• 5-year arrest trend 2014 – 2018 = 2.6%
• 10-Year Arrest Rate Trend 2009-2018 = -43.4%
•
The counties with the highest arrest rates for driving under the influence per 1,000 residents are: Valley
(8.98), Clark (8.08), Blaine (7.71 and Adams (7.36)29.
Alcohol-Involved Crashes (2019)
According to the CDC, 612 people were killed in crashes involving an alcohol-impaired driver in Idaho
from 2009-2018. In 2018, 22 Idahoans under the age of 21 died from alcohol-attributed deaths,
resulting in 1,376 years of potential life lost. 32
31
Idaho State Police. 2019. National Incidence-Based Reporting System.
32
Centers for Disease Control and Prevention. 2019. "Prevention Status Reports by State, Idaho Summary."
Substance Misuse Prevention Needs Assessment, Idaho 2019 |29In 2019:
• 28% of all fatal crashes were alcohol involved;
• 14% of serious injury crashes are alcohol involved
• 5% of all alcohol related crashes resulted in fatal injury;
• 11% of all alcohol related crashes result in serious injury 33.
For county level crash data, please view https://itd.numetric.net/itd-safety-dashboards#/
33
Office of Highway Safety, Idaho Transportation Department. 2019. “Crash Statistics”
Substance Misuse Prevention Needs Assessment, Idaho 2019 |30Substance Indicators - Tobacco and Nicotine Products
Risk
Perception of Harm
Idaho’s adults 18-25 and 18 and older have a significantly lower perception of great risk from smoking
one or more packets of cigarettes a day than the rest of the West 34.
Perceptions of Great Risk from Smoking One or More Packs of Cigarettes per Day,
2017-2018 NSDUH
Survey Year Area 12 or Older 12-17 18-25 26 or Older 18 or Older
Estimate Estimate Estimate Estimate Estimate
2017-2018 Total U.S. 71.73% 66.27% 67.04% 73.11% 72.27%
2017-2018 West 73.62% 67.17% 69.68% 75.02% 74.27%
2017-2018 Idaho 70.74% 67.28% 61.90% 72.69% 71.15%
Idaho Healthy Youth Survey 2019
As part of the 2019 Idaho Healthy Youth Survey, students were asked “How much do you think people
risk harming themselves physically or in other ways when they use a vape pen or e-cigarette?” Most
students thought it presented a moderate to great risk35.
Vape or E-Cigarette Perception of Harm
2019 IHYS
Risk 6th grade 8th grade 10th grade 12th grade Overall
No Risk 7.5% 6.2% 8.3% 11.0% 8.1%
Slight Risk 10.9% 15.7% 19.7% 23.6% 17.3%
Moderate Risk 22.2% 27.3% 28.3% 27.0% 26.2%
Great Risk 59.4% 50.6% 43.8% 38.5% 48.3%
34
Substance Abuse and Mental Health Services Administration. 2015-2018 National Survey of Drug Use and Health
35
Idaho State Department of Education. 2019. “Idaho Youth Behavior Risk Survey”
Substance Misuse Prevention Needs Assessment, Idaho 2019 |31Consumption
There hasn’t been a significant change in tobacco product use across the last three years across all age
groups. 36
Tobacco Product Use in the Past Month, by Age Group; NSDUH
12 or Older 12-17 18-25 26 or Older 18 or Older
Year State Estimate Estimate Estimate Estimate Estimate
Total U.S. 22.0% 4.6% 27.5% 23.1% 23.7%
2017-2018 Idaho 21.7% 5.0% 28.2% 23.0% 23.7%
Total U.S. 23.0% 5.1% 29.5% 24.04% 24.8%
2016-2017 Idaho 22.7% 6.0% 33.0% 23.3% 24.7%
Total U.S. 23.7% 5.7% 31.5% 24.6% 25.6%
2015-2016 Idaho 21.0% 5.7% 31.2% 21.5% 22.9%
However, youth aged 17-25 use tobacco products at a higher rate than other age groups.34
Tobacco Usage, NSDUH 2017-2018
30%
20%
10%
0%
Ages 12 - 17 Ages 18 - 25 Ages 26 and older
US Idaho
The Youth Risk Behavior Survey has tracked the percent of high school students who had ever tried
smoking or vaping. The percentage of students in Idaho and the nation who had ever tried cigarettes
has decreased steadily. However, the percent who had tried vaping in Idaho since 2015 is over twice as
high. 37
Have Ever Tried Smoking or Vaping, YRBS
54.3%
60%
45.2% 48.1%
40%
45.4% 24.1%
20%
0%
2005 2007 2009 2011 2013 2015 2017 2019
US Idaho Idaho Vape
36
Substance Abuse and Mental Health Services Administration. 2015-2018 National Survey of Drug Use and Health
37
Idaho State Department of Education. 2019. “Idaho Youth Behavior Risk Survey”
Substance Misuse Prevention Needs Assessment, Idaho 2019 |32You can also read