Health Impact Assessment Associated with Exposure to PM10 and Dust Storms in Kuwait - MDPI
←
→
Page content transcription
If your browser does not render page correctly, please read the page content below
atmosphere
Article
Health Impact Assessment Associated with Exposure
to PM10 and Dust Storms in Kuwait
Ali Al-Hemoud 1, *, Ali Al-Dousari 1 , Ahmad Al-Shatti 2 , Ahmed Al-Khayat 3 , Weam Behbehani 3
and Mariam Malak 1
 1   Crisis Decision Support Program, Environment and Life Sciences Research Center, Kuwait Institute for
     Scientific Research, P.O. Box 24885, Safat 13109, Kuwait; adousari@kisr.edu.kw (A.A.-D.);
     mmalak@kisr.edu.kw (M.M.)
 2   Occupational Health Department, Ministry of Health, P.O. Box 51360, Riqqa 53454, Kuwait;
     ahmad.alshatti2011@yahoo.com
 3   Techno-Economics Division, Kuwait Institute for Scientific Research, P.O. Box 24885, Safat 13109, Kuwait;
     Akhayat@kisr.edu.kw (A.A.-K.); wbahbaha@kisr.edu.kw (W.B.)
 *   Correspondence: ahomood@kisr.edu.kw; Tel.: +965-24989464

 Received: 19 October 2017; Accepted: 26 December 2017; Published: 8 January 2018

 Abstract: Little information is available on the assessment of health impact concerning the Middle
 Eastern dust storms and PM10 concentration levels despite the aridity of the region and frequent
 dust storms occurring in this part of the world. A prospective study was conducted to determine
 the association between dust particles and morbidity and mortality rates for respiratory and
 cardiovascular diseases in Kuwait. Spearman and Pearson’s correlations were used to identify
 such associations. Results revealed a significant correlation between dust storms, suspended dust and
 rising dust (p < 0.01). Correlation between the occurrence of respiratory and cardiovascular diseases
 and dust storms showed that PM10 concentrations were significantly correlated with bronchial
 asthma at the 0.05 level (Pearson r = 0.292). Significant correlations at the 0.01 level were shown
 between bronchial asthma and both acute lower respiratory tract infection (r = 0.737) and acute
 upper respiratory tract infection (r = 0.839). Respiratory and cardiovascular mortality rates were
 both equal to 0.62 per 10,000 persons, each corresponding to 8.7% proportionate mortality rate.
 This study provides a good evidence of the consistent relationship between dust storm events,
 PM10 concentration levels, and respiratory diseases.

 Keywords: dust storms; PM10 ; respiratory; cardiovascular; morbidity; mortality; health impact

1. Introduction
     Dust storms are natural phenomena, most of which originate in desert or semi-desert drylands,
in which dust particles are transported away from the main source, sometimes over thousands of
kilometers [1]. The northern region of the Arabian region is characterized by complex dust storm
trajectories where they pass through the western desert of Syria and Iraq toward the Mesopotamian
flood plain reaching the northeastern region of the peninsula into Kuwait at a dust fallout rate of
61.4 tons per km2 per year, where fallen dust compromises 37% of sand particles [2,3]. A particular
feature of blown dust is its extreme particulate matter intensity that increases the ambient air dust
concentrations for several days. Dust particles include both PM10 and PM2.5 particle sizes which
have an aerodynamic diameter smaller than 10 and 2.5 µm, respectively. A large number of desert
dust contains particles with concentrations exceeding the guidelines established by the World Health
Organization (WHO) for human health protection (20 µg/m3 annual average; 50 µg/m3 a daily
average) [4]. Atmospheric concentrations in individual dust events have recorded PM10 levels of
1000 µg/m3 , with extreme values exceeding 10,000 µg/m3 during the notorious Red Dawn event

Atmosphere 2018, 9, 6; doi:10.3390/atmos9010006                              www.mdpi.com/journal/atmosphere
Atmosphere 2018, 9, 6                                                                               2 of 13

in Australia in September 2009 [1]. Daily PM10 levels over 200 µg/m3 were suggested for small to
medium scale dust events, while a higher cut-off point of 400 µg/m3 was used to define severe dust
events [5,6]. Other studies have used much lower PM10 levels to identify dust storm days [7–10].
      Because most air quality monitoring stations record data based on the PM10 measurements as
opposed to other particulate matter size, the majority of epidemiological studies use PM10 level as
exposure indicator. The World Health Organization air quality guidelines have provided a basis for
characterizing human health effects of major air pollutants including PM10 [4]. The assessment of
personal exposure to air pollution is a critical component of epidemiological studies in the evaluation
of health effects from airborne particulate matter (PM). The recognized air pollution effects over public
health include increased risk of hospital admissions and mortality by respiratory or cardiovascular
diseases. An aggregate risk index is a useful tool to identify the additive effects of short-term exposure
of the main air pollutants, including PM10 and PM2.5 [11]. Although fine particles below PM2.5
comprise the greatest health concern, since they are more likely to penetrate deep into the alveoli sacs
of the lungs, the PM10 course particles represent the predominant part of dust in dust storms and cover
most of the respiratory health issues, as large particles become trapped in the nasal passages, nose hair
follicles and upper respiratory tract [12]; in contrast, fine particles decline due to high wind speed and
long travel distances of dust storms [13,14].
      Dust storm events have been strongly associated with mortality and morbidity rates with a broad
range of health effects, but predominantly to the respiratory and cardiovascular systems. Several
studies from various countries have examined the effects of dust storms and particulate matter on
morbidity and mortality rates, and hospital admissions for various ill-health effects. During Saharan
dust days, a daily increase of 10 µg/m3 of PM10 increased daily mortality by 8.4% in Barcelona
(Spain) [15]. A 10 µg/m3 change in daily PM10 was associated with an approximately 1% increase
in cardiovascular and respiratory mortality in the Coachella Valley, California [16]. Dust storms in
Taiwan had a 7.66% increase in the risk for respiratory diseases [17], congestive heart failure [8] and
daily pneumonia hospital admissions [9]. Asian dust storms had a 4.1% increase in the rate of deaths
from cardiovascular and respiratory causes in Seoul, South Korea [18] and a significant increase in
respiratory hospitalizations in China [19,20]. Dust blown from the Sahara to the Eastern Mediterranean
resulted in an increase in all-cause hospital admissions including respiratory and cardiovascular
diseases in Nicosia, Cyprus [7]. An Australian dust storm which lasted for only one day resulted in
a 39% increase in hospital emergency admissions [21]. Increased asthma emergency admissions were
associated with Saharan dust in the Caribbean island of Trinidad [22] and with Asian dust in Toyama,
Japan [23].
      Little information is available on the assessment of health impact about dust storms and PM10
concentration levels in the Middle Eastern despite the facts that the region experiences frequent
dust storms [24] and is considered a major source of global dust [1,3,25]. Many studies from
Iran have demonstrated a positive association between dust particles and total mortality including
cardiovascular and respiratory mortalities [26–34] and hospital admissions for cardiovascular and
respiratory diseases [35,36]. Only three studies were conducted in Kuwait to determine the health
impact of dust storms on morbidity and mortality rates. A study conducted by Thalib and Al-Taiar [24]
concluded that dust storms had a significant impact on asthma and respiratory hospital admissions.
Al-Rifaia et al. [37] and Al-Taiar and Thalib [5] showed that dust storms had little impact on short-term
respiratory, cardiovascular or all-cause mortality.
      The primary objective of this study was to assess the environmental burden of outdoor air,
specifically dust storms and PM10 airborne concentration on the health impacts in Kuwait regarding
morbidity and mortality rates.

2. Experiments
    A prospective time-series study of daily PM10 concentrations and daily morbidity and mortality
through hospital admissions were evaluated in a single district in Kuwait, Ali Sabah Al-Salem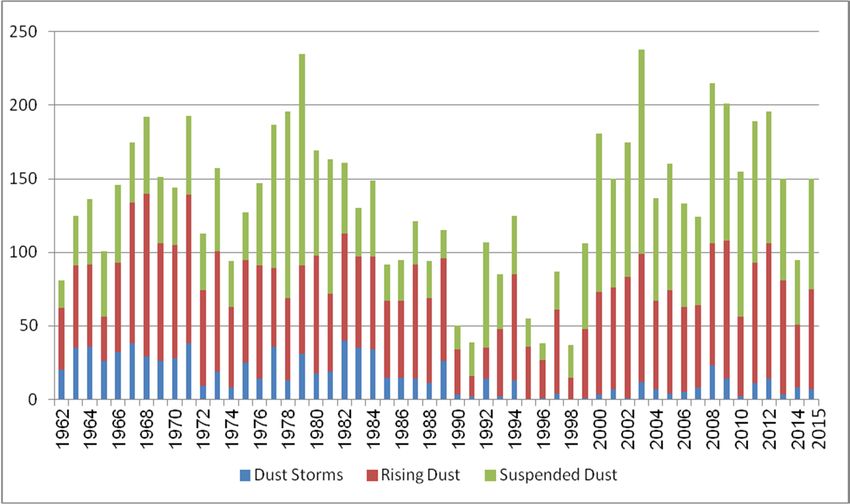
Atmosphere 2018, 9, 6                                                                                3 of 13

(ASA) during 2012. The effect of changes in daily levels of PM10 hospitalization for respiratory,
non-respiratory, cardiovascular and all-cause diseases was investigated using parametric (Pearson)
and non-parametric (Spearman) correlations. Daily attendance rates of air pollution-related group
of diseases in ASA primary health care center were evaluated. Daily attendance rates were adjusted
to correspond to hospital visits per week. Data collection also included daily PM10 concentration
levels, PM10 respiratory-related morbidity rates and mortality rates. Daily PM10 concentrations were
adjusted to represent weekly rates. The data of both PM10 and air pollution-related diseases allowed
for the investigation of the pattern of association between air pollution and morbidity by correlating
visits to public health centers for air pollution-related diseases and the daily measurements of PM10
pollutant level during 2012. Dust storms, rising dust, and suspended dust were collected from Kuwait
international airport station for the last 53 years (1962–2015). PM10 pollutant levels were obtained from
the Kuwait Environment Public Authority (KEPA) for the year 2012.

2.1. Study Area Description and Justification
      Ali Sabah Al-Salem (ASA) is a suburban area of 7.65 km2 , located south of Kuwait and it lies at
the terminal of the urbanization areas. The estimated population during 2012 was 48,685 residents, of
which 32,341 were Kuwaiti nationals. Although the area was recently built and inhabited, its occupants
complained of air pollutants. Air pollution in this area may be due to its proximity (within 4 km) to
industrial facilities which were established before the build-up of this community. ASA was considered
as the research study index district on the basis that its population was demanding for studying the
health impact of air pollution resulting from industries, and the fact that the district is located upwind
from natural environmental events, such as sand and dust storms. ASA contains fixed meteorological
stations that continuously monitor the level of air quality. Multiple air pollutants were studied during
the whole project. The air pollutants were grouped into three categories: gaseous pollutants (SO2 ,
NO2 , H2 S, O3 , CO, CO2 ), organic pollutant compounds (CH4 , NH3 , NCH4 ), and PM10 . PM10 and dust
storm events were investigated to determine their potential impact on morbidity and mortality rates.

2.2. Health Classification
      The International Statistical Classification System of Diseases and Related Health Problems
from the World Health Organization ICD-10 was used for health classifications in the study [38].
ICD-10 was endorsed in May 1990 by the Forty-third World Health Assembly. It is cited in more
than 20,000 scientific articles and used by more than 100 countries around the world. ICD is the
foundation for the identification of health trends and statistics globally, and the international standard
for reporting diseases and health conditions [38]. The list of a group of diseases related to air pollution
was used to determine the selected diagnosis. Each group of diseases was classified under a heading
following the ICD. A person may have one disease or more per year and coded as a case for each
one. Thus, the number of cases and the attributed estimate rates may exceed the total population in
some incidents. Respiratory diseases were identified by the ICD-10 codes J00-J99 and contain acute
upper respiratory infection (J00-J06), influenza and pneumonia (J09-J18), other acute lower respiratory
infection such as acute bronchitis (J20-J22), other diseases of upper respiratory tract such as chronic
rhinitis (J30-J39), chronic lower respiratory diseases such as emphysema (J40-J47), bronchial asthma
(J45-J46), and lung diseases due to external agents (J60-J70).

2.3. Quality Control
     Certain quality control measures were incorporated throughout the study period. Health records
of Kuwaiti citizens residing in ASA and meteorological records of the same district were investigated
prospectively during the same period. Primary health care morbidity and mortality data were obtained
from the information technology electronic database of the Ministry of Health of Kuwait. A case
with multiple admissions for different morbidities was counted as multiple cases. Records of cases
registered in Kuwait health information electronic file as suffering or dying from a pre-selected list
Atmosphere 2018, 9, 6 4 of 13 of air pollution-related releases were selected. A special format was used to record daily average of continuous measurements for the ten air pollutants mentioned above. A record of any case present in the selected health establishment but residing in another area was excluded from data analysis. Digital raw data about particulate air pollution was obtained from the database of Kuwait Environment Public Authority (KEPA) fixed station located in the selected district. Only 11 days (
Atmosphere 2018, 9, 6 5 of 13
Atmosphere 2018, 9, 6 5 of 13
Atmosphere 2018, 9, 6 5 of 13
Figure 1. Total number of dust storms (DS), rising dust (RD) and suspended dust (SD) in Kuwait,
1. Total number of dust storms (DS), rising dust (RD) and suspended dust (SD) in
Figure 1962–2015.
Kuwait,Figure 1. Total number of dust storms (DS), rising dust (RD) and suspended dust (SD) in Kuwait,
1962–2015.
1962–2015.
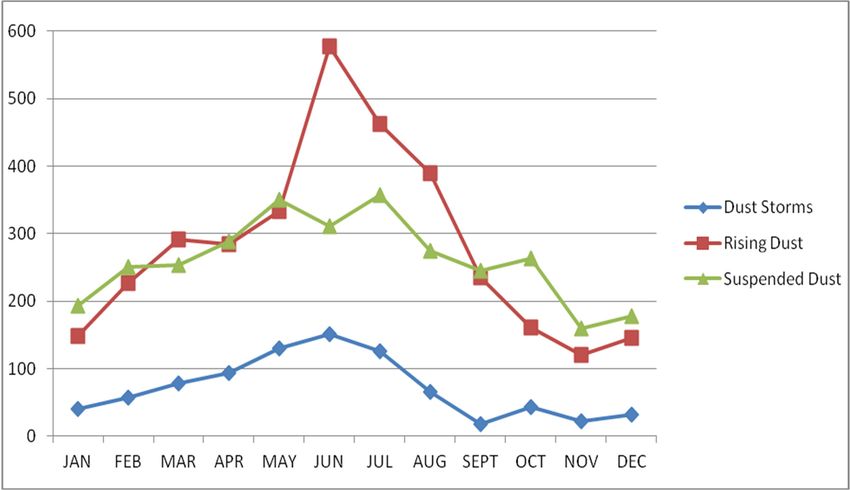
Figure 2. Number of recorded dust storms (DS), rising dust (RD) and suspended dust (SD) by month
(in ASA: Ali Sabah Al-Salem), 2012.
Figure 2. Number of recorded dust storms (DS), rising dust (RD) and suspended dust (SD) by month
2. Number
Figure (in ASA: of recorded dust storms (DS), rising dust (RD) and suspended dust (SD) by month
Table 1. Ali Sabah
Spearman’sAl-Salem), 2012.
Rank correlation matrix between dust storms, rising dust and suspended dust
(in ASA:inAli
ASA,Sabah Al-Salem), 2012.
Kuwait.
Table 1. Spearman’s Rank correlation matrix between dust storms, rising dust and suspended dust
Dust Type
in ASA, Kuwait.Rank
Table 1. Spearman’s correlation Dust Storm
matrix Rising
between dustDust
storms,Suspended
rising dustDust
and suspended dust in
ASA, Kuwait. Dust Storm 1
Dust Type Dust Storm Rising Dust Suspended Dust
Rising Dust 0.746 ** 1
Dust Storm 1
Suspended
Dust Type Dust 0.722 ** 0.709 ** 1
Rising Dust Dust0.746 Storm ** Rising
1 Dust Suspended Dust
** correlation is significant at the 0.01 level; p-value ≤ 0.01.
DustSuspended
Storm Dust 0.722
1 ** 0.709 ** 1
Rising Dust** correlation 0.746 **
is significant 1 p-value ≤ 0.01.
at the 0.01 level;
Suspended Dust 0.722 ** 0.709 ** 1
** correlation is significant at the 0.01 level; p-value ≤ 0.01.Atmosphere 2018, 9, 6 6 of 13
Atmosphere 2018, 9, 6 6 of 13
Figure 3 shows that the mean daily air concentration of PM10 for the year 2012 was 361 µg/m3 ,
which was 6.23 times 3 specified by the World Health Organization (WHO)
Figure showshigher
that thethan
meanthedaily
50 µg/m
air concentration of PM10 for the year 2012 was 361 μg/m3,
airwhich
quality
was guidelines
6.2 times [4]. Thethan
higher highest monthly
the 50 average by
μg/m specified
3 concentration of PMOrganization
the World Health 10 was recorded
(WHO)in June
(611
airµg/m
quality3 ) guidelines
with a maximum concentration
[4]. The highest monthly value 3369 µg/m3of
averageofconcentration , which wasrecorded
PM10 was much higher
in Junethan
the(611 μg/mEPA
Kuwait maximum 24-h concentration level of 350 µg/m3 [41] was
3) with a maximum concentration value of 3369 μg/m3, which much
(Table 2). higher
A totalthan thedays
of 104
Kuwait EPA maximum 24-h concentration level of 350 μg/m 3 [41] (Table 2). A total of 104 days
exceeded the maximum daily concentration level set by KEPA. The most probable explanation for
theexceeded
high PMthe maximum daily concentration level set by KEPA. The most probable explanation for
10 concentrations in June is due to sand and dust storm (SDS) events during the summer
the high
seasons in PM 10 concentrations in June is due to sand and dust storm (SDS) events during the summer
Kuwait. As shown at the bottom of Figure 3, a total of 14 SDS events were recorded by
seasons in Kuwait. As shown at the bottom of Figure 3, a total of 14 SDS events were recorded by
Kuwaiti meteorological stations during 2012 of which 60% (8 SDS events) occurred during the four
Kuwaiti meteorological stations during 2012 of which 60% (8 SDS events) occurred during the four
months of the summer season (May, June, July, and August). The month of January recorded the
months of the summer season (May, June, July, and August). The3month of January recorded the
lowest monthly average concentration level of PM10 (141 µg/m ) with a minimum daily value of
lowest3monthly average concentration level of PM10 (141 μg/m3) with a minimum daily value of
45 45
µg/m , a good justification for such low PM levels being related to lower SDS events in the winter
μg/m3, a good justification for such low PM1010levels being related to lower SDS events in the winter
season in Kuwait [24].
season in Kuwait [24].
Figure 3. Daily Pattern of PM10 concentration (in ASA) and number of sand and dust storms in
Figure 3. Daily Pattern of PM10 concentration (in ASA) and number of sand and dust storms in
Kuwait, 2012.
Kuwait, 2012.
Table 2. Descriptive statistics related to PM10 for ASA, Kuwait.
Table 2. Descriptive statistics related to PM10 for ASA, Kuwait.
PM KEPA 24-h WHO 24-h WHO Guideline
N Min Max Mean SD DES
Type Mean
KEPA 24-hGuideline
WHO 24-h for Annual Mean
WHO Guideline
PM Type N Min Max Mean SD DES
Mean Guideline for Annual Mean
PM10 354 45.18 3369.33 361.69 431.20 104 350 50 20
PM10 354 45.18 3369.33 361.69 431.20 104 350 50 20
SD:SD: Standard
Standard Deviation;
Deviation; DES DES
days:days:
DaysDays Exceeding
Exceeding KuwaitKuwait EPA maximum
EPA maximum 24-h concentration
24-h concentration level;
level; KEPA: Kuwait
Environment Public
KEPA: Kuwait Authority. Public Authority.
Environment
3.2.3.2. MorbidityIndicators
Morbidity Indicators
3.2.1.
3.2.1. AdjustedHealth
Adjusted HealthVisits
Visitsfor
for Respiratory
Respiratory Diseases
Diseases
Table
Table 3 3presents
presentsthe
theannual
annual adjusted
adjusted health
healthvisits
visitsand
andaverage
average visits perper
visits 1000 person
1000 of air
person of air
pollution-related respiratory and non-respiratory group of diseases in ASA health
pollution-related respiratory and non-respiratory group of diseases in ASA health center duringcenter during 2012.
Annual
2012. adjusted
Annual health
adjusted visits
health represent
visits the the
represent totaltotal
hospital admission,
hospital admission,while the average
while visitsvisits
the average
represent hospital admission rate per 1000 person. Health visits may include more than one hospital
represent hospital admission rate per 1000 person. Health visits may include more than one hospital
admission by a single patient. Figure 4 shows the annual adjusted health visits per 1000 person of air
admission by a single patient. Figure 4 shows the annual adjusted health visits per 1000 person of
pollution-related respiratory and non-respiratory group of diseases in ASA health center during 2012.
air pollution-related respiratory and non-respiratory group of diseases in ASA health center during
For the respiratory group of diseases, the highest annual attendance rate was observed for acute
2012. For the respiratory group of diseases, the highest annual attendance rate was observed for acute
upper respiratory tract infection (AURTI) (91,490 visits), which was followed by bronchial asthma
upper
(BA)respiratory tract
(8075 visits), infection
acute (AURTI) (91,490
lower respiratory visits), which
tract infection (ALRTI)was followed
(2499 visits),by
andbronchial asthma
other diseases of (BA)
(8075 visits), acute lower respiratory tract infection (ALRTI) (2499 visits), and other
upper respiratory tract infection (other URTI) (1473 visits). However, lower attendance rates werediseases of upper
respiratory tract infection (other URTI) (1473 visits). However, lower attendance rates were observedAtmosphere 2018, 9, 6 7 of 13
for chronic lower respiratory diseases (CLRD) (20 visits), and influenza and pneumonia (IP) (14 visits).
Table 4 presents the adjusted attendance rates (visits per week) to ASA health center during 2012.
Atmosphere 2018, 9, 6 7 of 13
It shows that patients with AURTI diseases constitute the highest number with an average of 1711 visits
per week, followed
observed by bronchial
for chronic asthma diseases
lower respiratory (148 visits per (20
(CLRD) week) and
visits), andALRTI (47and
influenza visits per week).
pneumonia (IP)
(14 visits). Table 4 presents the adjusted attendance rates (visits per week) to ASA health center
3. Annual
during
Table 2012. It adjusted
shows that health visits
patients and
with average
AURTI visits constitute
diseases per 1000 person of air
the highest pollution-related
number with an
average ofand
respiratory 1711 visits per week,group
non-respiratory followed by bronchial
of diseases in ASAasthma (148
health visitsduring
center per week)
2012.and ALRTI (47
visits per week).
Respiratory Group Adjusted Non-Respiratory Adjusted
Average Visits * Average Visits *
of Diseases Health
Table 3. Annual Visits health visits and average Group
adjusted of Diseases
visits per 1000 personHealth Visits
of air pollution-related
respiratory and non-respiratory group2772 Dermatitis &
of diseases in ASA health center during 2012.
AURTI 91,490 3124 93
Eczema
Bronchial Asthma
Respiratory Group of 8075Adjusted 246
Average Conjunctiva
Non-Respiratory Group 1606
Adjusted Average48
Diseases Health Visits Visits * Urticaria
of Diseases& Health Visits Visits *
ALRTI 2499 76 1001 30
AURTI 91,490 2772 Erythema
Dermatitis & Eczema 3124 93
Other URTI Asthma
Bronchial 1473 8075 44246 Diabetes
Conjunctiva 152
1606 48 5
CLRDALRTI 20 2499 0.676 IHD
Urticaria & Erythema 25
1001 30 0.8
Influenza & URTI
Other 1473 44 Diabetes 152 5
14 0.5 CIHD 2 0.1
PneumoniaCLRD 20 0.6 IHD 25 0.8
Influenza & * Average
14 0.5 visits per 1000CIHD
person. 2 0.1
Pneumonia
* Average visits per 1000 person.
91,490
100,000
8075
10,000 2499 3124
1473 1606
1001
1,000
152
100 25
20 14
10
2
1
Bronchial Asthma
Urticaria & Erythema
IHD
CIHD
Influenza & Pneumonia
Dermatitis & Eczema
AURTI
ALRTI
Other URTI
Conjunctiva
CLRD
Diabetes
Respiratory Group of Diseases Non-Respiratory Group of Diseases
Figure 4. Annual adjusted health visits of air pollution-related respiratory and non-respiratory
Figure 4. Annual
diseases adjusted health visits of air pollution-related respiratory and non-respiratory diseases
in Kuwait.
in Kuwait.
Table 4. Average hospital visits for respiratory diseases (visits/week) in ASA, Kuwait.
Table 4. Average hospitalRespiratory
visits for respiratory diseases (visits/week)
Disease Mean SD in ASA, Kuwait.
AURTI 1711 813.14
Respiratory Disease Mean SD
Bronchial Asthma 148 62.28
AURTI ALRTI 1711 47 26.43 813.14
Bronchial
AURTI—Acute UpperAsthma 148
Respiratory Tract Infection; ALRTI—Acute 62.28Tract Infection.
Lower Respiratory
ALRTI 47 26.43
3.2.2. Adjusted Health
AURTI—Acute UpperVisits for Non-Respiratory
Respiratory Tract Infection;Diseases
ALRTI—Acute Lower Respiratory Tract Infection.
The highest annual adjusted attendance visits per 1000 person for the non-respiratory group of
diseases were recorded for dermatitis and eczema (DE) (3124 visits), which was followed by disorders
3.2.2. Adjusted Health
of conjunctiva Visits
(1606 forurticaria
visits), Non-Respiratory Diseases
and erythema (1001 visits), and diabetes mellitus (152 visits),
The highest annual adjusted attendance visits per 1000 person for the non-respiratory group of
diseases were recorded for dermatitis and eczema (DE) (3124 visits), which was followed by disordersAtmosphere 2018, 9, 6 8 of 13
Atmosphere 2018, 9, 6 8 of 13
of conjunctiva
However, (1606heart
ischemic visits), urticaria
diseases (IHD) and
anderythema
chronic (1001 visits),
ischemic heart and diabetes
diseases mellitus
(CIHD) had(152 visits),
the lowest
However, ischemic heart diseases (IHD) and chronic
annual attendance rates (25 and 2 visits, respectively) (Figure 4).ischemic heart diseases (CIHD) had the lowest
annual attendance rates (25 and 2 visits, respectively) (Figure 4).
3.2.3. Correlation between PM10 and Morbidity
3.2.3. Correlation between PM10 and Morbidity
A correlation matrix is presented in Table 5 which provides the Pearson product-moment
A correlation
correlation betweenmatrix is presented
morbidity in Table
hospital visits due to 5 respiratory
which provides thetoPearson
diseases product-moment
ASA public health center
correlation
and the PMbetween morbidity hospital visits due to respiratory diseases to ASA public health
10 concentration levels during 2012. The table shows that PM10 concentrations are
center and the
significantly PM10 concentration
correlated levelswith
at the 0.05 level during 2012. The
bronchial table(rshows
asthma that
= 0.292). PM10 concentrations
Significant correlationsare at
significantly correlated at the 0.05 level with bronchial asthma (r = 0.292). Significant
the 0.01 level were shown between bronchial asthma and both acute lower respiratory tract infection correlations at
the 0.01 level were shown between bronchial asthma and both acute lower respiratory
(r = 0.737) and acute upper respiratory tract infection (r = 0.839). Figure 5 shows, to some extent, a tract infection
(r = 0.737)
similar and
trend acute upper
between respiratory tract
PM10 concentrations infection
and bronchial(r =asthma
0.839). hospital
Figure 5admissions
shows, to some
duringextent,
2012
a similar trend between PM 10 concentrations and bronchial asthma hospital admissions
and provides more evidence of the positive relationship between PM10 concentrations and bronchial during 2012
and provides more evidence of the positive relationship between PM 10 concentrations
asthma attendance rates. Although high PM10 levels were recorded during June and July, which and bronchial
asthma attendance
corresponded to the rates.
number Although high PM
of dust storms levelsand
10 June,
(3 in were
2 inrecorded during
July), asthma June andwere
admissions July, shown
which
corresponded
to to thebecause
be low, possibly numbermanyof dust storms
people in (3 in June,
Kuwait andoverseas
travel 2 in July),during
asthma admissions
the were shown
summer vacation.
to be low, possibly because many people in Kuwait travel overseas during the summer vacation.
Table 5. Pearson correlation matrix between PM10 concentration and respiratory diseases in ASA, Kuwait.
Table 5. Pearson correlation matrix between PM10 concentration and respiratory diseases in ASA, Kuwait.
Correlation Matrix PM10 Bronchial Asthma AURTI ALRTI
Correlation MatrixPM10 PM10 1 Bronchial Asthma AURTI ALRTI
PM10 Bronchial Asthma
1 0.292 * 1
Bronchial AsthmaAURTI 0.292 * 0.232 0.839
1 ** 1
AURTI ALRTI 0.232 0.255 0.839 **
0.737 ** 0.8271** 1
ALRTI 0.255 0.737 ** 0.827 ** 1
* correlation is significant at the 0.05 level; p-value ≤ 0.05; ** correlation is significant at the 0.01 level;
* correlation is significant at the 0.05 level; p-value ≤ 0.05; ** correlation is significant at the 0.01 level; p-value ≤ 0.01.
p-value ≤ 0.01.
700
600
500
400
PM10 (μg/m3)
300
Asthma (No. of Cases)
200
100
0
1 2 3 4 5 6 7 8 9 10 11 12
Month
Figure 5. PM10 concentrations and bronchial asthma admissions during 2012.
Figure 5. PM10 concentrations and bronchial asthma admissions during 2012.
3.3. Mortality Indicators
3.3. Mortality Indicators
Total death from all causes related to air pollution during 2012 in ASA was 23, corresponding to
Total death from all causes related to air pollution during 2012 in ASA was 23, corresponding
a death rate of 0.711 (23/32,341 total Kuwaiti residents in ASA). Table 6 demonstrates air pollution-
to a death rate of 0.711 (23/32,341 total Kuwaiti residents in ASA). Table 6 demonstrates air
related proportionate and cause-specific mortality rates in ASA during 2012. The burden of
pollution-related proportionate and cause-specific mortality rates in ASA during 2012. The burden
congenital anomalies and perinatal disease represent the primary causes of mortality with
proportionate mortality rates of 26.1% (6/23 × 100) and 17.4% (5/23 × 100) respectively and cause-
specific mortality rates of 1.86 (6/32,341 × 10,000) and 1.55 (5/32,341 × 10,000) per 10,000 persons,Atmosphere 2018, 9, 6 9 of 13
of congenital anomalies and perinatal disease represent the primary causes of mortality with
proportionate mortality rates of 26.1% (6/23 × 100) and 17.4% (5/23 × 100) respectively and
cause-specific mortality rates of 1.86 (6/32,341 × 10,000) and 1.55 (5/32,341 × 10,000) per
10,000 persons, respectively. Congenital anomalies also known as birth defects are structural or
functional metabolic disorders that occur during pregnancy and constitute a large mortality rate or
long-term disability worldwide [42]. The most common severe congenital anomalies are heart defects,
neural tube defects, and Down syndrome. Table 6 also shows that both respiratory and cardiovascular
diseases have similar mortality rates, equal to 0.62 per 10,000 persons, each corresponding to 8.7%
proportionate mortality rate.
Table 6. Proportionate and cause-specific mortality rates in ASA during 2012, Kuwait.
Cause of Mortality Number of Deaths Proportionate Mortality Rate % * Cause-Specific Mortality Rate **
Congenital Anomalies 6 26.1 1.86
Perinatal Disease 5 17.4 1.55
Respiratory Diseases 2 8.7 0.62
Cardiovascular Diseases 2 8.7 0.62
Non-Respiratory
1 4.3 0.31
Diseases
Diabetes Mellitus 1 4.3 0.31
Other Causes 7 30.5 2.16
Total 23 100%
* Defined as a percentage: the number of deaths from certain cause divided by total deaths from all causes (total
deaths = 23 during 2012); ** Defined as deaths from certain cause by 10,000 of mid-year ASA Kuwaiti population
(32,341 residents).
4. Discussion
The health impact of dust storms and PM10 concentrations have been thoroughly studied in
North America, Europe, and East Asia and to a lesser extent in Iran; however, only three studies
have explored the association between dust particulates and health morbidity or mortality in Kuwait,
of which two of the studies were done by the same authors [5,24]. Moreover, all regional Iranian
studies [26–36] have used the AirQ 2.3.3 software to model the health impact of short-term exposure to
PM10 ; this software was developed by the WHO to model European morbidity and mortality rates and
may overestimate the relative risk and increase prediction error if used by non-European countries
because of the obvious higher dust storm events and elevated levels of PM10 concentrations, especially
in the Arabian region. This study used actual cases of morbidity and mortality and concluded that
dust particulates were strongly correlated with acute lower/upper respiratory disorders and asthma.
This study also revealed that dust storms, suspended dust, rising dust and PM10 followed a similar
pattern throughout the studied period with high peaks during summer months, specifically in June,
and lower during winter months; this finding confirms the robust link between dust storm events and
ambient air PM10 levels and is in agreement with other studies in similar arid conditions [6,29,43,44].
Increased PM10 concentrations during the summer can be associated with the Middle Eastern dust
storms from the arid lands of Iraq, Jordan, and Saudi Arabia which are the particular sources of dust
events coming to Kuwait from the Northwest [2,29,45].
Two interesting studies by Thalib and Al-Taiar [5,24] used the generalized additive model (GAM)
to analyze hospital admission and mortality data about dust storms after adjusting for covariates.
This statistical model estimates the relative risk on admission and mortality counts, which typically
follow a Poisson distribution, after adjusting for potential cofounders like temperature, relative
humidity, weekday or weekend, and seasons as adjustment variables using various smoothing
parameters. In this study, we presented correlation variables (r) derived from bivariate plots. Estimated
effects from the time-series (GAM) model were not shown; however, proportionate and cause-specific
mortality rates were derived using simple mathematical calculations. Statistical modeling processes of
ecological time series studies are complex, and GAM models using R software (version 2.14.2) wereAtmosphere 2018, 9, 6 10 of 13
shown to produce problematic standard errors [5]; others researchers recommend the use of S-plus
software [46] which was not available during the current research study.
This study concluded that dust particulates were strongly correlated with acute lower/upper
respiratory disorders and asthma. Thalib and Al-Taiar [24] showed that Kuwaiti children with asthma
are particularly vulnerable to dust storm events. Other studies showed that respiratory admissions to
hospitals were attributable to PM10 concentrations above 20 µg/m3 [47]. An estimated effect of 3%
decline in daily forced expiratory volume (FEV1) change was observed for every 10 µg/m3 increase in
ambient PM10 level [48]. Other studies showed a strong association between dust events and asthma
admissions in Japan [23], Trinidad [22], Taiwan [49], South Korea [50,51] and southern Europe [52].
This study identified that cause-specific respiratory and cardiovascular mortality rates for all
pollutants including PM10 ranked third after congenital anomalies and perinatal diseases. Studies of
29 European cities [53] showed an increase in daily mortality with an increase in PM10 concentrations.
The impact of particulate matter on daily mortality has been shown by similar studies [54,55];
other studies demonstrated that short-term impacts of PM10 on mortality were exceeded even at
concentrations complying with the European air ambient monitoring regulation [56].
Some limitations of this study are the unknown composition of the chemical and biological dust
particles; future research should provide analysis of total dust and PM10 compositions and study the
link between the individual components and the health impact. Another limitation of this study is that
it did not consider intra-individual susceptibility to health disorders, particularly the impact of dust
storms on asthma patients; further epidemiological studies are needed.
5. Conclusions
The impact of dust storms on human health has drawn great interest of research from various
regions, especially in the western and east Asian countries; very little research was conducted to
study the association of Arabian Peninsula dust storms or PM10 levels and associated health impact.
The evidence on airborne particulates and its impact on morbidity and mortality are consistent in
showing adverse health effects in both developed and developing countries. Dust storm events and
PM10 concentration levels may vary across different regions in Kuwait, but only to a limited degree
because of the very small geographic area (17,000 km2 ) and similar climatic conditions across the
country. It is assumed that dust concentration variation may not be very significantly different across
multiple cities and individuals are most likely to be exposed to the same level of exposure. All the
population is affected, but susceptibility to the pollution may vary with health or age. Findings of
this study suggest that there are strong associations between dust storms and PM10 and morbidity
rates of asthma and acute upper and lower tract infections. The risk for various outcomes has been
shown to increase with exposure, and there is little evidence to suggest a threshold below which no
adverse health effects would be anticipated [3]. However, it may be worthwhile to further investigate
the health impact of dust storm events across Kuwait, and such further evaluation can improve our
understanding of the health impact of dust storms and PM10 pollutants.
Acknowledgments: The research study was initially triggered by the Kuwait Ministry of Health to assess the
health impact of Ali Sabah Al-Salem area in Kuwait; the study started in the year 2000 and was completed in the
year 2005. A recent project (2017) has been carried out at the Kuwait Institute for Scientific Research (KISR) and
was funded by the Kuwait Environment Public Authority (KEPA) (KISR no. EC109K), through a task entitled
“risk assessment study for dust storms”.
Author Contributions: Ali Al-Hemoud developed the research methodology, analyzed the data using SPSS
and finished writing the manuscript; Ali Al-Dousari provided significant details on dust fallout characteristics
and sandstorm trajectories and revised the manuscript; Ahmed Al-Shatti defined the health characteristics of
morbidity and mortality and defined the research theme; Ahmed Al-Khayat carried out the statistical analysis
using SPSS; Weam Behbehani analyzed the data and performed all figures, graphs, and tables; Mariam Malak
collected the meteorological data and presented the time-series analysis of PM10 pollutants.
Conflicts of Interest: The authors declare no conflict of interest.Atmosphere 2018, 9, 6 11 of 13
References and Note
1. Middleton, N.J. Desert dust hazards: A global review. Aeolian Res. 2017, 24, 56–63. [CrossRef]
2. Al-Dousari, A.M.; Doronzo, D.; Ahmed, M. Types, indications and impact evaluation of sand and dust
storms trajectories in the Arabian Gulf. Sustainability 2017, 9, 1526. [CrossRef]
3. Al-Dousari, A.M.; Al-Awadhi, J.; Ahmed, M. Dust fallout characteristics within global dust storms major
trajectories. Arab. J. Geosci. 2013, 6, 3877–3884. [CrossRef]
4. WHO. WHO Air Quality Guidelines for Particulate Matter, Ozone, Nitrogen Dioxide and Sulfur Dioxide:
Global Update 2005: Summary of Risk Assessment; WHO, World Health Organization: Geneva, Switzerland,
2006; p. 9, WHO/SDE/PHE/OEH/06.02.
5. Al-Taiar, A.; Thalib, L. Short-term effect of dust storms on the risk of mortality due to respiratory,
cardiovascular and all-causes in Kuwait. Int. J. Biometeorol. 2014, 58, 69–77. [CrossRef] [PubMed]
6. Draxler, R.; Gillette, D.; Kirkpatrick, J.; Heller, J. Estimating PM10 air concentrations from dust storms in Iraq,
Kuwait and Saudi Arabia. Atmos. Environ. 2001, 35, 4315–4330. [CrossRef]
7. Middleton, N.; Yiallouros, P.; Kleanthous, S.; Kolokotroni, O.; Schwartz, J.; Dockery, D.W.; Demokritou, P.
Koutrakis, P. A 10-year time series analysis of respiratory and cardiovascular morbidity in Nicosia, Cyprus:
The effect of short-term changes in air pollution and dust storms. Environ. Health 2008, 7, 39. [CrossRef]
[PubMed]
8. Yang, C.Y.; Cheng, M.H.; Chen, C.C. Effects of Asian dust storm events on hospital admissions for congestive
heart failure in Taipei, Taiwan. J. Toxicol. Environ. Health 2009, 72, 324–328. [CrossRef] [PubMed]
9. Cheng, M.F.; Ho, S.C.; Chiu, H.F.; Wu, T.N.; Chen, P.S.; Yang, C.Y. Consequences of exposure to Asian dust
storm events on daily pneumonia hospital admissions in Taipei, Taiwan. J. Toxicol. Environ. Health 2008, 71,
1295–1299. [CrossRef] [PubMed]
10. Bell, M.L.; Levy, J.K.; Lin, Z. The effect of sandstorms and air pollution on cause-specific hospital admissions
in Taipei, Taiwan. Occup. Environ. Med. 2008, 65, 104–111. [CrossRef] [PubMed]
11. Sicard, P.; Lesne, O.; Alexandre, N.; Mangin, A.; Collomp, R. Air quality trends and potential health effects:
Development of an aggregate risk index. Atmos. Environ. 2011, 45, 1145–1153. [CrossRef]
12. Sprigg, W.A.; Nickovic, S.; Galgiani, J.N.; Pejanovic, G.; Petkovic, S.; Vujadinovic, M.; Vukovic, A.; Dacic, M.;
DiBiase, S.; Prasad, A.; et al. Regional dust storm modeling for health services: The case of valley fever.
Aeolian Res. 2014, 14, 53–73. [CrossRef]
13. Schwartz, J.; Norris, G.; Larson, T.; Sheppard, L.; Claiborne, C.; Koenig, J. Episodes of high coarse particle
concentrations are not associated with increased mortality. Environ. Health Perspect. 1999, 107, 339–342.
[CrossRef] [PubMed]
14. Xie, S.; Yu, T.; Zhang, Y.; Zeng, L.; Qi, L.; Tang, X. Characteristics of PM10 , SO2 , NOx and O3 in ambient air
during the dust storm period in Beijing. Sci. Total Environ. 2005, 345, 153–164. [CrossRef] [PubMed]
15. Perez, L.; Tobias, A.; Querol, X.; Kunzli, N.; Pey, J.; Alastuey, A.; Viana, M.; Valero, N.; Gonzalez-Cabre, M.;
Sunyer, J. Coarse particles from Saharan dust and daily mortality. Epidemiology 2008, 19, 800–807. [CrossRef]
[PubMed]
16. Ostro, B.D.; Hurley, S.; Lipsett, M.J. Air pollution and daily mortality in the Coachella Valley, California:
A study of PM10 dominated by coarse particles. Environ. Res. 1999, 81, 231–238. [CrossRef] [PubMed]
17. Chen, Y.S.; Sheen, P.C.; Chen, E.R.; Liu, Y.K.; Wu, T.N.; Yang, C.Y. Effect of Asian dust storm events on daily
mortality in Taipei, Taiwan. Environ. Res. 2004, 95, 151–155. [CrossRef] [PubMed]
18. Kwon, H.J.; Cho, S.H.; Chun, Y.; Lagarde, F.; Pershagen, G. Effects of the Asian dust events on daily mortality
in Seoul, Korea. Environ. Res. 2002, 90, 1–5. [CrossRef] [PubMed]
19. Tao, Y.; An, X.; Sun, Z.; Hou, Q.; Wang, Y. Association between dust weather and number of admissions
for patients with respiratory diseases in spring in Lanzhou. Sci. Total Environ. 2012, 423, 8–11. [CrossRef]
[PubMed]
20. Jeong, S.J. The impact of air pollution on human health in Suwon city. Asian J. Atmos. Environ. 2013, 7,
227–233. [CrossRef]
21. Barnett, A.G.; Fraser, J.F.; Munck, L. The effects of the 2009 dust storm on emergency admissions to a hospital
in Brisbane, Australia. Int. J. Biometeorol. 2012, 56, 719–726. [CrossRef] [PubMed]Atmosphere 2018, 9, 6 12 of 13
22. Gyan, K.; Henry, W.; Lacaille, S.; Laloo, A.; Lamsee-Ebanks, C.; McKay, S.; Antonie, R.M.; Monteil, M.A.
African dust clouds are associated with increased pediatric asthma accident and emergency admissions on
the Caribbean island of Trinidad. Int. J. Biometeorol. 2005, 49, 371–376. [CrossRef] [PubMed]
23. Kanatani, K.T.; Ito, I.; Al-Delaimy, W.K.; Adachi, Y.; Mathews, W.C.; Ramsdell, J.W. Desert dust exposure is
associated with increased risk of asthma hospitalization in children. Am. J. Respir. Crit. Care Med. 2010, 182,
1475–1481. [CrossRef] [PubMed]
24. Thalib, L.; Al-Taiar, A. Dust storms and the risk of asthma admissions to hospitals in Kuwait. Sci. Total Environ.
2012, 433, 347–351. [CrossRef] [PubMed]
25. Washington, R.; Todd, M.; Middleton, N.J.; Goudie, A.S. Dust-storm source areas determined by the total
ozone monitoring spectrometer and surface observations. Ann. Assoc. Am. Geogr. 2003, 93, 297–313.
26. Miri, M.; Aval, H.E.; Ehrampoush, M.H.; Mohammadi, A.; Toolabi, A.; Nikonahad, A.; Derakhshan, Z.;
Abdollahnejad, A. Human health impact assessment of exposure to particulate matter: An AirQ software
modeling. Envirorn. Sci. Pollut. R. 2017, 24, 16513–16519. [CrossRef] [PubMed]
27. Miri, M.; Derakhshan, Z.; Allahabadi, A.; Ahmadi, E.; Conti, G.O.; Ferrante, M.; Aval, H.E. Mortality and
morbidity due to exposure to outdoor air pollution in Mashhad metropolis, Iran: The AirQ model approach.
Environ. Res. 2016, 151, 451–457. [CrossRef] [PubMed]
28. Goudarzi, G.; Daryanoosh, S.M.; Godini, H.; Hopke, P.K.; Sicard, P.; De Marco, A.; Rad, H.D.; Habizadeh, A.;
Jahedi, F.; Mohammadi, M.J.; et al. Health risk assessment of exposure to the Middle-Eastern dust storms in
the Iranian megacity of Kermanshah. Public Health 2017, 148, 109–116. [CrossRef] [PubMed]
29. Nourmoradi, H.; Khaniabadi, Y.O.; Goudarzi, G.; Daryanoosh, S.M.; Khoshgoftar, M.; Omidi, F.; Armin, A.
Air quality and health risks associated with exposure to particulate matter: A cross-sectional study in
Khorramabad, Iran. Health Scope 2016, 5. [CrossRef]
30. Mohammadi, A.; Azhdarpoor, A.; Shahsavani, A.; Tabatabaee, H. Health impacts of exposure to PM10 on
inhabitants of Shiraz, Iran. Health Scope 2015, 4. [CrossRef]
31. Zallaghi, E.; Goudarzi, G.; Geravandi, S.; Mohammadi, M.J. Epidemiological Indexes Attributed to
Particulates With Less Than 10 Micrometers in the Air of Ahvaz City During 2010 to 2013. Health Scope 2014,
3. [CrossRef]
32. Daryanoosh, M.; Goudarzi, G.; Rashidi, R.; Keishams, F.; Hopke, P.K.; Mohammadi, M.J.; Nourmoradi, H.;
Sicard, P.; Takdastan, A.; Vosoughi, M.; et al. Risk of morbidity attributed to ambient PM10 in western cities
of Iran. Toxin Rev. 2017. [CrossRef]
33. Khaniabadi, Y.O.; Daryanoosh, S.Y.; Amrane, A.; Polosa, R.; Hopke, P.K.; Goudarzi, G.; Mohammadi, M.J.;
Sicard, P.; Armin, H. Impacts of Middle Eastern dust storms on human health. Atmos. Pollut. Res. 2017, 8,
606–613. [CrossRef]
34. Geravandi, S.; Sicard, P.; Khaniabadi, Y.O.; De Marco, A.; Ghomeishi, A.; Goudarzi, G.; Mahboubi, M.;
Yari, A.R.; Dobaradaran, S.; Hassani, G.; et al. A comparative study of hospital admissions for respiratory
diseases during normal and dusty days in Iran. Environ. Sci. Pollut. Res. 2017, 4, 18152–18159. [CrossRef]
[PubMed]
35. Gharehchahi, E.; Mahvi, A.; Amini, H.; Nabizadeh, R.; Akhlaghi, A.; Shamsipour, M.; Yunesian, M. Health
impact assessment of air pollution in Shiraz, Iran: A two-part study. Iran. J. Environ. Health 2013, 11.
[CrossRef] [PubMed]
36. Naddafi, K.; Hassanvand, M.S.; Yunesian, M.; Momeniha, F.; Nabizadeh, R.; Faridi, S.; Gholampour, A.
Health impact assessment of air pollution in megacity of Tehran, Iran. Iran. J. Environ. Health 2012, 9.
[CrossRef] [PubMed]
37. Al-Rifaia, N.; Elmi, A.; Khan, A.R. Exploring possible seasonal trends in mortality rate in relation to age,
gender and environmental conditions in Kuwait: A preliminary analysis. J. Eng. Res.-Kuwait 2011, 8, 19–27.
[CrossRef]
38. International Statistical Classification of Diseases and Related Health Problems 10th Revision (ICD-10)
Version for 2010. Chapter X. Available online: http://apps.who.int/classifications/icd10/browse/2010/en
(accessed on 29 November 2016).
39. McTainish, G.H.; Pitbaldo, J.R. Dust storms and related phenomena measured from meteorological records
in Australia. Earth Surf. Process. 1987, 12, 415–424. [CrossRef]
40. World Meteorological Organization (WMO). Climate Change and Land Degradation WMO-No 989; WMO:
Geneva, Switzerland, 2005; ISBN 92-63-10989-3.Atmosphere 2018, 9, 6 13 of 13
41. KEPA, Kuwait EPA Regulations concerning the safety of workers in all establishments and the requirements
and criteria for adequate ventilation in enclosed and semi-enclosed public places. Articles 19 and 20 of
Kuwait Environmental Protection Act No. 42, Kuwait Al-Youm No. 1341, 2014.
42. Congenital Anomalies, Fact Sheet, World Health Organization. Updated 2016. Available online: http:
//www.who.int/mediacentre/factsheets/fs370/en (accessed on 1 September 2016).
43. Mirhosseini, S.H.; Birjandi, M.; Zare, M.R.; Fatehizadeh, A. Analysis of Particulate matter (PM10 and PM2.5 )
concentration in Khorramabad city. Int. J. Environ. Health Eng. 2013, 2. [CrossRef]
44. Shahsavani, A.; Naddafi, K.; Jafarzade, H.N.; Mesdaghinia, A.; Yunesian, M.; Nabizadeh, R.; Arahami, M.;
Sowlat, M.H.; Yarahmadi, M.; Saki, H. The evaluation of PM10 , PM2.5 , and PM1 concentrations during the
Middle Eastern Dust (MED) events in Ahvaz, Iran, from April through September 2010. J. Arid Environ. 2012,
77, 72e83. [CrossRef]
45. Al-Hemoud, A.; Al-Sudairawi, M.; Neelamanai, S.; Naseeb, A.; Behbehani, W. Socioeconomic effect of dust
storms in Kuwait. Arab. J. Geosci. 2017, 10. [CrossRef]
46. Dominici, F.; McDermott, A.; Hastie, T.J. Improved semiparametric time series models of air pollution and
mortality. J. Am. Stat. Assoc. 2004, 99, 938–948. [CrossRef]
47. Tominz, R.; Mazzoleni, B.; Daris, F. Estimate of potential health benefits of the reduction of air pollution with
PM10 in Trieste, Italy. Epidemiol. Prev. 2005, 29, 149–155. [PubMed]
48. Brauer, M.; Ebelt, S.T.; Fisher, T.V.; Brumm, J.; Petkau, A.J.; Vedal, S. Exposure of chronic obstructive pulmonary
disease patients to particles: Respiratory and cardiovascular health effects. J. Expo. Anal. Environ. Epidemiol. 2001,
11, 490–500. [CrossRef] [PubMed]
49. Tam, W.; Wong, T.; Wong, A.; Hui, D. Effect of dust storm events on daily emergency admissions for
respiratory diseases. Respirology 2012, 17, 143–148. [CrossRef] [PubMed]
50. Hong, Y.C.; Pan, X.C.; Kim, S.Y.; Park, K.; Park, E.J.; Jin, X.; Yi, S.M.; Kim, Y.H.; Park, C.H.; Song, S.; et al.
Asian dust storm and pulmonary function of school children in Seoul. Sci. Total Environ. 2010, 408, 754–759.
[CrossRef] [PubMed]
51. Lee, J.W.; Lee, K.K. Effects of Asian dust events on daily asthma in Seoul, Korea. Meteorol. Appl. 2014, 21,
202–209. [CrossRef]
52. Stafoggia, M.; Zauli-Sajan, S.; Pey, J.; Samoli, J.; Alessandrini, E.; Basagaña, X.; Cernigliaro, A.; Chiusolo, M.;
Demaria, M.; Díaz, J.; et al. Desert Dust Outbreaks in Southern Europe: Contribution to Daily PM10 Concentrations
and Short-Term Associations with Mortality and Hospital Admissions. Environ. Health Perspect. 2016, 124, 413–419.
[CrossRef] [PubMed]
53. Katsouyanni, K.; Touloumi, G.; Samoli, E.; Gryparis, A.; Le Tertre, A.; Monopolis, Y.; Rossi, G.; Zmirou, D.;
Ballester, F.; Boumghar, A.; et al. Confounding and effect modification in the short-term effects of ambient
particles on total mortality: Results from 29 European cities within the APHEA2 project. Epidemiology 2001,
12, 521–531. [CrossRef] [PubMed]
54. Tobias, A.; Perez, L.; Diaz, J.; Linares, C.; Pey, J.; Alastruey, A.; Querol, X. Short-term effects of particulate
matter on total mortality during Saharan dust outbreaks: A case-crossover analysis in Madrid (Spain).
Sci. Total Environ. 2011, 412–413, 386–389. [CrossRef] [PubMed]
55. Janssen, N.; Fischer, P.; Marra, M.; Ameling, C.; Cassee, F. Short-term effects of PM2.5 , PM10 and PM2.5–10 on
daily mortality in the Netherlands. Sci. Total Environ. 2013, 463, 20–26. [CrossRef] [PubMed]
56. Corso, M.; Blanchard, M.; Host, S.; Pascal, L.; Larrieu, S. Short-term impacts of particulate matter (PM10 ,
PM10–2.5 , PM2.5 ) on mortality in nine French cities. Atmos. Environ. 2014, 95, 175–184.
© 2018 by the authors. Licensee MDPI, Basel, Switzerland. This article is an open access
article distributed under the terms and conditions of the Creative Commons Attribution
(CC BY) license (http://creativecommons.org/licenses/by/4.0/).You can also read